
Introduction
Event history data has traditionally been collected by asking respondents retrospective questions regarding events that occurred in the past or since the last interview in longitudinal or cohort contexts (Wieczorek et al. 2020). Event history data provides valuable information to researchers to examine patterns of these events (e.g., childbearing dynamics) and their relationships to important life outcomes. Since the information is retrospective, the data can be subject to recall bias where respondents may not report, underreport, or overreport such events. Telescoping may also occur, with respondents reporting an event occurring more recently or more remotely compared to when it actually occurred (Bernard et al. 1984; Eisenhower, Mathiowetz, and Morganstein 2004; Sudman and Bradburn 1973). To improve event history collection, studies have used event or life history calendars (LHCs) in offline surveys, which have shown to improve the recall of past events by using visual cues, temporal anchors, and help improve answers to sensitive questions (Belli 1998; Glasner and Van Der Vaart 2009; Van Der Vaart 2004; Van Der Vaart and Glasner 2007).
As many high quality social surveys have moved to mixed-mode designs with an online mode, or to online-only modes (Maslovskaya, Struminskaya, and Durrant 2022), some studies have incorporated LHCs online (Glasner, van der Vaart, and Dijkstra 2015) or implemented revised versions of LHCs, such as using icons for events (Morselli et al. 2016), or a visual grid of calendars followed by a summary list of their previous inputs (West et al. 2022). These studies find that LHCs help improve data quality (Glasner, van der Vaart, and Dijkstra 2015; West et al. 2022) and response precision (Morselli et al. 2016). This study examines whether the introduction of a summary table after a series of questions about partnership and childbearing events improves data collection in a self-completion online survey. We piloted a summary table instead of a fully gridded calendar due to the difficulty in answering directly on the calendar using small screens (e.g., smartphones) and the complexity of the calendar, which would have added to the burden of the respondents in an already long survey. Respondents were provided a summary of their responses in a table format, which ordered their events chronologically.
The aim of the pilot study was to examine whether summary tables would help the respondent check and correct their dates and responses, thus improving data accuracy and subsequently, data quality. To test this, we used a technique commonly used at the online questionnaire design and testing stage called ‘cogability testing’ (Wilson and Dickinson 2021), combining cognitive interviews (Beatty and Willis 2007) with usability testing (Couper 2000).
Data and background
The Generations and Gender Survey (GGS) is one of the main outputs of the Generations and Gender Programme (GGP), an international research program that has collected survey data in 25 countries in Europe and beyond in the past 20 years (https://www.ggp-i.org/). The aim of the GGS is to capture the complexity of family formation and to understand how relationships and fertility have been changing over time. The GGS takes approximately 45 minutes to complete depending on the country context (Rijken 2022), raising concerns about increase in break-off rates. One of the main reasons for break-offs may be due to detailed and repetitive questions about the timing of previous partnerships formation and childbearing.
The UK GGS sampled individuals aged between 18 and 59 to collect data about early adulthood and mid-life experiences. The UK GGS was modelled on the standard GGS questionnaire and also asked UK-specific questions, e.g., questions about housing, ethnicity, and Brexit. While most GGS surveys have been conducted face-to-face, resulting in high quality fertility and partnership histories (Vergauwen et al. 2015), the UK GGS is one of the few surveys that has attempted to collect the data completely online.
Method
Before fielding the main survey in the winter of 2022/23, we used cogability testing to pilot the summary table, embedding it within a sub-set of GGS questions (which had already been fully tested). Cognitive interviewing examines whether the respondents’ interpretation of survey questions is consistent with the intended meanings of the questions, and whether the responses are exhaustive and understood by all respondents in the same way (Beatty and Willis 2007). Usability testing is interested in the design of the survey which focuses on how users interact with the survey using different devices such as PCs, tables, and smartphones. It includes measurable outcomes such as time taken to complete a task and number of errors made (Couper 2000). It is particularly advantageous when there are no best practices available yet, e.g., in an online survey which can be completed on various devices with different screen sizes (Geisen and Bergstrom 2017).
We used two methods in the cognitive interviewing and usability testing parts: ‘think aloud’ and ‘verbal probing.’ At the beginning of the interview, experienced interviewers trained respondents to ‘think aloud’ by adding any thoughts or opinions that came up when answering the online survey questions (Willis 2005). An advantage of this approach is that it provides unbiased feedback. ‘Verbal probing’ is a technique in which the interviewer asks the respondent targeted questions (probes) about either the survey content or functionality (Geisen and Bergstrom 2017). Probes were designed to gather respondents’ thoughts about the summary table, to check if respondents could edit incorrect dates, and to establish reasons for missing data and/or break-offs in the life histories responses.
Cogability testing interviews are qualitative in nature and rely on in-depth interviewing with small but purposively selected respondents. Since we wanted to examine the effectiveness of summary tables in improving recall, we deliberately recruited groups with more complex relationship and family histories. As seen in Table 1, we recruited twelve respondents between ages 18 and 59, split across genders, age groups, and self-reported digital confidence. All quotas on gender, age, and relationship history were met and quotas which included less digitally confident people were exceeded. The fieldwork was conducted in June and July 2022; all interviews were conducted online and recorded through Zoom with the respondents’ consent which lasted approximately one hour. At the end of each interview, respondents were emailed a code to redeem a £30 e-voucher.
Findings
Life history summary tables
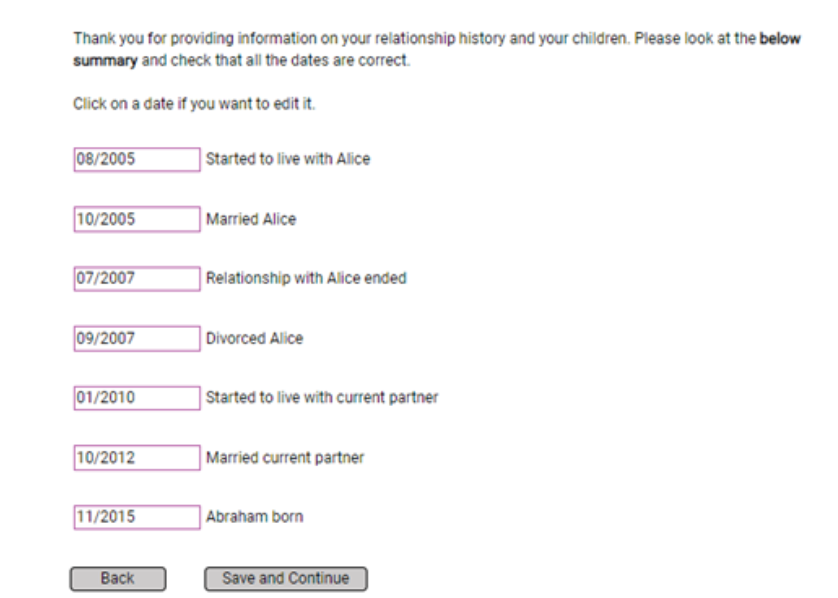
In the presence of the interviewer online, respondents were asked a subset of questions from the UK GGS, including a series of ‘life history’ questions, with answers that fed into a summary screen table.[1] Respondents were encouraged to use nicknames or pseudonyms for partners and children’s names. All dates were requested to be inputted in the format of [MM/YYYY]; the same format was used in the summary table. Respondents could enter ‘00’ if they did not want to enter the month. See Figure 1 for an example question.
.jpeg)
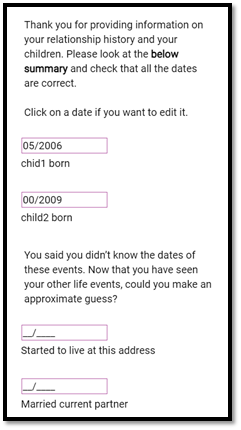
From Figure 1, the date that the respondent married their partner was then included in chronological order with other life history questions and presented to the respondent as illustrated in Figures 2 and 3. In this example, the corresponding response is 10/2012 ‘Married current partner’.


When viewing the summary table, approximately half of the respondents appeared to read the summary screen in detail, with the other half appearing to skim-read, as evident in the limited time spent on the summary table page recorded via paradata. Skimreading or speeding are found to be prevalent in web surveys (Baker et al. 2010; Conrad et al. 2017; Zhang and Conrad 2014).
Nearly all respondents did not find changing the dates intuitive. For example, some were confident about the year but not the month. In resolving their uncertainty, respondents entered a month either as ‘00’ or an approximate month, e.g., July ‘07’ for an event they knew happened in the summer. Another example is that respondents admitted that they were very unsure of the dates and had ‘made-up’ a date, despite a ‘don’t know’ option being readily available for them. One respondent said that these were “frustrating questions,” and they guessed the answers, believing that most people would do the same (Male, age 46–59, 2 partners, 1 child). Another respondent said that they had to guess their partner’s date of birth (Male, age 46–59, 3 partners, 3 children). Across all respondents who took part in the interviews, there were limited uses of the ‘don’t know’ option, suggesting that respondents were more likely to estimate/make up dates than not answer at all.
In general, respondents expressed that they understood how they could amend the dates within the summary table if they needed to. Despite this, only one respondent changed their date when presented with inaccurate dates in the summary table (Female, age 46–59, 2 partners, 2 children). No other respondents opted to change or amend any dates, even when they noticed they had entered dates incorrectly. When these respondents were asked why they had chosen not to amend incorrect dates, respondents generally expressed that they would be unwilling to share this personal information, which could have been due to guessing.
While some respondents liked the summary table, for example, one respondent felt it was nice to see their life story presented to them (Female, age 31–45, 3 partners, 3 children), others found that the presentation and information within the summary table made them feel uncomfortable. There were four clear examples of privacy concerns, described as follows. One respondent did not find the summary useful because it made them think about why anyone would need this information and that they would perhaps be tempted to delete it (Female, age 31–45, 1 partner, 4 children). In relation to the way the table was presented, a respondent felt the design was a little impersonal saying, “it comes across a bit business-like when you are actually talking about people’s lives” (Male, age 31–45, 3 partners, no children). The latter respondent elaborated by saying they would prefer the dates to appear embedded into a paragraph of prose. Upon seeing the summary table, one respondent said that if this were not an interview, they would have deleted all their information as they found it too intrusive to ask, “is Big Brother watching you?” (Female, age 31–45, 2 partners, 2 children). One respondent felt uncomfortable using their children’s names, even though they did not need to provide the child’s actual name or their full date of birth (Male, age 46–59, 2 partners, 5 children).
There were also clear privacy and security concerns, with respondents feeling unsure of why they were providing their personal information and what it would be used for, even if no privacy concerns were mentioned initially, and all respondents were reassured about anonymity and privacy of the information they would be provided at the beginning of the interviews. This general concern about privacy and security issues were felt by respondents with any number of children, regardless of age and gender.
Changes to the final questionnaire
Once the findings of the cogability interviews were analyzed and reported, we decided not to include the summary table in the final questionnaire. Although we had invested considerable resources into designing and implementing the summary table, we thought it is better not to risk respondents dropping out of the main survey or requesting to have their data removed before we are able to do further investigations in the future.
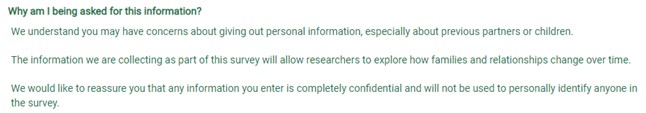
We did, however, keep the original full battery of GGS questions about respondents’ life history and implemented the following solutions. With regard to the intrusive nature of some questions, we implemented a specific help text box to explain the reasoning behind the collection of personal information (Figure 4). This information aimed to reassure respondents and to inform them of the purpose of the research.

When collecting information about the respondents’ children, the term ‘pseudonym’ was replaced with a clearer worded statement about using ‘a nickname, number, or initial.’ A help text was also created before the question stating, “The names or initials you provide here are used only in later questions for clarity to help you know which questions are being asked about each child. All names or initials provided will be deleted at the end of the interview.”
Discussion and conclusion
Our cogability study with an interviewer present suggests that including a summary table of life history events may not necessarily improve data quality in online surveys. About a third of respondents expressed privacy concerns in response to the summary table. Examples of privacy concerns included finding the life histories information to be intrusive, especially requests for information about their children. Respondents also became unnerved by the presentation of their personal information in the form of a summary table, with some saying they would withdraw their data after seeing it presented in this way. The respondents seemed to have thought about privacy concerns only after their answers were ‘summarized.’ Thus, including a summary table did not improve respondent’s likelihood to report potentially sensitive information and may even have increased the risk that respondents would withdraw from the survey, which were not desirable outcomes.
Our findings are in contrast with previous studies about LHCs in offline and online surveys (Glasner and Van Der Vaart 2009; Glasner, van der Vaart, and Dijkstra 2015; Morselli et al. 2016; Van Der Vaart 2004; Van Der Vaart and Glasner 2007; West et al. 2022). Our findings suggest that the way responses are displayed may provoke particular thoughts or behaviors. Previous studies have shown that certain types of questions can elicit new perspectives on a topic, leading respondents to become self-reflexive (Bay-Cheng 2017). The summary table seems to have reminded respondents of their own histories, making some of them uncomfortable about providing this information. Additionally, the results suggest that respondents may be more forthcoming about their own lives, but less so about others (e.g., their ex-partners). This, coupled with the presence of an interviewer and the nature of cogability testing may have elicited more negative reactions. However, it is difficult to disentangle whether these reactions are due to the setting, the format of the summary table presented after a set of questions, or the sensitive nature of the questions about other family members (in contrast to previous studies about the respondent’s sexual histories or personal life events), as few studies have used summary tables rather than LHCs, and none of these studies examined complex partnership histories.
Privacy concerns may stem from a lack of clarity about how respondents’ data are used, but we have little evidence if our inclusion of specific help texts improved respondents’ view about providing sensitive information online. In a UK experimental study, Jäckle et al. (2022) reported that respondents were less likely to consent to data linkage online than in face-to-face interviews because they were more concerned about privacy and the security of their data in online surveys. The authors also found that simplifying the readability of the consent request raised understanding but did not increase consent.
Given that the aim of the pilot was to improve data quality about sensitive retrospective information on top of administering other questions conventionally, we did not include the summary tables in our final survey due to the data quality and break-off concerns. Instead, we just used the standard GGS life history questions which had already been extensively tested. However, we recognize that our sample size of participants in cogability testing was small (usual for this type of testing), and during cogability testing, respondents were put in the role of “experts” to critique and improve the questions, making them more inclined to be critical. Further evidence is therefore needed to conclude whether summary tables can be useful in the context of collecting complex life histories in self-completion online surveys, especially given the efficacy of life history calendars in previous research. Future research is also needed to understand the relationship between users’ views about online privacy and their responses in online surveys. Finally, larger scale testing of summary tables is required to obtain conclusive results and to establish whether different types of summary tables are useful in online surveys, which are becoming more prevalent in the survey data collection landscape, and if yes, what can help to improve their functionality.
Funding
The UK Generations and Gender Survey (GGS) is funded by the UK Economic and Social Research Council (ESRC) Grant No. ES/V012770/1. Ethics approval is given by the National Centre for Social Research (NatCen) Research Ethics Committee.
Acknowledgements
We thank Generations and Gender Programme (GGP) and NatCen colleagues, including Joshua Mann, for their input in improving this manuscript. We would like to especially thank Professor Mick Couper from the University of Michigan (US) for his expert contribution in the implementation of the summary tables to the GGS online survey and also for his comments on the earlier version of the manuscript.
Ethics statement
Procedures for testing were approved by NatCen’s Ethics Committee prior to fieldwork being undertaken.
Disclosure statement
No potential conflict of interest was reported by the author(s).
Lead author’s contact information
grace.chang@sociology.ox.ac.uk
Department of Sociology, University of Oxford, 42-43 Park End Street, Oxford OX1 1JD, England, United Kingdom
See Supplementary Material Section A for example questions.