
BACKGROUND
“Heaping” is the tendency for survey respondents to round responses to numeric questions. Researchers have observed heaping for diverse topics, including questions on finances (Gideon, Hsu, and Helppie-Mcfall 2017), health (Holbrook et al. 2014), breastfeeding duration (Becker and Diop-Sidibé 2003), among other topics. But heaping of age has received the most attention. Age heaping occurs when respondents round their age to the nearest 5 or 10 years, either by rounding up or down. Age heaping is a potentially serious error because age is a central variable in survey eligibility, questionnaire skip logic, weighting, and substantive analysis.
Most literature on age heaping focuses on low- and middle-income countries (LMICs). The quality of age data is poor in various Censuses – e.g., in Iran (Yazdanparast et al. 2012), Nigeria (Dahiru and Dikko 2013), and Zambia (Bwalya et al. 2015). Age heaping also occurs in surveys: one article analysing Demographic and Health Survey (DHS) data in 34 sub-Saharan African countries over a 28-year period shows persistent age heaping, though the magnitude of heaping is not large (Lyons-Amos and Stones 2017). Another study using African DHS and Census data highlights major errors, particularly for older adults (Randall and Coast 2016).
The prevailing explanation for age heaping is that respondents are unaware of their exact ages, so they round their age (Pardeshi 2010) or interviewers round the respondent’s age (Yazdanparast et al. 2012) to a multiple of five. Indeed, birth certificate coverage is only 18% in Eastern and Southern Africa overall – and lower for rural and low wealth populations (Bhatia et al. 2017). Lower educational levels, illiteracy, and numeracy in LMIC may also lead to difficulties in reporting age (Lyons-Amos and Stones 2017). Other speculations include intentional manipulation of age to meet eligibility requirements for a survey (Bwalya et al. 2015), social desirability leading to age inflation or deflation (Bwalya et al. 2015; Randall and Coast 2016), or cognitive burden (Harling et al. 2014).
Virtually all research about age heaping in LMICs is based on face-to-face surveys or Censuses. However, computer-assisted telephone interviewing (CATI) has increased in LMICs dramatically recently (Maffioli 2020; Lau et al. 2019; Larmarange et al. 2016; Greenleaf et al. 2017). Research shows that it can be more challenging to measure complex concepts in CATI surveys in LMICs, especially numeric data (Abay et al. 2022; Abate et al. 2023; Lamanna et al. 2019). We are aware of one study on age heaping in CATI surveys in LMICs: Helleringer et al. (2023) reports significantly more age heaping in CATI surveys compared to face-to-face surveys in six African countries. It is possible that CATI, which lacks an in-person interviewer to probe and verify responses, may compound preexisting challenges of measuring age data in LMICs.
In this article, we investigate the levels and correlates of age heaping in eight large cross-sectional CATI surveys in Kenya and Nigeria. Our research addresses three research questions:
Research Question #1: How much age heaping exists in CATI RDD surveys in Kenya and Nigeria? We address this research question by calculating Whipple’s Index, a commonly used measure for age heaping.
Research Question #2: Is age heaping more prevalent among certain types of respondents (e.g., low education, women versus men, language)? We study this research question by comparing heaping by respondent education, gender, and language.
Research Question #3: How does the data collection process shape age heaping? We investigate the impact of call centers, interviewer gender, interviewer experience, week of data collection, and whether the respondent broke off versus completed the interview. This research question sheds light on a more general issue: whether age heaping is a respondent-level phenomenon as suggested by previous research (e.g., Bwalya et al. 2015; Lyons-Amos and Stones 2017; Randall and Coast 2016) or whether age heaping is sensitive to the data collection process.
DATA AND METHODS
Data
We use data from eight national CATI surveys from Kenya and Nigeria. The eight surveys were cross-sectional and independent of each other (i.e., a respondent did not participate in more than one survey). These surveys were part of a larger project: we use data from four waves (Waves 2, 3, 4A, and 4B) from each country. Languages included Swahili and English (Kenya) and English, Hausa, Igbo, and Yoruba (Nigeria). As an incentive for completion, respondents received approximately 1 US dollar in prepaid phone airtime.
Multiple call centers used RDD to interview the general population aged 15–69 in each country, with an oversample of women aged 15–24 (n = 79,143 completes for people aged 15–69 across all surveys). To mitigate non-response bias, which is common in CATI surveys in countries such as Kenya and Nigeria (Glazerman et al. 2023; Brubaker, Kilic, and Wollburg 2021), we used quota-based sampling (Lambrecht et al. 2023) by age, gender, education, and asset ownership. Once each quota group was filled, subsequent respondents from that quota group were screened out. Information about the surveys is provided in Table 1.
Analytic Sample
Our analytic sample for this study consists of 41,954 respondents who provided their age, consented to the survey, and reported their age as between 25 and 62. The English question to collect age is as follows: “Before continuing with the survey, can I ask how old you are?” (We collected age, not year of birth.) The original sample in the surveys was 15–69. We excluded 15–24-year-olds because we oversampled that group through within-household referral techniques (Glazerman et al. 2023), including that oversampling would compromise our analysis of age heaping, which requires random processes to generate age. We excluded 63–69-year-olds because Whipple’s index (our measure of age heaping, described below) has an upper cut off of 62 years.
Measuring Age Heaping
To measure age heaping, we use Whipple’s index (United Nations 1955), a longstanding and widely used method to measure preference for numeric responses ending in 0 or 5. A Whipple Index of 100 represents no age heaping; a Whipple Index of 500 indicates an exclusive use of numbers ending in 0 or 5.
The standard Whipple Index is based on the age range of 23–62. We slightly modified the index because we needed to exclude ages 23 and 24, given the oversampling in these surveys. We did not include ages 63-69 for consistency with other research on age heaping. To calculate the Whipple Index for ages 25–62, the number of respondents with heaped ages (ending in 0 or 5) are summed, and then divided by the total sample size multiplied by an adjustment factor – in this case, 8/38. The adjustment factor represents the 8 ages ending in 0 and 5 (25, 30, 35 … 60) and the 38 possible ages between 25 and 62 (inclusive.)[1] The formula is:
Whipple Index for ages 25−62=Σ(P25 + P30 + P35 … P60)838x Σ(P25+ P26 + P27+P28 … P62)
Analysis
Our analysis proceeds in three stages. All analyses were conducted in Stata version 18 and are unweighted because our interest is the sample of respondents. In the first stage, we present the distribution of age, as well as the distribution of the last digit of age (0–9). In the age range of our study (25–62), the numbers 0–9 appear exactly four times (e.g., “0” is the last digit for 30, 40, 50, 60), except for the digits 3 (33, 43, 53) and 4 (34, 44, 54), which appear three times. In the absence of age heaping, the distribution of the last digit should be equal for digits 0, 1, 2, 5, 6, 7, 8, and 9. The distribution of the last digit should be equal for digits 3 and 4.
Second, we report Whipple’s index for each survey overall, and separately by characteristics of respondents, interviewers, and call centers, These characteristics include (a) call center (the same data collection platform, sample, and other procedures were used across call centers, so there is no reason why call centers should differ with respect to age heaping); (b) respondent education; (c) language (English versus Swahili in Kenya)[2]; (d) the combination of respondent and interviewer gender; (e) interviewer experience (number of previous studies worked on); (f) whether respondent completed or broke off the survey; (g) week of data collection.
Third, we estimate a multivariate model to control for confounding because the descriptive results in the first two stages cannot control for correlations among independent variables. In this stage, we estimate two-level mixed effects logistic regressions, which nests respondents (level 1) within interviewers (level 2). The dependent variable is coded as “1” if the respondent’s age ends in 0 or 5 and coded as “0” if age ends in another digit. We estimate separate models for Nigeria and Kenya and include a fixed effect for survey wave. Independent variables include the characteristics in the first stage. Some independent variables have missing data, largely because of breakoff: for these cases, we included a separate category for “missing.” Models include a random effect for interviewers and respondents.
RESULTS
Figure 1 shows the distribution of single years of age for Kenya W4A. (The patterns and magnitude differ slightly by survey; we present Kenya W4A as an illustrative example.) Ages ending in 0 or 5 are shown in red; ages ending in other digits are in blue. The results show significant age heaping: for example, 6.7% are age 35, compared to only 1.9% with age 34 and 4.4% age 36. Heaping is notable at higher ages: respondents are 6.7 times more likely to be 60 rather than 61 (2.0 / 0.3).
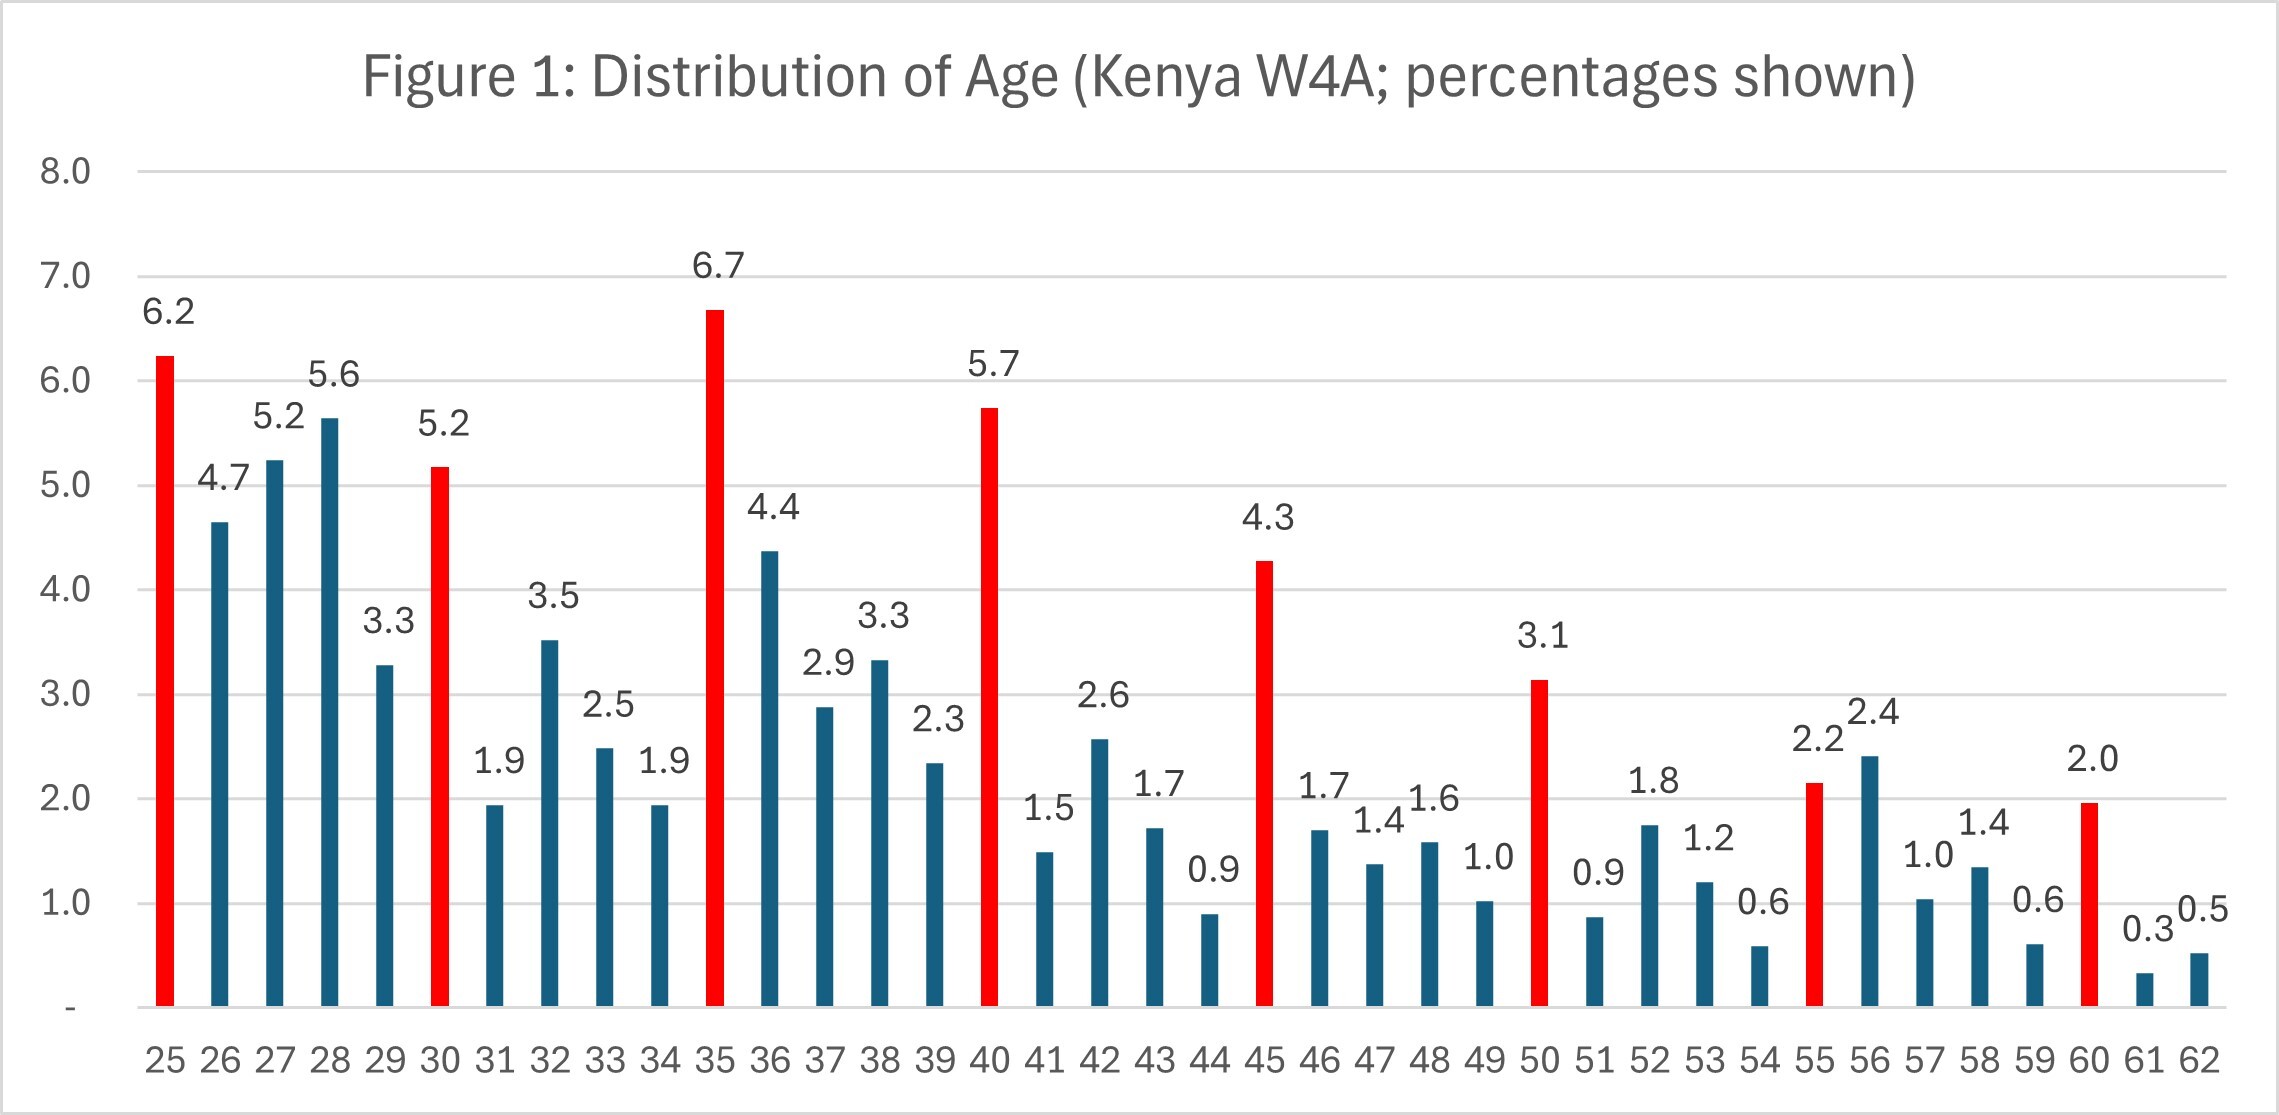
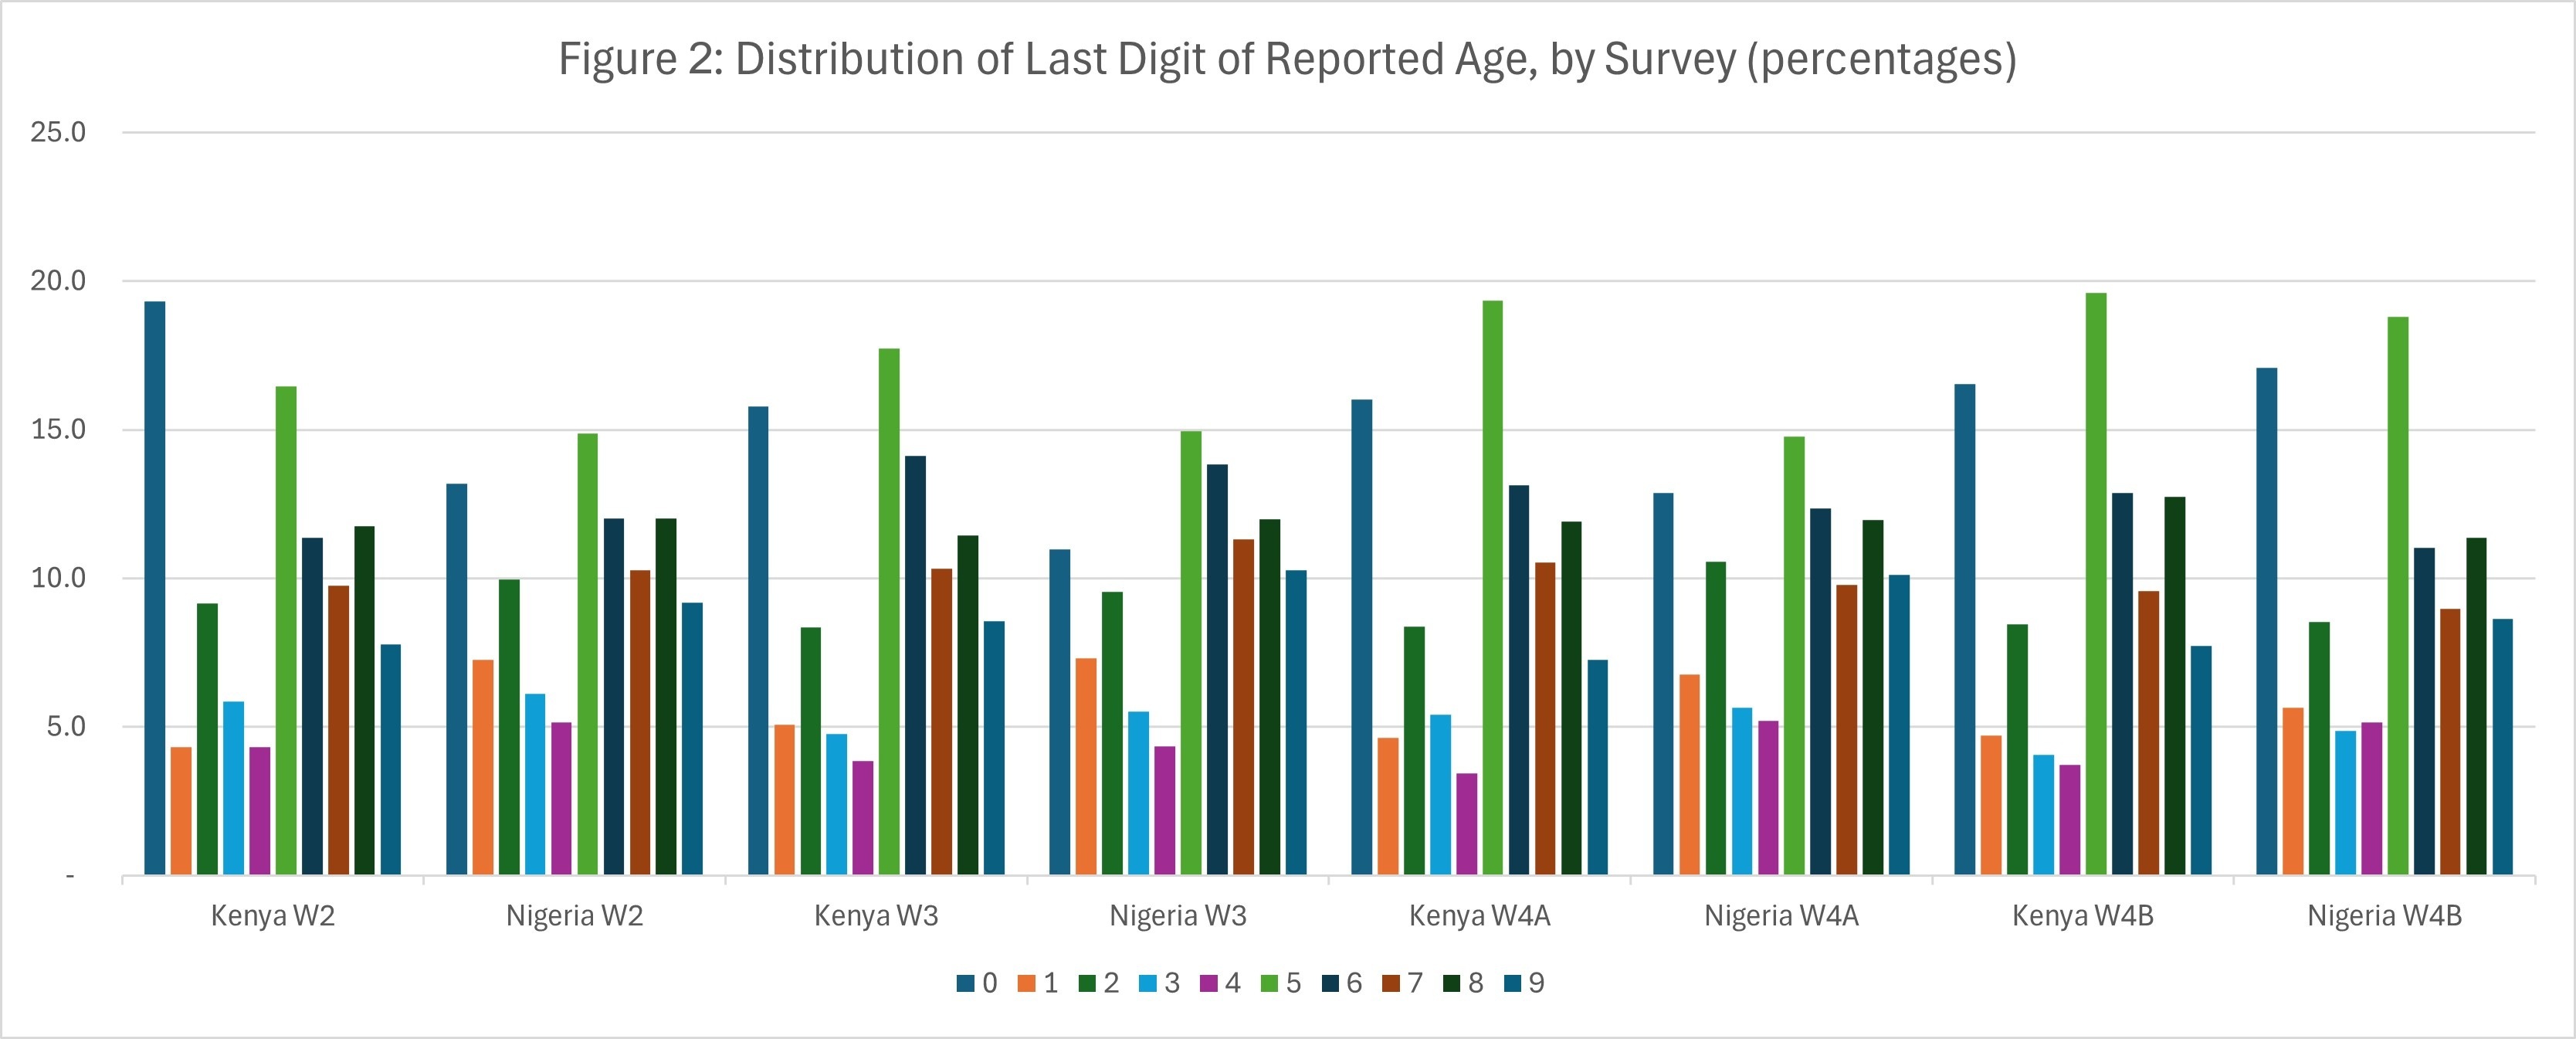
Figure 2 shows the distribution of the last age digit by survey. There is significant heaping. Although differences among surveys exist, ages ending in 1 are significantly less common than ages ending in 2.[3] In every survey, ages ending in 9 are less common than ages ending in 8, potentially because these respondents round their ages up (e.g., 39 rounded up to 40).

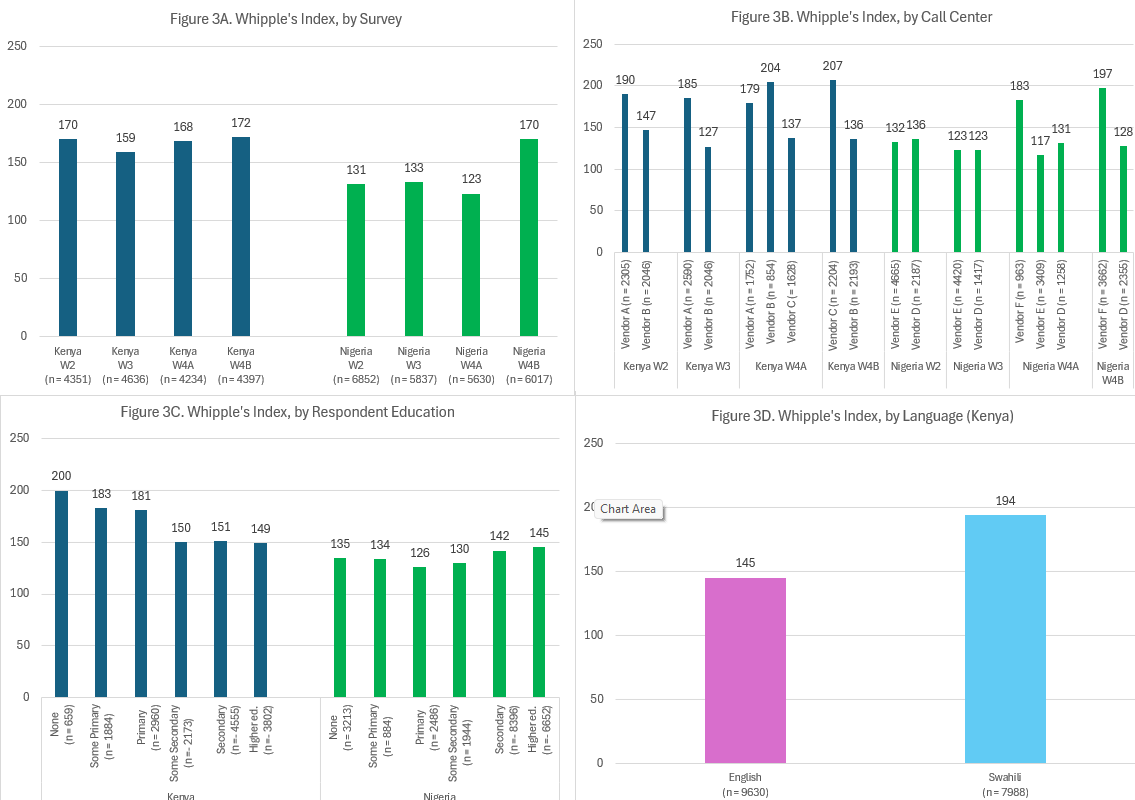
Figure 3A shows that Whipple’s Index is over 100 for all eight surveys. There was more age heaping in Kenya than Nigeria. Age heaping varied substantially across call centers (except for Nigeria Waves 2 and 3). Less educated respondents had more age heaping in Kenya, but there was no difference in Nigeria (Figure 3C). In Kenya, respondents speaking Swahili as the primary language in the interview had more age heaping than English (Figure 3D).
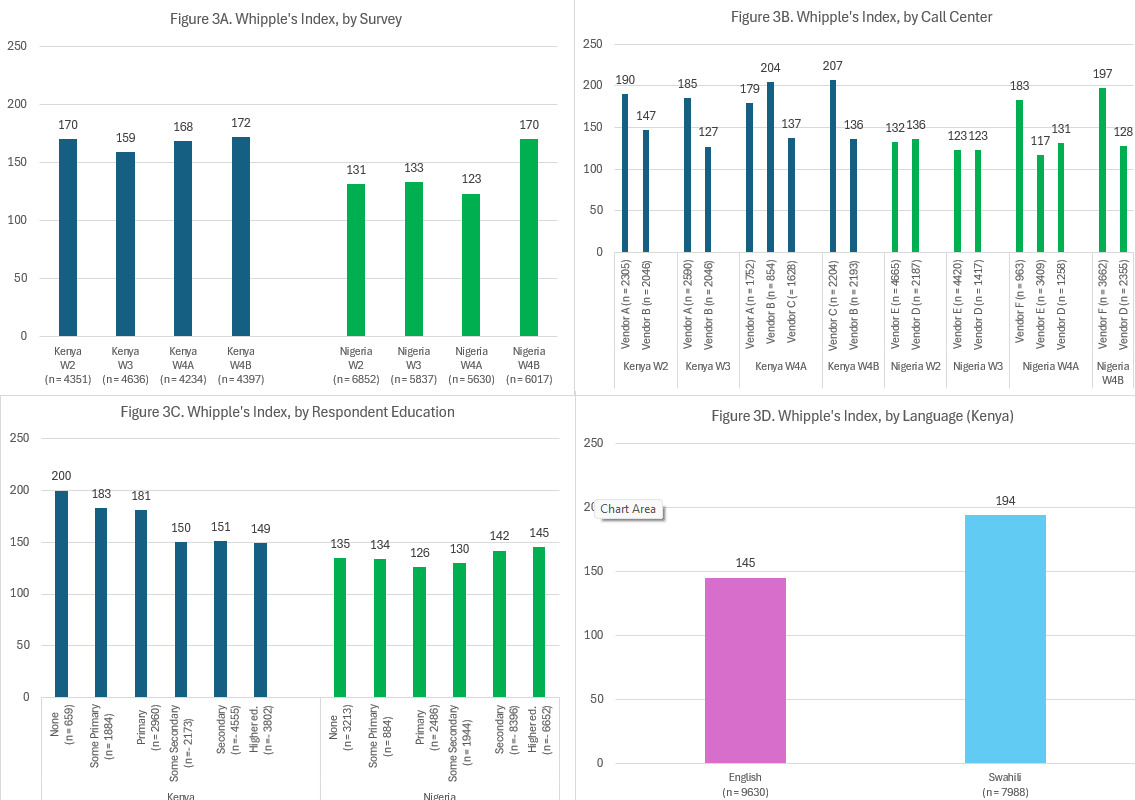
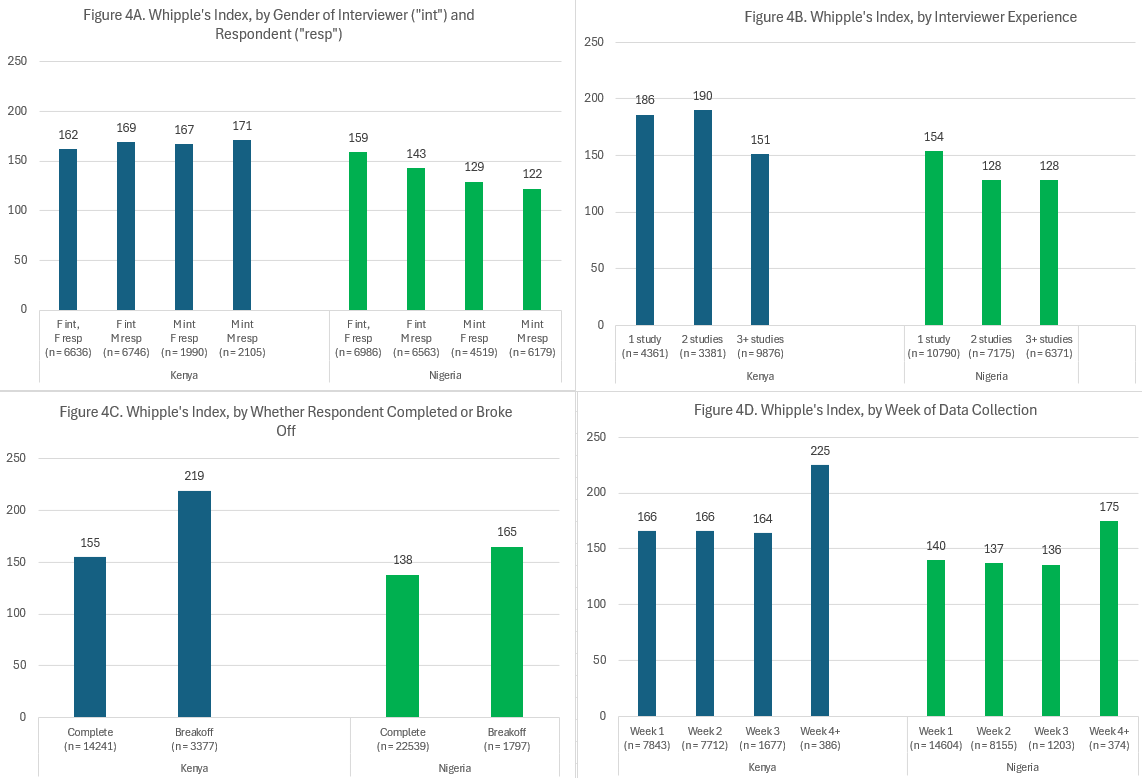
Figure 4A shows Whipple’s Index for combinations of female (“F”) and male (“M”) interviewers (“int”) and respondents (“resp”). In Kenya, there were no differences by gender. In Nigeria, Whipple’s Index is highest a female interviewer and female respondent (159), followed by female interviewer and a male respondent (143). Heaping is lower when there are male interviewers, either paired with a female respondent (129) or male respondent (122).
Figure 4B shows that interviewer experience is negatively associated with age heaping. There was substantially more age heaping when respondents broke off the survey, compared to when respondents complete the survey – especially in Kenya. This means that respondents who later break off the interview are substantially more likely to round age, compared to respondents who end up completing the survey. There was more age heaping in Weeks 4+ compared to the first 3 weeks in both countries.

Table 2 contains parameters for a multi-level model (see Methods section above for details) predicting age heaping. The conclusions from the Figures above generally hold. Age heaping is more prevalent among less educated respondents (Kenya only), Swahili speakers (Kenya only), female interviewers (Nigeria only), less experienced interviewers, breakoff interviews, and weeks 4+ of the data collection period (Kenya only). However, in contrast to Figure 3 above, the multivariate model shows no difference between Weeks 1 and 4+ in Nigeria (though this difference remains significant in Kenya). In Nigeria, the multivariate model suggests slightly lower odds of heaping in Week 2 compared to Week 1.
The random effect on the interviewer level is significant for both Kenya [χ2(1): 546; p < .01)] and Nigeria [χ2(1): 972; p < .01)], confirming that there is significant variation across interviewers in age heaping. The intracluster correlation (ICC) for the full model is 0.092 in Kenya and 0.111 in Nigeria: this means that while some variance is on the interviewer level, most variance is on the respondent level. Comparing the ICC between the full and null models shows that these interviewer characteristics explain 23% of variance on the interviewer level in Kenya (0.092 / 0.119) and 7% in Nigeria (0.111/0.120).
DISCUSSION
Our study observed high rates of age heaping in eight CATI surveys in Kenya and Nigeria. Data analysts should be aware of the potential of heaping to contribute to errors in age data, particularly when considering single years of ages. Categorical values of age may be useful to group respondents with others from a roughly similar age. There was more heaping at older ages, suggesting that using broader age bands may be more appropriate at higher ages.
We found that age heaping was highly sensitive to three aspects of the data collection process. First, some call center vendors had more age heaping, even though each vendor used the same sample, data collection protocols, and data collection platform. Differences in age heaping by call centers may reflect both the call center management, as well as the types of interviewers employed by the call center. Second, we found significant variation across interviewers in age heaping. In particular, more experienced interviewers produced lower levels of age heaping, potentially because these interviewers were better skilled at probing respondents to obtain an exact age or establishing rapport with respondents to motivate them to devote cognitive effort to provide their exact age. Third, we observed more age heaping later in the data collection period in Kenya, potentially because interviewers were fatigued after placing RDD calls for over 4 weeks, many calls of which resulted in a nonresponse or refusal. Greater age heaping in Weeks 4+ in Kenya is due to interviewers, not respondents: RDD samples were dialed randomly, and recontacts of nonrespondents were generally done within 1–2 days of the initial call, so less engaged or harder-to-reach respondents were not clustered at the end of the survey period.
Our finding that age heaping is sensitive to the data collection process has both practical and theoretical import. Theoretically, our results provide among the first evidence that age heaping is a function of the data collection process (e.g., interviewer quality, interviewer-respondent interaction, dynamics within call centers). Much of the age heaping literature speculates that age heaping is due to respondents not knowing their age. While we have no reason to doubt this is true, our results highlight the importance of another set of factors, which may compound the issue of respondents not knowing their age.
Practically, survey managers can act to reduce age heaping at different stages of the survey process. When designing questionnaires, researchers could test whether asking year of birth may produce higher data quality; indeed, Helleringer et al. (2023) show that the only CATI survey without elevated age heaping asked for year of birth, rather than age. Another strategy is to re-ask the age question at the end of the questionnaire once the respondent and interviewer have established rapport and the respondent has understood the importance of providing accurate responses. When recruiting interviewers, it is advisable to recruit more experienced interviewers. During training, interviewers should be trained to probe respondents and take seriously the process of collecting age data. During data collection, age heaping could be used as a useful interviewer-level quality monitoring performance indicator; interviewers (or vendors) with higher levels of age heaping could be subjected to additional scrutiny.
Limitations in our study point to directions for future research. Oversampling in ages 15–24 meant that we had to exclude these ages from the analysis; we are unable to study age heaping in this age range. Future research should examine this group in particular, especially to test whether youth round up their age in order to meet eligibility criteria (and receive the incentive.) Further, our study was unable to directly observe age heaping: future research based on audio recordings could help uncover the interpersonal dynamics that show why and how age heaping emerges. Beyond interviewer-respondent interactions, future research should explore how and why interviewers vary so much in age heaping – and how training and quality monitoring can help improve the quality of age data.
Lead author contact information
Charles Lau, PhD
223 Hawthorne Road, Raleigh, NC 27605
The standard Whipple Index uses an adjustment factor of 8/40 (i.e., 1/5) because there are 40 whole numbers of age between 23 and 62.
The vast majority of interviews in Nigeria were conducted in English (97%), so we limited our language analysis to Kenya.
Ages ending in 3 and 4 are also less likely, but this pattern is because these ages only occur three times (e.g., 33, 43, 53) in the age range 25–62, whereas all other digits appear four times.