
Introduction
Web surveys make it possible to reach respondents across the globe. At the same time, surveys that cover many cultures and languages need to work equally for all respondents (Leitgöb et al. 2023). Whereas the role of optimal translation procedures is widely acknowledged (Behr 2023), the question of how survey design might differently impact respondents from different cultures, even if the content of the question is the same, has so far received less attention.
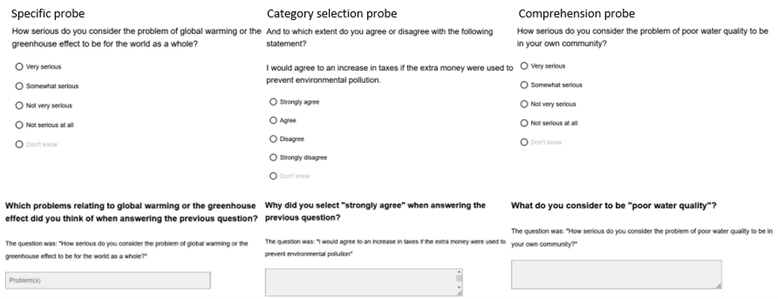
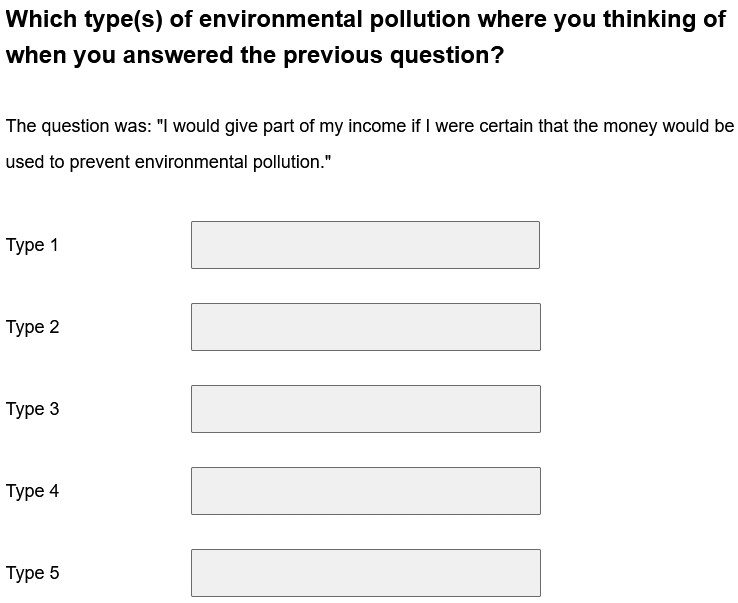
Open-ended questions have recently gained importance in survey methodology (Neuert et al. 2021; Singer and Couper 2017). Different open-ended questions exist that illicit information from respondents; for a classification, see Couper et al. (2011). List-style open-ended questions request short responses that capture aspects respondents think of regarding a specific issue (Keusch 2014; Meitinger and Kunz 2024). Web probing is the application of probing techniques from cognitive interviewing to assess the validity and comparability of survey questions (Behr et al. 2017). Probes are follow-up open-ended questions that ask respondents to provide additional information on the closed target question (Beatty and Willis 2007). Different probe types exist that ask for details in a question, for example, specific, comprehension, or category selection probes (Behr et al. 2017). Specific probes (SP) “focus on a particular detail of a term, on specific aspects that got activated in the context of a given question” (Behr et al. 2017, 5). If presented with multiple text boxes, they are labeled list-style SP; see Figures 1 & 2 for examples.


Since respondents have to verbalize their answers, open-ended questions and probes increase the response burden, which can be alleviated by optimal visual design (Smyth et al. 2009). This improves the response quality to open-ended questions in general (e.g., Emde 2014), of list-style open-ended questions (Hofelich Mohr, Sell, and Lindsay 2016; Keusch 2014; Smith 2019), and SP (Behr et al. 2014; Kunz and Meitinger 2022; Meitinger and Kunz 2024). An important visual cue is the number of text boxes. Multiple text boxes clarify that multiple themes are expected (Meitinger and Kunz 2024). In studies on open-ended questions, multiple text boxes augmented the number of themes (Emde and Fuchs 2012; Hofelich Mohr, Sell, and Lindsay 2016; Keusch 2014; Smyth et al. 2009). However, multiple text boxes also intensify the perceived response burden (Meitinger and Kunz 2024), which can increase item nonresponse (Fuchs 2013; Smyth et al. 2009).
For list-style SP, Meitinger and Kunz (2024) compared one text box with three, five, and ten list-style boxes in a German study. More boxes elicited more themes and reduced mismatches; that is, respondents providing answers to a different probe type rather than the one requested, but the increase was not linear. Experimental versions did not significantly differ regarding hard nonresponse (HNR, i.e., respondent leaves answer box empty) and soft nonresponse (SNR, i.e., don’t knows, refusals, or random letter combinations; Kaczmirek, Meitinger, and Behr 2017).
The overall recommendation based on previous research is to provide multiple answer boxes. However, all previous studies manipulating the number of text boxes were single-country studies from Europe (Fuchs 2013; Keusch 2014; Meitinger and Kunz 2024) or the US (Hofelich Mohr, Sell, and Lindsay 2016; Smyth et al. 2009), that did not assess cultural variations regarding the visual effect. Respondents from different cultures potentially react differently to visual input (Cenek and Cenek 2015; Cyr, Head, and Larios 2010; Würz 2006). The cognitive processes that are involved in answering survey questions (comprehension, retrieving information, forming a judgement, reporting the results) are likely to be influenced by visual design (Meitinger and Kunz 2024). Visual attention and cognitive style have been reported to differ between cultures (Čeněk, Tsai, and Šašinka 2021; Chua, Boland, and Nisbett 2005; Ji and Yap 2016; Šašinková et al. 2023) and differences in visual perception potentially influence response behavior (Tourangeau, Couper, and Conrad 2004).
Since the goal of web probing is to assess and improve the comparability and validity of survey items (Behr et al. 2017), the method and its visual design should be performing equally well across countries, even if cultures are very distinct from the US and European context. The American culture is often described as individualistic and focused on success, with a direct communication style (Hofstede 1980; Lewis 2006). In contrast, Indian culture is collectivistic and hierarchical, with a polite and indirect communication style (Hofstede 1980; Nishimura, Nevgi, and Tella 2008). India is currently the most populous country in the world (Worldbank, n.d.), and already has a long-standing survey culture (Lau, Marks, and Gupta 2018). Furthermore, India is a multi-lingual country, which makes it possible to also test the effect of language (proficiency). To the best of our knowledge, web probing has so far never been applied in India.
First, since the perceived response burden increases with multiple text boxes, more text boxes can demotivate and increase item nonresponse (Fuchs 2013; Smyth et al. 2009). Therefore, it is expected that both hard nonresponse and soft nonresponse increases with the number of text boxes. Moreover, since multiple text boxes can clarify the response task (Meitinger and Kunz 2024), it is expected that multiple text boxes reduce mismatches while increasing the number of themes mentioned.
Second, the visual design effect is expected to be moderated by cultural mechanisms as cultures differ in their communication style (Hall 1976). Low-context cultures, such as the US, use direct communication that emphasizes explicitness and clarity of the message and is more individualistic (Hofstede 1980). High-context cultures, such as in India, are often collectivistic (Hofstede 1980), and communication is more indirect (Kapoor et al. 2003) and influenced by human relations and hierarchy (Nishimura, Nevgi, and Tella 2008). For example, face is “the positive social value a person effectively claims for himself by the line others assume he has taken during a particular contact” (Goffman 1967, 5). It influences interpersonal communication (Bresnahan and Zhu 2017) and is found to differ per culture (Baig, Ting-Toomey, and Dorjee 2014; Yabuuchi 2004). Specifically, in collectivistic cultures preserving face is paramount because losing it affects the entire group (Merkin 2017). In India, face is closely related to izzat (honor) and sharam (shame) (Soni 2012) and balances between the wants and the needs of the individual and the group (Baig, Ting-Toomey, and Dorjee 2014). Moreover, face affects politeness (O’Driscoll 2017), and rules of politeness can affect response behavior. In some cultures, not answering a question is considered impolite, and respondents are more likely to opt for SNR instead of HNR (Meitinger, Behr, and Braun 2021). Furthermore, Indians tend to reduce disagreements with softened negative statements and apologies or by delaying their answer when disagreeing or refusing (Al-Sallal and Ahmed 2022; Valentine 1994). Therefore, the visual design effect might be counteracted by conversational norms in the Indian context, and we hypothesize that the visual design effect on soft nonresponse is weaker for Indian than for American respondents.
Third, language proficiency affects response behavior (Schwarz, Oyserman, and Peytcheva 2010); for example, second-language users often have a smaller vocabulary, a lower conceptual understanding of the depth of words (Kieffer and Lesaux 2015), and give less detailed responses (Walsh et al. 2013). India is a multi-lingual country with two official languages of government communication: Hindi and English (“Indian Constitution Part XVII,” n.d.), and about 10% of Indians speak English, often as a second or third language (Indian Census 2011). Therefore, we expect the visual design effect on the number of themes mentioned to be lowest for Indian English respondents. Lastly, due to lower language proficiency of Indian respondents who answer in English, we expect the visual design effect on mismatches to be lowest for Indian English because the clarifying effect of multiple text boxes is counteracted by a potential misunderstanding of the probe wording.
The current study extends the research by Meitinger and Kunz (2024) on visual design effects and compares a 1-box SP with a 5-box SP in two countries (US and India) to study the influence of culture and language (American-English, Indian-English, and Hindi) on response quality.
Data and Methods
Data collection and sample
Data were collected on Amazon MTurk in the US and India from December 2022 to May 2023. Intended sample size was 1,200 respondents, evenly distributed per language, gender, and age group (18–30, 31–50, and 50+ years old). We offered American and Indian respondents who completed the survey a compensation of $2.50, roughly coinciding with a minimum wage in the US (U.S. government, n.d.). Furthermore, we used MTurk users who had a HIT approval rate of 90% or more. We implemented IP HUB in our survey (Kennedy et al. 2020) to block users from outside India or the US and users of a proxy or virtual private server. We also used reCAPTCHA v2 and v3 in Qualtrics for bot protection. Indian respondents could participate in Hindi and English. For detailed documentation, codebooks and the data, see Arts, van de Schoot, and Meitinger (2024).
In total, 459 American respondents and 683 Indian respondents (English: 373, Hindi: 310) answered the survey. In our study, we excluded respondents with extreme survey duration (Berger and Kiefer 2021) and respondents who did not answer both target questions, which left 989 responses (American-English, AE: 415, Indian-English, IE: 327, Hindi, IH: 247). See Table 1 for sample size, demographics, and completion time by experimental group. Due to significant differences in age and gender (age: F(2, 983)=5.92, p=.015; gender: χ2(2)=10.20, p=.006), we included both variables as covariates in our analysis.
Experimental design
Based on a between-subjects design, respondents were randomly assigned to a 1-box or a 5-box condition at the beginning of the survey. The experiments were implemented in a questionnaire on environmental concerns, identical to questions from Module 5 of the World Value Survey (WVS 2014). We added the following target and probing questions:
TQ1: “To which extent do you agree or disagree with the following statement? I would give part of my income if I were certain that the money would be used to prevent environmental pollution.”
SP1: “Which type(s) of environmental pollution were you thinking of when you answered the previous question?”
TQ2: “How serious do you consider the problem of global warming or the greenhouse effect to be for the world as a whole?”
SP2: “Which problems relating to global warming or the greenhouse effect did you think of when answering the previous question?”
SP1 was implemented at the beginning of the survey, and SP2 was implemented in the middle of the survey.
Coding procedure
Based on the probe responses, we developed two code schemata that distinguish between substantive themes and methodological issues (e.g., mismatches, nonresponse types); see Appendix A and B for the coding schemata. Coding was done by two student assistants who received specific training. Intercoder reliability was high (SP1: 98%, SP2: 97%; Holsti, 1969)
Indicators
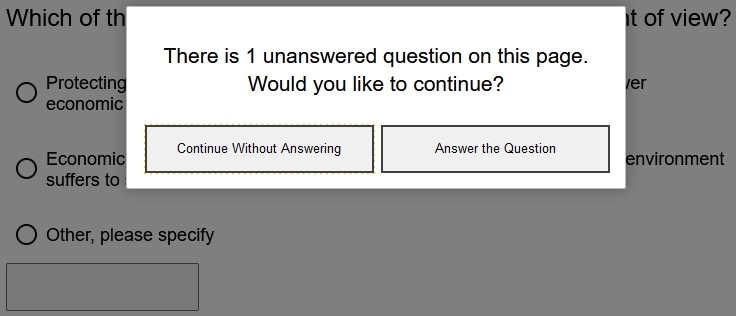
We distinguish between HNR (i.e., empty answer box) and SNR, where respondents provide an answer that is insufficient for coding (see Kaczmirek, Meitinger, and Behr 2017). Mismatches (MM) occur when respondents provide an answer to a different probe type than requested, e.g., a comprehension probe instead of a specific probe (Behr et al. 2017). The number of themes is the number of substantive themes that each respondent wrote in all text boxes of a probe.
Analysis
To test our hypotheses, we conducted a two-way ANCOVA (number of themes) and logistic regressions (SNR, MM). Due to the low prevalence of HNR, we refrained from conducting a logistic regression but reported a Fisher’s exact test instead. In the case of a significant language or interaction effect, we conducted post hoc tests. In all analyses, we added age and gender as covariates. Analyses were performed using R version 4.3.1 (R Core Team 2013).
Results
Hard nonresponse
HNR was low for all languages and box conditions; see Table 2. For SP1, Fisher’s exact test showed a significant difference between languages (p<.001) but not between number of boxes (p=.591). A Fisher’s exact pairwise comparison showed significant differences between AE and IE (p=.037) and AE and IH (p<.001), but not for differences between IE and IH (p=.052) For SP2, HNR was slightly higher, but Fisher’s exact test showed no significant differences between languages (p=.445) or box-conditions (p=.742).
Soft nonresponse
Overall, respondents opted more often for SNR than HNR, in particular in the 1-box condition and for SP1; see Table 2. For SP1, SNR was substantially reduced for AE and IH responses in the 5-box condition, but was high and stable across conditions for IE responses. SNR significantly differed (see Table 3) by number of text boxes (OR=0.38, p<.001) but not by language (IE: p=.213, IH: p=.257). There was a significant interaction effect between the AE 1-box condition and the IE 5-box condition (OR= 2.92, p=.003) but not between the AE 1-box condition and the IH 5-box condition (p=.995). For SP2, SNR did not significantly differ by number of boxes (p=.730), language (IE: p=.282, IH: p=.712), or interaction effect (IE: 5-box, p=.372, IH: 5-box p=.801).
Mismatches
For both probes and all language versions, mismatches were more frequent in the 1-box than in the 5-box condition. Mismatches significantly differed for SP1 by number of text boxes (OR=0.40, p=.007) and partly language (IE: OR=0.30, p=.002, IH: p=.103). There were no significant interaction effects (IE-5-box p=.571, IH-5-box p=.161). For SP2, there were no significant main effects (language: IE: p=.696, IH: p=.437; box condition: p=.341) and no significant interaction effects (IE-5-box p=.728, IH-5-box p=.605)
Number of themes
Across all languages and probes, respondents mentioned more themes in the 5-box than in the 1-box condition; see Table 2 & Figure 3. For both probes, number of boxes exerted a significant and large effect on the number of themes (SP1: F(1, 567)=470.08, p=<.001, ω2=0.17; SP2: F(1, 586)=11.56, p=.001, ω2=0.12) but language version did not (SP1: F(2, 567)=2.91, p=.055; SP2: F(2, 586)=0.18, p=.836), and neither did the interaction effect (SP1: F(2,567)=1.43, p=.241; SP2: F(2, 586)=1.19, p=.306).
Discussion and conclusion
In this study, we compared a 1-box with a 5-box design for list-style SP across three language versions: American English, Indian English, and Hindi. We implemented the experiment at two probes to evaluate whether previous one-country studies can be extended to more distant cultural contexts, potentially providing some support for a universal mechanism for response behavior. The overall results point in this direction because the 5-box design significantly reduced mismatches for SP1 and significantly increased the number of themes for both probes.
Our findings align with Meitinger and Kunz (2024), who conducted their study in Germany. Additionally, SNR was significantly lower in the 5-box condition. Although this effect has the opposite direction than hypothesized and diverges from previous research (Fuchs 2013), this finding provides even more support for using a 5-box design. Contrary to the previous indicators, we found significant differences across language versions for HNR for SP1. HNR does not significantly differ between the number of boxes. Due to the low HNR prevalence, we had to refrain from using a logistic regression, and the covariates age and gender could not be considered. Therefore, we cannot clearly disentangle the effect of language, gender, and age between language versions.
For SP2, most indicators showed similar patterns as for SP1, but only the number of themes significantly increased with five text boxes. Differences between probe responses can probably be linked to the placement in the questionnaire. SP2 was asked further along in the questionnaire, meaning respondents are more familiar with the topic and response task. However, respondents may experience survey fatigue (Scanlon 2019).
Our second research goal was understanding whether cultural mechanisms and language proficiency moderate the visual design effect. We hypothesized that rules of politeness counteract the visual design effect on SNR in the Indian context. For SP1, we found a significant interaction effect between language and visual design. SNR was lower in the 5-box condition than in the 1-box condition for AE and IH but not for IE responses. The pattern was reversed for SP2. The probe topic seems more relevant for SNR variations across visual design versions than cultural differences. Language proficiency also did not moderate the visual design effect on the number of themes and mismatches.
Our research findings underline the importance of optimal visual design for questionnaire developers. In our case, multiple text boxes clarified the task for the respondents, reducing nonresponse and mismatches and increasing the number of themes mentioned. These effects were not significantly moderated by cultural mechanisms or language. Only for HNR we found significant differences between language versions. Therefore, we recommend implementing multiple text boxes for list-style open-ended questions and specific probes in cross-national studies. Although we studied the US and India, similar effects are likely to appear in single country studies with a multicultural and multilingual sample (e.g., in the US or Canada).
Limitations and future research
This survey did not use data from a probability panel but recruited respondents on Amazon MTurk. However, we proactively addressed potential data issues during data collection and analysis. In addition, using a nonprobability panel is a common procedure in web probing studies since the goal is a validity and comparability assessment of survey measures and not to make statistical inferences to the general population (Behr et al. 2017).
In this study, highly educated[1] respondents are overrepresented in all language versions. This might lead to more people understanding the question, and thus to a reduction of nonresponse and mismatches. We expect lower educated respondents to rely more on the visual design than higher educated respondents. Therefore, the effect might be less pronounced in our study than in a study with a higher proportion of lower educated respondents.
We also implemented our experiment with two questions on environmental attitudes. Future research should replicate our experiment with other topics to exclude the topic specificity of the effects. In our study, we focused on one aspect of visual design (i.e., the number of answer boxes). Future research could assess, for example, the influence of text box size or color. In addition, effect sizes and model fit were relatively low, implying that adding more (culturally influenced) variables to the model might provide additional insights.
Acknowledgements
We thank Kyra Girán and Vidhi Ramnarain for their coding efforts. We would also like to thank the editors and reviewers from Survey Practice for their useful comments and suggestions.
Lead author contact information
Ingrid Arts, Department of Methods & Statistics, Utrecht University
Utrecht, Netherlands
i.j.m.arts@uu.nl
Education according to ISCED classification (UNESCO Institute for Statistics 2015). High: completed high school and higher (ISCED 4 and higher), low: unfinished high school or lower (ISCED 3 and lower).