

Introduction
The 2020 Census revealed that the multicultural population in the U.S., primarily comprising Blacks, Latinos, and Asians, numbered 120 million. This number is projected to grow to 208 million by 2060 (U.S. Census Bureau 2018). This rapid growth has increased the demand for products and services that cater to the needs of this linguistically and culturally diverse consumer segment, as well as the need for a workforce that understands these needs. Previous studies indicate that many Americans do not have a strong understanding of multicultural individuals and are likely to make errors in judgment regarding decisions that involve these groups. For example:
-
Medical residents who held false beliefs about Black patients were more likely to recommend inappropriate pain management therapy compared to white patients (Hoffman et al. 2016);
-
A Boston police academy was training police cadets to administer extra doses of pepper spray to Mexican suspects because it was believed that Mexicans had built a resistance to pepper spray due to consuming a lot of hot peppers (Tobar 1999); and
-
Hate crimes against Asians have escalated in the U.S. as an outcome of perceptions that they imported COVID-19 into the U.S. (Findling et al. 2022).
Why is Cultural IQ Lacking?: This apparent absence of “cultural IQ” or knowledge of different cultures stems in part from the increasingly racially segregated lifestyles of Americans who tend to live, study, worship, and socialize within their own race-ethnic communities (Rincón 2020). Errors in judgment can have important implications for decisions related to programs and research that include multicultural persons. The Nielsen Company, for example, lost its accreditation in recent years by the Media Ratings Council, in part due to measurement problems with Black and Hispanic households (Neff 2021). The Census Bureau has struggled in past years to improve the response rates of multicultural persons, especially immigrants, and has made significant improvements in recent years. Clearly, there is a need for an instrument that evaluates the knowledge, perceptions, and decision-making skills of persons whose responsibilities involve multicultural populations.
Cultural Intelligence is Not a New Concept: Attempts to measure cultural intelligence have been the subject of inquiry by past investigators. Organizational psychologists have explained that cultural intelligence means understanding the impact of an individual’s cultural background on their behavior, which is essential for effective business (Ang and Van Dyne 2015). Some of these tests have included the Chitling Intelligence Test (Dove 1971), The Black Intelligence Test of Cultural Homogeneity (B.I.T.C.H.) (Williams 1972), and the MQ or Multicultural Intelligence (Morse 2009). More recently, the Test of Latino Culture was introduced that measured knowledge of the U.S. Latino population (Rincón 2013).
Practices That Produce Misplaced Talent: Misplaced talent is costly to an organization and can lead to employee turnover, job dissatisfaction, poor sales, and decreasing market share. Misplaced talent is likely to occur in organizations that often rely on resumes; language abilities or ethnic background; occupational tests; and job interviewers who are not trained to evaluate the cultural knowledge of job applicants. The MIT was designed to be used in the hiring or recruiting process, especially in the research industry where knowledge of multicultural populations is important in the design and implementation of research studies.
The Multicultural Insights Test (MIT) was developed to address these shortcomings for industries increasingly dependent on a workforce capable of meeting the current and future demands for products and services aimed at culturally diverse segments.
Methodology
Development of the MIT: The MIT was designed as a diagnostic tool to evaluate knowledge, perceptions, and decision-making skills regarding U.S. Blacks, Latinos, and Asians. The team developing the MIT consisted of multicultural experts with significant experience in marketing, advertising, demography, survey research, and human resources. The MIT was content-validated based on the recognized expertise of the multicultural team using an approximation of the Delphi Method – a structured communication technique that relies on a panel of experts. The MIT results were designed to supplement other information (i.e., language skills and ethnic background) often used as key qualifiers for a person’s readiness to work with multicultural populations.
The MIT included 66 multiple-choice and single-choice (true or false) items that probed for information in five core areas including demographics, language behavior, history, lifestyles, beliefs, and perceptions. The second part of the MIT evaluated decision-making research skills and their relationship to the knowledge and beliefs of the test taker. Total and core area scores are reported as percent correct raw scores. The total MIT score was computed by the simple division of total correct responses divided by the total number of questions. Thus, a total score of 68% would result from a respondent who correctly answered 45 of the 66 total questions. There were also sub-scores for each of the five core areas and a specific sub-score for the decision-making core area. Both the total and sub-scores ranged from 0 to 100%. No weighting was used in computing the total MIT score and all dimensions contributed equally regardless of the number of items. Respondents were required to answer all questions. Appendix A shows the number of questions and sample questions by core areas.
Sample: The MIT was administered online to a non-random sample of respondents that included AAPOR network contacts (n = 2,000), CINT survey panel (n = 1,000), and various social media contacts (n = 600) responding to a press release. An invitation letter was sent to all respondents requesting their voluntary participation in the survey that did not include any incentive. A second reminder notice was sent three weeks after the initial contact. The number of completed online surveys received from contacts were: AAPOR (n = 15), CINT panel (n = 100), and social media (n = 112). Using these 227 respondents, we computed a reliability coefficient for the MIT of 0.92 using McDonald’s Omega procedure since it is considered a multidimensional scale.
Procedures: All three sample lists from the CINT panel, AAPOR listserv, and social media networks were uploaded into our online survey platform, Alchemer, and invitations were sent out to complete the MIT. While no incentive was offered, the invitation letter informed respondents that they would receive a complimentary test score profile. This profile would summarize their total score and sub-scores for each of the five core areas of the MIT (see the score profile in Appendix B). All responses to the MIT were analyzed using SPSS for descriptive statistics, reliability, and regression procedures.
Results
Demographic Profile: Table 1 presents a demographic profile of MIT test takers. A total of 227 respondents completed the MIT.
The sample of respondents was occupationally diverse, but less so in terms of education, gender, and race-ethnicity. Nearly six in ten respondents (57.7%) identified as non-Hispanic white, while 19.8% were Hispanic, 14.1% were non-Hispanic Black, and smaller proportions included non-Hispanic Asians (1.8%) and others (6.6%). In terms of employment status, 57.8% of respondents were employed, while the employment status of the other respondents included the partially employed (3.1%), unemployed (7.8%), self-employed (9.8%), students (5.7%), housewife/husband (3.9%), retired (9.8%) and others (2.7%). Two-thirds of the respondents were female (65.2%), and 70.1% held a bachelor’s degree or higher. In terms of age distribution, 24.2% of respondents were between 18 and 34 years old, nearly half (48.5%) were aged 35 to 54, and about 27.3% were 55 years or older. While the sample included a variety of respondents, it should not be considered representative of any particular population.
MIT Score Distribution: When examining the distribution of the MIT total scores (ranging from 0 to 100%), the scores approximated a normal distribution fairly well as shown by Figure 1. However, there appears to be a slight right skew in the distribution of the scores.

MIT Total and Subtotal Score Performance: Table 2 summarizes the performance on the MIT by all respondents. The range of the Total and Subtotal scores was 0 to 100%. The mean percent correct for the Subtotal Scores reveals that performance was relatively higher for the core areas of Beliefs-Perceptions (67.9) and Decision-Making (59.8), at the moderate level for Lifestyle (47.9) and History (47.4), and relatively lower for Language (37.2) and Demographic (27.7). One possible explanation for the lower scores in Demographics and Language is that the questions in these core areas required more recall of specific counts and trends while Beliefs-Perceptions and Decision-Making relied more on subjective judgments.
MIT Segments: Three MIT segments – Achievers, Safe Bets, Strugglers – were subjectively defined categories based on total MIT scores to describe persons who would likely require more or less supervision in completing a multicultural assignment. Each of the three MIT segments were described as follows:
-
Strugglers included respondents with Total MIT scores in the lower percentile range of 0 to 33%. In comparing crosstab responses on the Beliefs/Perceptions dimension by MIT Group (Strugglers, Safe Bets, Achievers), it was apparent that Strugglers showed the lowest number of correct responses on most of the 16 Beliefs/Perceptions items compared to Safe Bets and Achievers, which meant that they were less knowledgeable about multicultural persons and more likely to struggle in carrying out a multicultural assignment or task without additional training, support, and supervision.
-
Safe Bets included respondents with Total MIT scores in the mid-percentile range of 34 to 66%, which meant that they have an acceptable knowledge of multicultural persons but would benefit from training or support to carry-out a multicultural assignment or task, along with moderate supervision. Safe Bets also revealed fewer beliefs or perceptions than Strugglers that could be problematic in customer relations.
-
Achievers included respondents with Total MIT scores in the upper-percentile range of 67 to 100%, which meant they are more knowledgeable than Strugglers or Safe Bets about multicultural persons and more likely to carry out a multicultural assignment or task with a minimum of additional training or supervision. Achievers also revealed fewer beliefs or perceptions that could be problematic in customer relations or interactions.
In this study, only 14% of the respondents were classified as “Achievers” while “Safe Bets” were the largest segment representing almost two-thirds (63%) of the respondents. “Strugglers” represented almost one-quarter (23%) of the respondents. The large segment of Safe Bets and Strugglers underscores the need for further education and training on multicultural topics. These categories were not empirically tested and should not be generalized beyond the study sample nor beyond the limited number of decisions that were included in the study that will be expanded in future research.
Is more knowledge associated with improved decision-making skills? Figure 2 below presents the results of one of the decision-making scenarios that asked respondents to choose between several language options in a hypothetical study of Hispanics. To address this question, we compared the mean percent correct scores on the dependent variable (percent choosing the best option) for two groups – respondents with “correct” scores on the core area subtotal scores with respondents with “incorrect scores” – to determine which group made the best decision on the decision-making scenario. An analysis of variance (ANOVA) was conducted for each of the five core knowledge areas and showed that all comparisons were statistically significant (See Appendix C). As shown in Figure 2, respondents with correct scores in the core areas (blue shading) were more likely than respondents with incorrect scores (orange shading) to choose the recommended option of providing both language options. Apparently, more knowledge, especially in Beliefs and Perceptions, was associated with improved decisions involving judgments on this decision-making scenario.
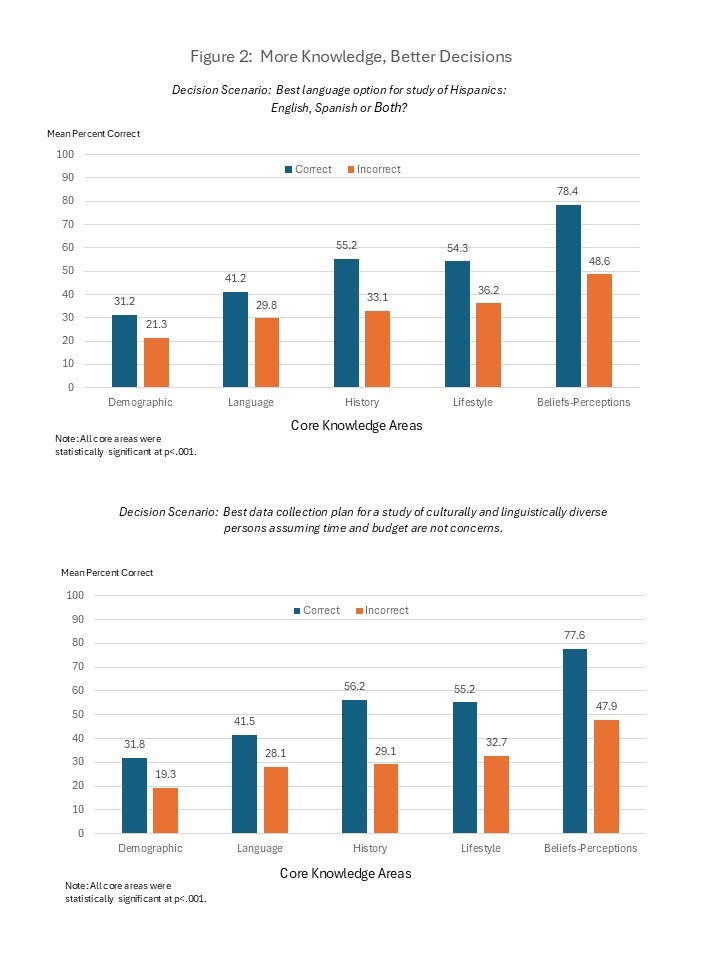
Using the same procedure described in Figure 2, respondents were asked to choose between several modes of data collection in a hypothetical study of multicultural persons. Figure 2 shows that respondents with “mean percent correct” scores in the core areas (blue shading) were more likely than respondents with “incorrect” scores (orange shading) to choose the recommended option of “mixed mode methodology with multiple language options.” More knowledge was generally beneficial in decision-making, especially for Beliefs and Perceptions, History, and Language. ANOVA results can be found in Appendix C.
How challenging were the decision-making research scenarios?
Table 3 below presents a summary of these six scenarios. The scenarios were quite challenging for many respondents. For example, the “percent correct” was lowest for scenarios involving the selection of a moderator for a Black focus group (47.6% correct) and the best approach for assuring the best representation of Hispanics in survey research (57.3% correct). Identifying potential problems with high satisfaction ratings in a survey of city residents (60.8% correct) and the recommended practice for screening Black, Latino, or Asian applicants for a job to market a product to multicultural consumers (60.4% correct) were also challenging for respondents. Choosing the best language option in a study of Hispanics (64.8% correct) and selecting the best data collection plan to maximize survey response rates in a culturally and linguistically diverse community (67.4% correct) were more likely to be answered correctly but still posed a challenge to one-third of the respondents. There is clearly a need to expand these scenarios to other relevant topics.
Which of the core areas best predicted performance on decision-making skills?
We conducted a linear regression to compare the relative contribution of each core area to decisions related to multicultural-related research scenarios (see Table 4). The subtotal score for Decision-Making represented the dependent variable that was calculated by summing all correct items related to decision-making and ranged from 0 to 100%. The independent variables included subtotal scores for Demographics, Language, History, Lifestyle, and Beliefs-Perceptions. The regression model accounted for 59% of the variance with an R-square of .593 and an F-value of 64.452, which was statistically significant with a probability of <.001. As shown by the Standardized Coefficients in Table 4, the weight of .466 for Beliefs and Perceptions contributed more strongly to Decision-making skills, followed by Lifestyle (.186). The coefficient for Language (.098) approached but did not achieve significance.
To assess the degree of correlation among the subdimensions used as predictors, we performed a multicollinearity test, as illustrated in Table 4. The column labeled “VIF” (Variance Inflation Factor) serves as a common indicator of multicollinearity, with values ranging from 1 (indicating no correlation) to 2–5 (indicating moderate correlation) and values over 5 (indicating potentially serious correlation). All VIF values associated with the predictors were below 2.6, indicating minimal multicollinearity among them.
What accounts for the greater significance of Beliefs and Perceptions? While we can only speculate, the regression results reinforce the earlier findings of the pain management study (Hoffman et al. 2016), highlighting that an individual’s beliefs and perceptions play a crucial role in how multicultural individuals are treated. Although knowledge regarding language, history, demographics, and lifestyle also impacted decision-making in research scenarios, its influence was less pronounced. These findings suggest that the process of screening individuals who are likely to be more effective in engaging with multicultural populations should prioritize psychological beliefs and perceptions—emphasizing value judgments over statistical facts or trends.
Discussion
Developing a diagnostic tool to identify multicultural talent was quite a challenging endeavor. However, through the combined expertise of our multicultural research team, we successfully identified essential knowledge areas for individuals currently working or aspiring to work on research projects involving U.S. Blacks, Latinos, and Asians. We organized this critical knowledge into five core areas: Demographics, Language, Lifestyle, History, Beliefs and Perceptions, and Decision-Making. The MIT instrument was designed with 66 questions that demonstrated a high degree of reliability in detecting differences in multicultural insights. Upon completing the assessment, test-takers received a summary of their total scores along with scores for each core area, as well as recommendations for enhancing their understanding of multicultural topics.
The study was a preliminary attempt to determine if multicultural talent can be conceptualized and translated into a diagnostic tool that provides test takers and organizations practical information that can be utilized in several contexts related to research. Individuals such as data collectors, support staff, and study managers can gauge their readiness to engage multicultural populations and take action to supplement their knowledge with relevant books, university courses, or workshops.
A similar approach can be applied in various sectors, including public service agencies and commercial companies. Additionally, workshop trainers can customize their training curriculum to address the specific needs of participants. Faculty and academic administrators can also recognize the demand for multicultural courses to complement traditional offerings.
Several limitations need to be addressed to improve the implementation of the MIT in the future. First, the current version is too lengthy and should be shortened to eliminate redundancy. Second, many questions focus on specific statistical knowledge that may not be easily recalled and the metric properties of the scales have not been formally validated. We recommend a factor analysis to reduce redundancy and define the factor structure, and validation of the total scores with external job-related criteria. Several test items would need to be updated on a periodic basis, such as Census Bureau figures or perhaps replaced with test items that discuss demographic trends instead of specific statistics that change annually. Third, the small sample size restricts inferences to certain subgroups, illustrating the need for a larger and representative, probability-based sample of test-takers to ensure that results can be generalized. Lastly, expanding the section on decision-making scenarios is crucial to enhance the validation of the core areas and their connection to judgments on relevant research issues that may arise in multicultural studies. Once these limitations are addressed, we are optimistic that members of the research industry will view the MIT as a valuable tool that complements traditional criteria—such as resumes, ethnicity, and language skills—for identifying and selecting multicultural talent.
Acknowledgments
Special thanks to two individuals who contributed to the development of the Multicultural Insights Test: David R. Morse with New American Dimensions and Jason Green with Greer Consulting Inc.
Appendices
-
Appendix A. Core Areas, Number of Questions and Sample Questions
-
Appendix B. Sample Score Profile
-
Appendix C. ANOVA Results to Support Figure 2
Lead author contact information
Edward T. Rincón, Ph.D.
Email: edward@rinconassoc.com
Address: 6060 N. Central Expressway, Suite 500
Dallas, TX 75206