1. Introduction
Questions about English proficiency are common in household surveys in the United States. The information gathered from these questions informs a variety of topics, including civic and urban planning, public health, politics, and sociological and anthropological research.
This study aims to gather information about how users of different languages understand and answer a question about English proficiency, with a particular emphasis on Spanish speakers and users of American Sign Language (ASL). The goals of this work are to (1) elaborate on adaptations to traditional cognitive interviewing methodology to work with deaf, deafblind, and hard of hearing participants, (2) learn more about how users of ASL respond to current survey questions about English proficiency, and (3) analyze what factors affect how respondents answer questions about English proficiency, especially whether those factors differ for users of different languages, in this case Spanish and ASL.
1.1. American Sign Language
The focus on ASL stems from a relative dearth of research on ASL users as a survey audience. ASL is a linguistically distinct language from English, with its own vocabulary and grammar. Users of ASL are a large population, although exact numbers are not available. The latest widely cited national estimates were 500,000 in 1974 (Beale 1974; Schein and Delk 1974), which are now over 50 years old. Because ASL users make up such a sizable portion of the United States population, it is important to consider how they interpret questions and what factors may affect how they answer.
Many ASL-users read and write in second languages like English. Other ASL-users may be bimodal bilinguals (see e.g., Emmorey et al. 2008), able to communicate in sign language or orally, or even code-blend, i.e., using the two modes simultaneously. Because of this, one of our research questions focuses on how ASL users understand questions about English proficiency and what factors they consider when deciding how to answer such a question.
It is important to note that there is a difference between measuring the number of deaf and hard-of-hearing people in the United States and measuring the number of ASL users. Not all deaf people use ASL and not all ASL users are deaf. This study focuses on measuring ASL users as a language group. The results of this study do not necessarily correlate to questions about hearing ability.
2. Literature Review
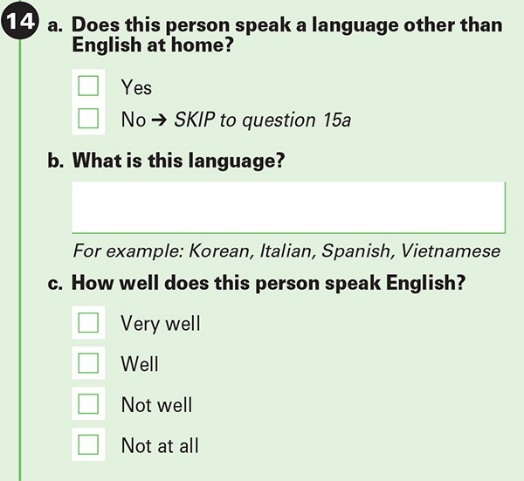
There has already been some research into how Spanish speakers answer questions about language use and proficiency. Leeman (2015) interviewed 59 monolingual or Spanish-dominant participants regarding the English proficiency question 14c in Figure 1 below. Some who responded “well” reported that they based their answer on their accent while speaking English. Some participants in Leeman’s study mentioned being able to hold a conversation as criteria for their answer, while others mentioned not speaking perfectly or not being able to understand some words.
There is relatively little current research about the deaf and ASL-using communities as a survey audience (pointed out by, e.g., Mitchell et al. 2006), although researchers in recent years have increasingly begun to address this (e.g., Kushalnagar et al. 2017; Mahajan et al. 2022; Boll et al. 2023). There has not been research to date, however, on how users of ASL interpret survey questions on English proficiency.
When fielding any survey question, pretesting the question is essential, and cross-cultural cognitive interviewing (see e.g., Willis 2015) is especially important. As Ridolfo and Schoua-Glusberg (2011) point out, cross-cultural cognitive interviewing can show that, while study participants might provide the same or similar answers to a question, different populations may not necessarily interpret the question in the same way. It is important to attempt to understand how respondents interpret a question to ensure that the correct intended data is being captured.
3. Methodology
Many surveys in the United States ask questions about English proficiency. While there are different versions of questions that ask about this, one widely used question is found in the following set of language use questions on the American Community Survey (ACS), shown below in question 14c in Figure 1. This paper focuses only on these questions of English proficiency.
_language_use_questions.jpeg)
This paper seeks to replicate Leeman’s (2015) findings and to investigate whether the same factors affect how Spanish speakers and ASL users interpret this English proficiency question. We include English speakers in this analysis to provide a baseline for the non-English languages that we have analyzed in this study. We also believe it is important to include Spanish-speakers in this analysis, not only to replicate Leeman’s (2015) findings, but to show that while ASL users respond differently to language use questions from English speakers, they also respond differently than speakers of other non-English languages. This highlights even further the importance of including ASL users in language and survey research.
Participants
For this study, we conducted 66 cognitive interviews in the spring/summer of 2022 across three languages: English (24 interviews), Spanish (23 interviews), and American Sign Language (19 interviews). The study consisted of participants from across the United States who were recruited for virtual interviews. Testing was conducted one-on-one with the test administrator (TA), with the addition of a sign language interpreter for ASL interviews. Sessions were occasionally observed by a notetaker or other observers who were members of the project team.
English- and Spanish-speaking participants were recruited from databases of participants who had been recruited for other studies. Additional Spanish-speakers were recruited from familial and social networks of the recruitment team. ASL participants were recruited by reaching out to a local university to share information about the study with potential respondents. We also shared links to our screening questionnaire on Facebook groups geared toward the deaf and ASL communities. Based on screener responses, we scheduled interviews with ASL users who reported using ASL as their primary language.
Participants in the English language interviews were primarily monolingual English speakers. We recruited solely monolingual Spanish speakers for the Spanish interviews. Participants in the ASL interviews reported using ASL or protactile ASL[1] as their primary language.
Interview Process
The interviews were conducted virtually using Microsoft (MS) Teams. Participants used their own personal devices (computer, tablet, or mobile phone) to complete a survey using the Qualtrics platform. MS Teams allowed the participant to share their screen and allowed the TA to observe as the participant completed the survey. The interviews ranged from 30 to 60 minutes and were recorded using Snagit or Camtasia.
Participants completed a short survey which consisted of typical demographic questions (Appendix A) and were asked to think aloud while they did so. They completed the survey with information about themselves and up to one other person from their household. Following the survey, the TA displayed questions from the survey to participants. Participants were then asked follow-up questions about how they interpreted the questions and their thought process while answering. All participants were asked all questions during debriefing, regardless of what questions they saw during the survey.
Part of the interview included the questions from Figure 1 above. As this question is designed, anyone who answers “No” to 14a are screened out of 14b and 14c. (They still saw these questions in the debriefing portion of the interview.) While there may be reasons that speakers of other languages may answer “No” to 14a, we decided to use the set of questions as they were designed for this testing. The question text of the English proficiency question is shown below in English and Spanish, modelled after the current English wording and Spanish translation used by the ACS:
English:
How well [do you/does NAME] speak English?
Very well
Well
Not well
Not at all
Spanish:
¿Qué tan bien habla [usted/NAME] inglés?
Muy bien
Bien
No bien
No [hablo/habla] inglés
While the question about English proficiency was consistent throughout all the testing, it is worth noting that the other questions participants may have seen earlier in the survey may have influenced their reactions.
The English and Spanish interviews were conducted in English and Spanish, respectively. The ASL interviews were primarily conducted using a free Video Relay Service (VRS), although the research team provided an in-house ASL interpreter if that was what the participant preferred. For interviews using our in-house interpreter, the interpreter joined the MS Teams meeting as a participant.
For interviews in which the participant opted to use VRS, the service connected the participant to an interpreter. In some cases, the interpreter was included as a participant on the Teams call; while in other cases, the VRS interpreter called the TA, and the TA put that call on speakerphone. In all cases, the participant either used multiple screens to be able to see the survey instrument on one screen and the interpreter on the other, or placed the windows side-by-side on their screen to see both simultaneously.
We had one deafblind participant in the study. For this participant, we used Sprint Relay, which connected the TA to an operator. The participant typed their comments out, which an operator read out loud to the TA. The TA would communicate through the operator who would type out the TA’s words, relaying them to the participant via a TTY keyboard.
Table 1 shows the demographics of participants in this study. It is notable that English and Spanish testing had much higher female representation. This was unintentional and a result of who responded to our recruitment materials. We do not believe this affected our results, but it is noteworthy.
5. Results and Discussion
Table 2 below shows the results of how users of different languages in this study responded to the question on English proficiency.
English
In total, 20 of the 24 English speakers were screened out of the English proficiency question because they responded that they did not speak a language other than English at home. During debriefing, English speakers generally thought the English proficiency question had to do with proficiency and fluency, and many participants gave the example that people should answer based on their ability to hold a conversation in English. While Table 2 shows responses during the survey, during debriefing, 22 English speakers selected that they speak English “very well,” and two selected “well.” One participant said he selected “well” because he has issues with mumbling, spelling, and his “hillbilly accent.” Another answered “well,” adding “would my English be good enough to speak with the Queen of England or something? I don’t know if it’s that good.” Many participants who answered “very well” noted that English is the only language they know.
Spanish
Two Spanish speakers were screened out of the English proficiency question because they responded that they did not speak a language other than English at home, despite completing the survey in Spanish. This is in line with a finding from Leeman (2015) who found a similar result of false negatives to that question. These participants still received all questions during debriefing.
Of the 21 other Spanish-speaking participants, 16 answered that they speak English “not well” and five responded “not at all.” The reasons participants gave for their answers often related to challenges with pronunciation, conjugating verbs in different tenses, and vocabulary.
When probed about what the English proficiency question means to them, many Spanish speakers also gave the example of being fluent and able to hold a conversation in English, and also brought up being able to be understood when speaking. One participant even went so far as to say it meant being able to “have a conversation with someone for fifteen to twenty minutes without stopping.” Another participant said, “Well, to speak it well, pronounce it well, so that people understand what you’re saying, and you understand what they’re saying.”
Some mentioned being able to defend themselves in English. While most participants gave examples related to speaking, many also brought up being able to understand when others speak English, and two participants mentioned reading English as part of what the question was asking.
ASL
All 19 users of ASL screened into the English proficiency question on the survey and had very mixed responses. Eight participants responded that they spoke English “very well,” two responded “well,” five responded “not well,” and four responded “not at all.” Some ASL users who answered “very well” said that they understood the question to include reading and writing in English. Other ASL users said that they answered “very well” or “well” because they had gone to an oral school or could vocalize English with some proficiency. These participants may be in line with what Emmorey et al. (2008) describe as bimodal bilinguals.
The ASL users who answered “not well” or “not at all” said that they thought the question focused on physically speaking or vocalizing English. One participant said, “I think it means do you use your voice to be able to speak English.”
The majority of ASL users said they understood this question to be asking about verbal English, although there was more variation than with English or Spanish participants. One participant said the question meant “Can I have a conversation with another person in spoken English?” One ASL user said that she would skip this question on a survey, saying “How well do you speak English, so that doesn’t pertain to me.” This participant mentioned that this question meant correct grammar, diction, and clearly spoken language without an accent.
Another ASL user said, “It could mean to speak, to talk, to verbalize the language, but I think the answer depends on other questions, about using English as a whole. Speaking, reading, writing.”
General Discussion
Overall, there seemed to be some differences in how users of different languages interpreted the English proficiency question, both regarding the word “speak” in the question and how they interpreted the response options. One consideration of this analysis is that participants in different rounds may have seen different alternate question wordings of previous questions in the survey, which may have influenced their answers. Although this is outside the scope of this paper, future research could delve into what type of an effect, if any, these previous questions might introduce.
While the English proficiency question would not normally be asked of English speakers in this series of questions because they are screened out of it, English speakers did not express any confusion or doubt about how to interpret or answer the question. Spanish speakers understood the English proficiency question as asking about spoken English. ASL users generally understood “speak English” in survey questions to mean physically spoken or vocalized English, although some understood “speak English” to mean English used in a variety of modes, including reading and writing.
It is important for researchers to consider the type of data they aim to collect in English proficiency questions. The use of the word “speak” in this type of question can have different meanings to different populations. As this study has indicated, some Spanish speakers focused on being able to understand others or being understood when they themselves are speaking, while ASL users in some cases understood “speak” to mean written language.
Based on our findings, we recommend that survey designers consider the reason they are asking an English proficiency question. If they are interested in English reading proficiency, it may be preferable to use an alternative wording that does not use the word “speak.” However, if survey designers are truly interested in English speaking proficiency, we recommend being transparent with survey respondents about this data need. If both reading and speaking are of interest, we recommend splitting the question into two separate questions to capture those data individually.
This study also illuminated that the answer scale for this English proficiency question is subjective to an extent, and a participant’s language or culture may impact the granularity with which they interpret the response options. We also recommend providing help text to give respondents more information about what each of the response options means and what respondents should consider when choosing their answer.
Notably, this study did not test any alternate wordings for the English proficiency question. We recommend future research test other question wordings and potentially alternate response options. We also recommend that future research include ASL users, not only for English proficiency questions, but for language-related questions more broadly.
6. Conclusion
This work has addressed an important topic in analyzing how users of different languages respond to a question about English proficiency. The inclusion of ASL users as a vital and linguistically unique survey audience fills a gap in research in this area. We have adapted traditional cognitive interviewing techniques to ensure that ASL users were included in our research and that their perspective is included. Although this study focused on ASL as a language group, our methods show the ease of including ASL users as participants in traditional cognitive interviewing, even when language may not be the focus.
In general, further research with the ASL-using community is especially important for questions regarding language use. As a sizable population within the United States, it is vital to consider how to reach ASL users as a survey audience and ensure the quality of their data and that their data is accurately reflected in survey results. We also hope that English proficiency and language use survey questions continue to be researched across languages and cultures to collect the most accurate and complete data possible.
Disclaimer
Any views expressed are those of the authors and not those of the U.S. Census Bureau. The paper has been reviewed for disclosure avoidance and approved under CBDRB-FY24-CBSM003-009.
Lead author contact information
Marcus Berger
marcus.p.berger@census.gov
This is a form of ASL utilized by deafblind individuals which uses touch as a means of communication.
Because the race question allows respondents to select all that apply, the total number of race responses may not match the number of respondents.