


Introduction
Following the 2020 COVID-19 pandemic, many companies transitioned to new working patterns and were rethinking how to best leverage office space (Barrero, Bloom, and Davis 2023). This paper outlines the process to develop a scaled survey research program to understand the success of the workplace under a hybrid work model. It included three research studies: foundational work to understand what outcomes were important to employees, instrument development to ensure items were measured accurately, and a field test to make sure items and processes were scalable to a larger population. This paper discusses the methods and findings for each of these studies and concludes with a discussion of the lessons learned that can be applied to the development or refinement of any survey research program.
Study One: Foundational Research through In-depth Interviewing
Overview
Our pre-2020 workplace survey was based on the assumption that employees primarily worked in their specific assigned office. Moving most employees to work from home during the pandemic provided an opportunity to start from scratch by conducting a foundational research study to explore the details of how work gets done and to better understand the unique value of the office in supporting these tasks.
Data and Methods
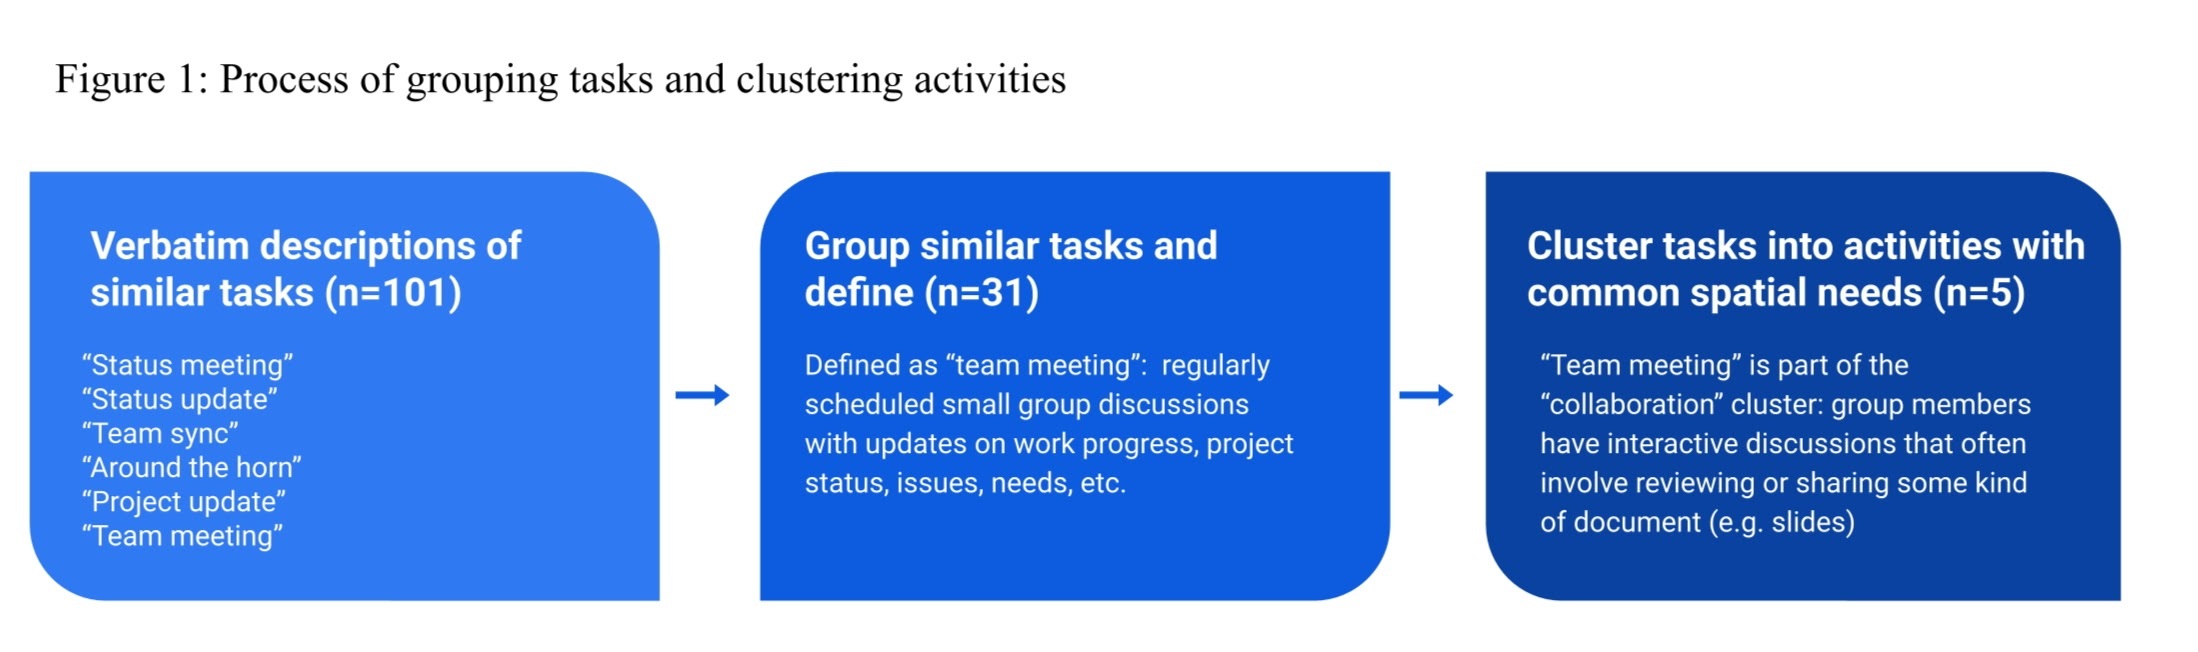
We completed 87 one-hour virtual interviews with employees in different roles across the global portfolio between July and September 2020 (see Table 1 in the appendix for participant details). A randomly-selected sample was pulled from a company-wide employee database and a screener was emailed inviting them to participate. Respondents were selected based on characteristics (e.g. location, tenure) and availability and offered the choice of credit for company merchandise or points to be redeemed with an on-site massage therapist as an incentive. We used a semi-structured interview protocol (Knott et al. 2022) with questions covering: role and tenure, experience working from home, a detailed timeline of their most recent working day (e.g. work tasks, collaborators, tools, task success, barriers), perceptions about future work, and connection with others. We conducted a clustering exercise to group specific work tasks described in interviews into a set of discrete activities that shared common spatial requirements and mapped those to how the office supported each activity.
Results
The interviews yielded 101 specifically named work tasks. We first grouped together similar tasks that used different names (e.g. “training” and “learning session”) to create a list of 31 discrete ways of working. We clustered these into five activities that shared similar needs for space, technology, and access to other people (e.g. coding and report writing are both individual focus work activities that are best supported by ergonomic spaces, sufficient screen space, and minimal distractions). These activity clusters formed the foundation for our survey development (see figure 1 for an example).
Apart from the need to create a concise set of work activities to measure in a survey, this foundational work revealed how we could use the survey to understand the value of the office. While many employees had adjusted to working from home, some reported tasks were more difficult (if not nearly impossible) to do at home compared to the office. Three key tasks emerged as easier in the office: day-to-day work with core teams assigned to the same office; being with others during key moments, such as project kick-offs or onboarding new employees; and highly interactive collaborative activities such as whiteboarding and brainstorming. This is consistent with research on remote collaboration (e.g. Barrero, Bloom, and Davis 2023; Yang et al. 2022), particularly with new teams that found it more difficult to be remote during the “forming” and “storming” stages of team development (Tuckman 1965). Digital tools help facilitate collaboration, but some employees struggled to actively participate and non-verbal cues were more difficult for facilitators to read to ensure everyone was engaged (Lim 2023), especially when participants were unfamiliar with each other and lacked the psychological safety that underpins successful collaboration (Edmondson 1999). These findings are similar to work found in other studies during this time (see Choudhury 2020 for a review).
Two types of activities were easier to do for many employees when everyone was remote. Heads-down independent focus work was easier for those who were able to create a good work environment at home. This was largely because employees were often able to create more uninterrupted time than in an office, where they might have distractions from people passing by or noise from nearby conversations. The second was working with already distributed teammates. Having everyone virtual made the experience feel more equitable as everyone was the same size on the screen and no one missed out on side conversations that happened in person.
While not necessarily a work task, employees also often struggled to build and maintain connections with their core teams. This was particularly difficult with people they worked with less frequently as those are more “weak ties” (Granovetter 1973). The office was a space to develop relationships within and outside of core work teams. These relationships were often helpful in building psychological safety and facilitating collaboration, but also enabled a sense of connection and belonging to the company as a whole. This was compounded by the fact that many employees were living in areas with COVID restrictions in place that limited in-person connection more broadly.
Study Two: Instrument Development through Cognitive Testing
Overview
We next wrote an initial survey about the work activities defined in study one and conducted cognitive interviews with a sample of employees to evaluate these items. Cognitive interviewing involves administering a draft of the survey while getting information from the respondents about their responses by collecting additional verbal information, which helped us understand whether the survey was collecting what we intended (Beatty and Willis 2007). Specifically, the interviews focused on how well respondents could do the following: comprehend the question being asked, retrieve from their memory information to answer the question, make a judgment about how to answer the question, and select their response from the options provided (Tourangeau 1984). Items were revised between rounds of the cognitive interviews to create an instrument for field testing.
Data and Methods
Although not intended to be a statistically representative sample, recruiting was heavily weighted towards participants from non-US offices to identify issues with question comprehension across locations and to include those with different levels of office access. Similar to the in-depth interviews, a random sample was pulled from a company-wide employee database and a screener was emailed inviting them to participate. Respondents were selected based on responses (e.g., location, return-to-office plans) and availability and were offered the choice of credit for company merchandise or points to be redeemed with an on-site massage therapist as an incentive (see Table 1 in the appendix for participant details). In March 2021, we conducted 17 one-hour virtual interviews using a concurrent and tailored interview approach (Daugherty et al. 2001). Participants completed the survey while sharing their screen so the interviewer could see the responses they chose. They answered each item on the screen and the interviewer asked tailored probes for each question. Some participants opted to use a more think-aloud approach, but probes were still used concurrently for each page of the survey. Respondents were also offered time at the end of the survey to provide retrospective feedback on the survey as a whole. We conducted three rounds of interviews to test updated items.
Results
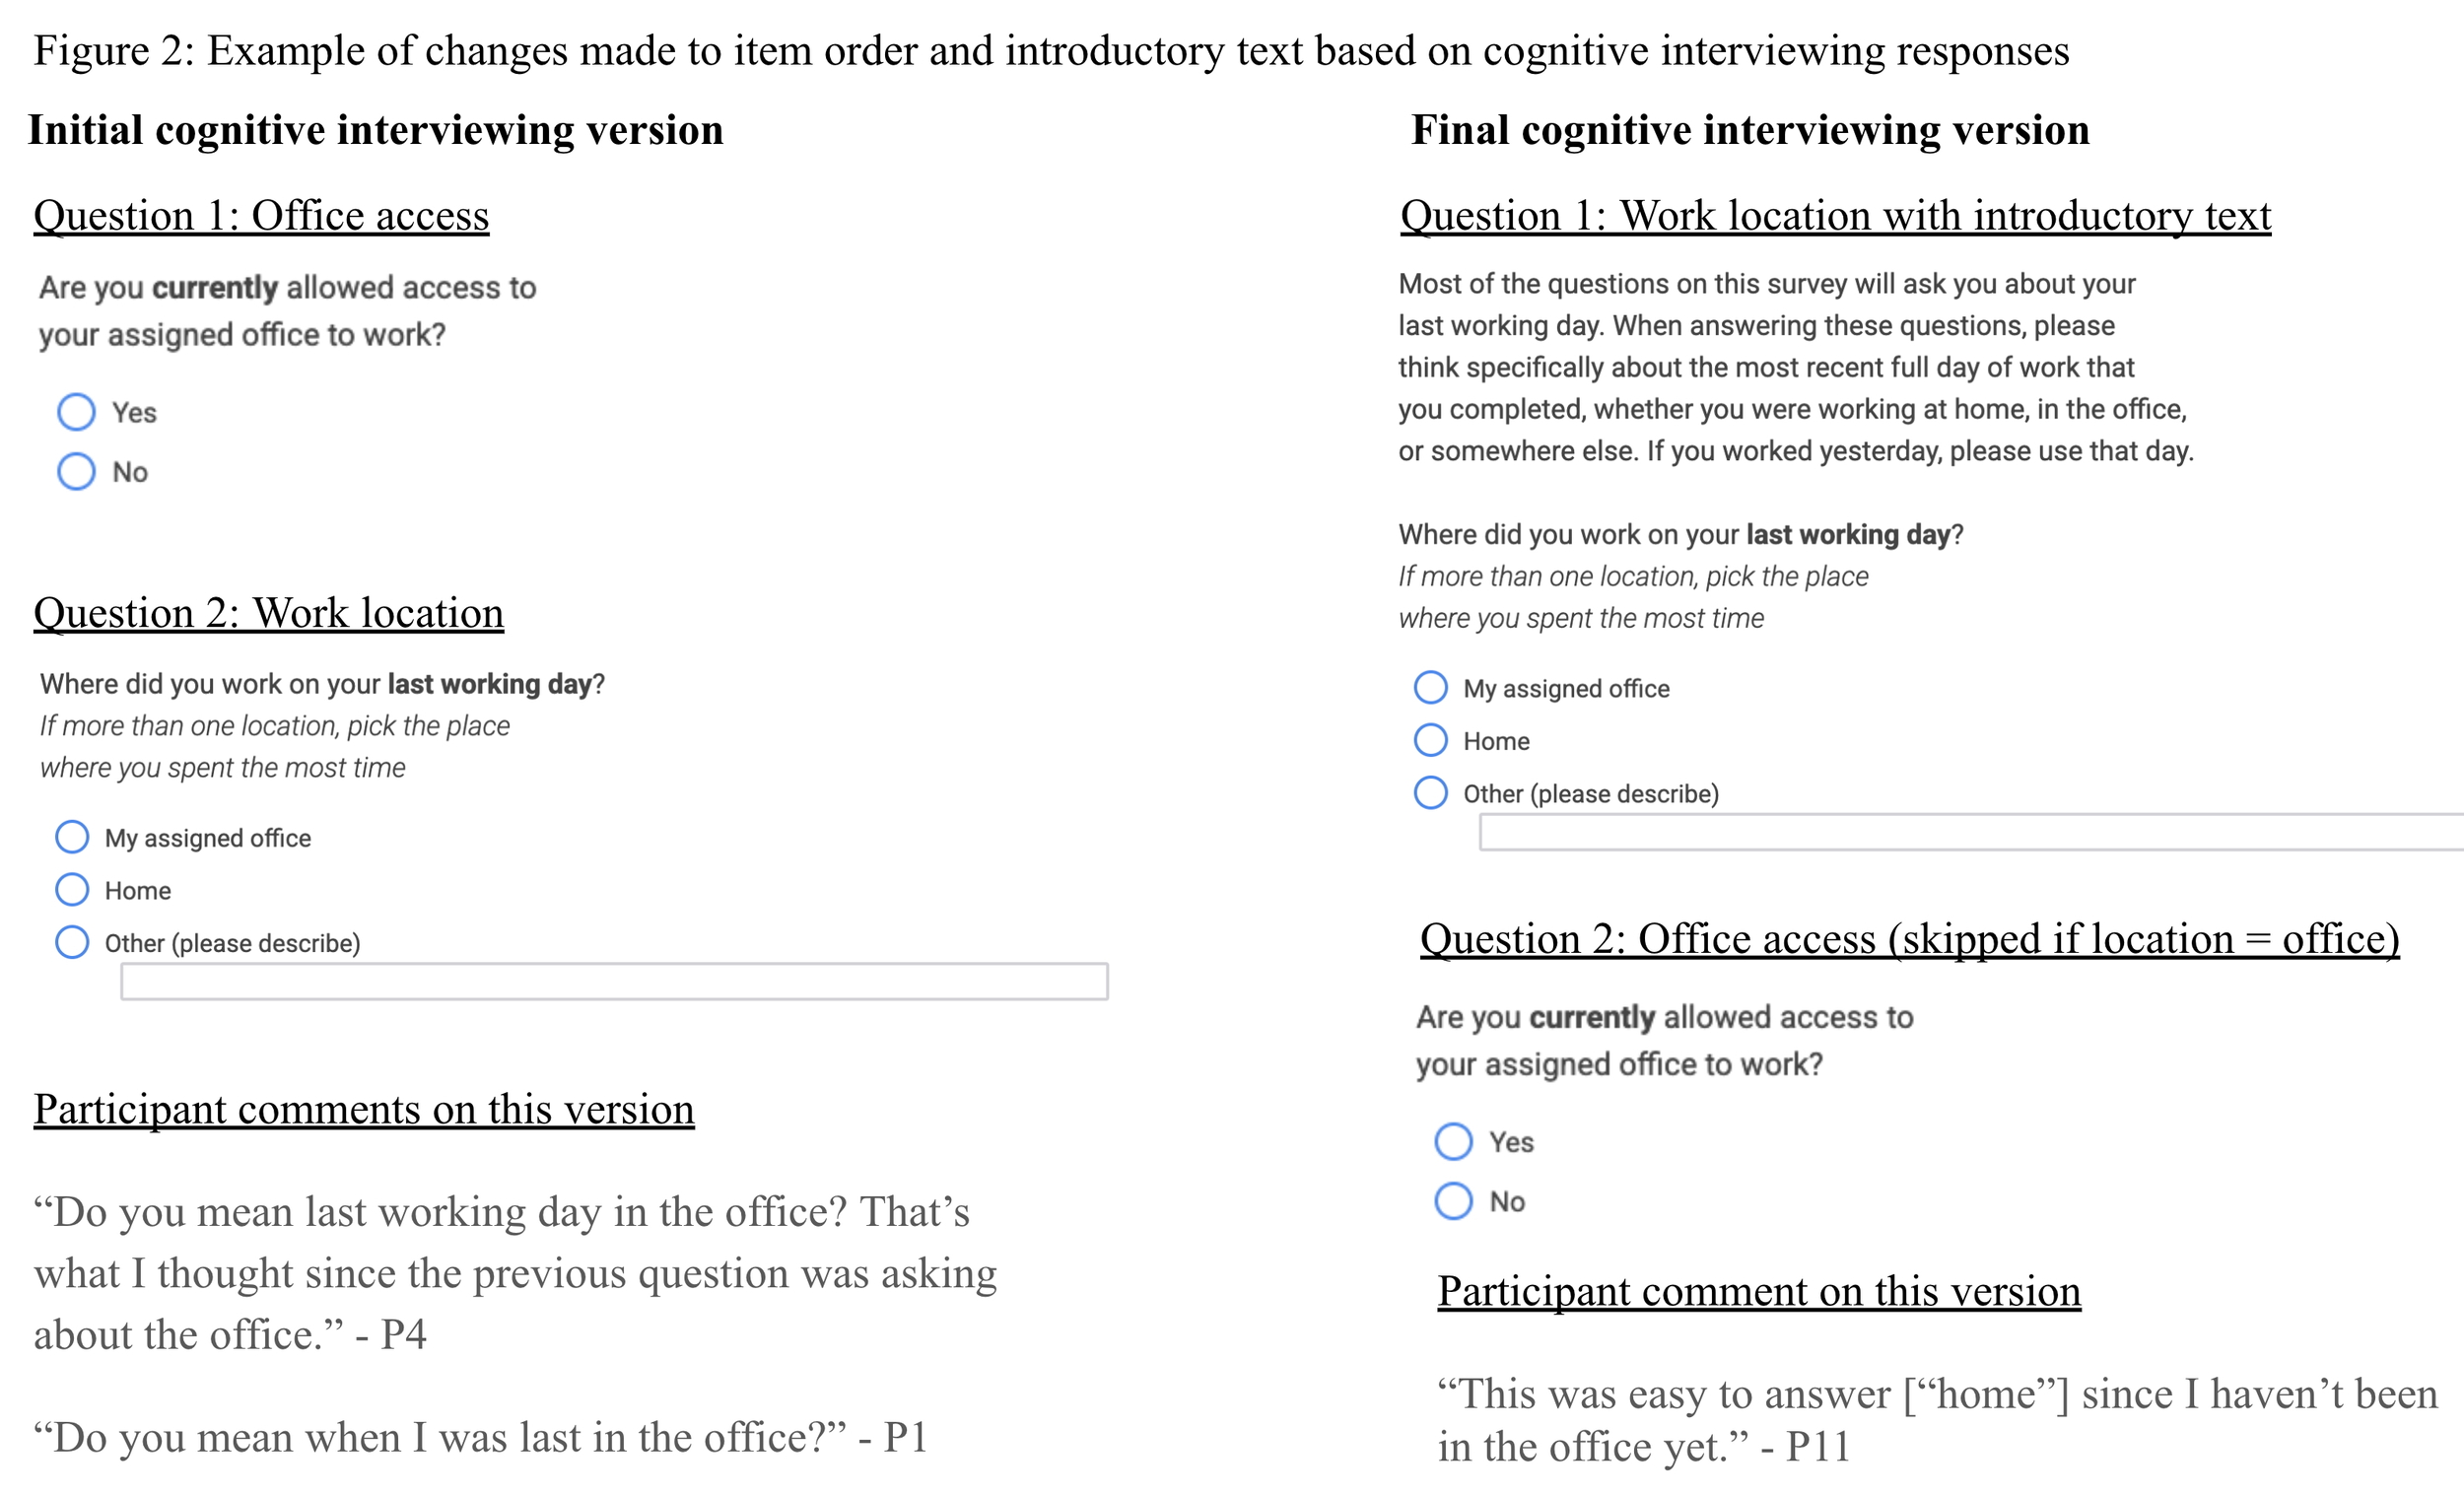
Overall, respondents were able to complete the survey and generally reported that responding was easy. We refined items between interviews to reduce the potential for survey error. We found several issues with questionnaire order impacting interpretation (Oldendick 2008). For example, the survey includes questions anchored to the most recent working day. Some participants assumed that we meant their last day in the office, which for many had been March 2020. We identified an ordering effect, whereby asking questions about return to office status prior to the items about the most recent working day primed respondents to be thinking about their office, but asking location first helped respondents think about their most recent day working anywhere and that assumption was confirmed with a response option for home. We also added introductory text to indicate that they could be working anywhere and that likely their most recent day would be the day prior and bolded the phrase in all question text (Figure 2).
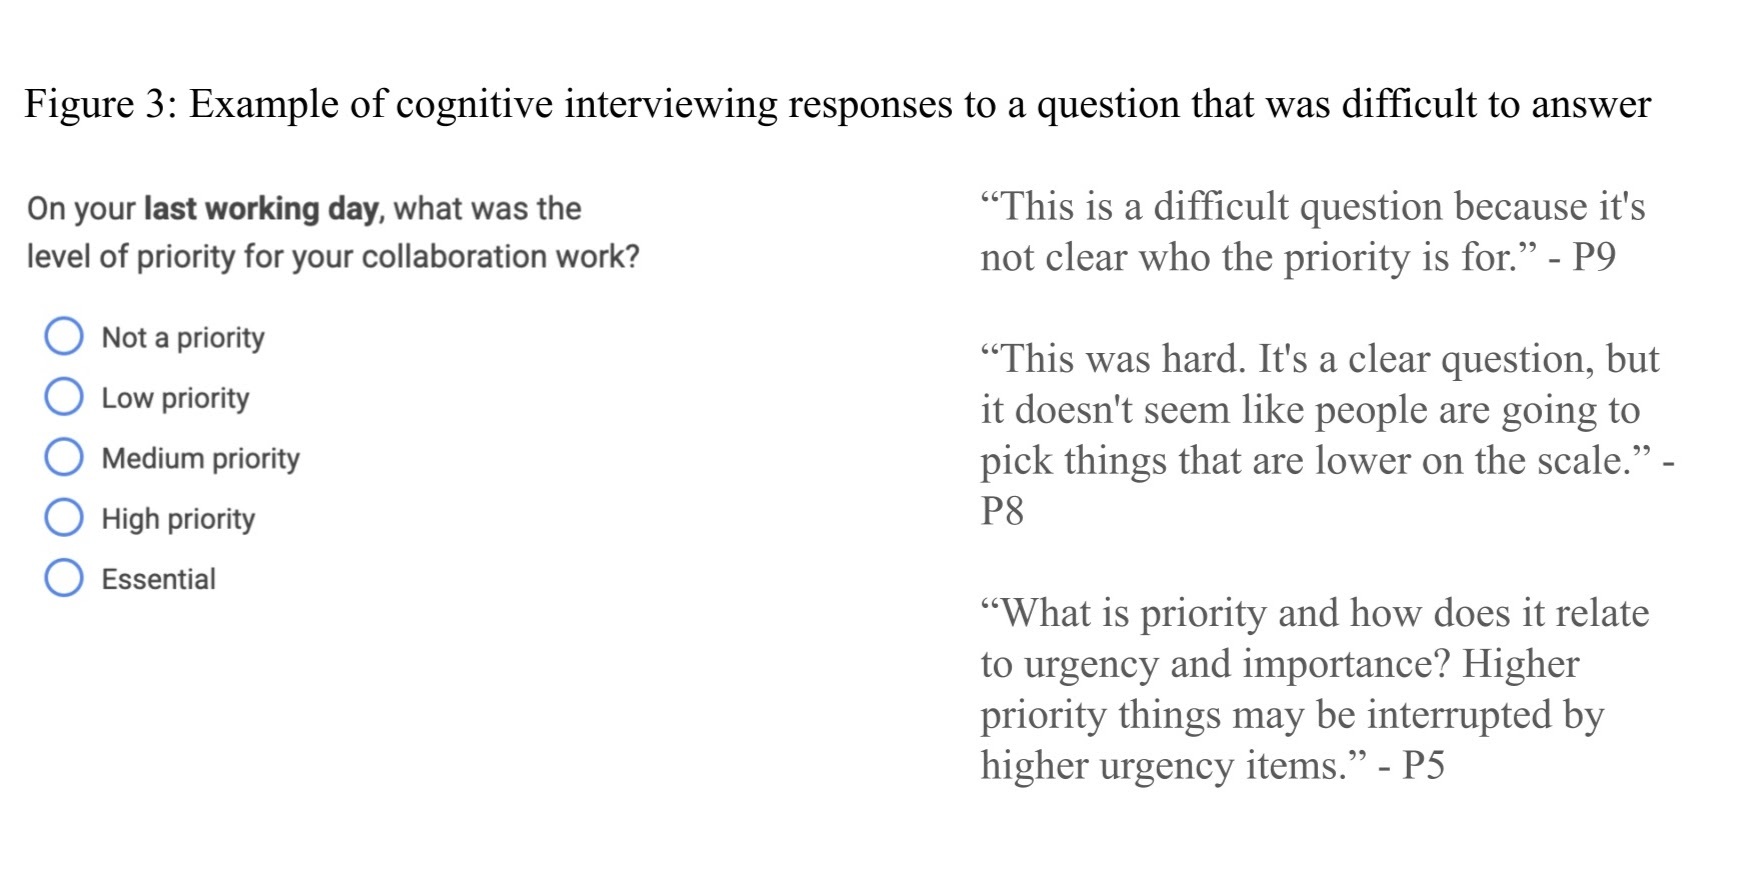
Some types of questions were more prone to comprehension and interpretation variation, which yields greater measurement error than questions that are more consistently understood (Schaeffer and Dykema 2011). Subjective assessments (i.e. HOW things went) were more difficult to understand and answer than questions about behaviors and activities (i.e. WHAT happened). For example, employees understood the work activities we asked about and could report whether they had engaged in each, but it was much harder to ask questions about how productive they had been doing these types of work. Participants described their understanding of how much progress they make on their work in different ways, both across subjects and within subjects across activity type. Progress on individual focus work was much easier to report, particularly when tied to a discrete task, but the success of collaborative activities like brainstorming and planning was much more difficult to assess. We decided not to ask these questions about activity progress and success and instead asked about whether specific barriers to each activity occurred. (See Figure 3 for another example of feedback on an item that didn’t perform well in cognitive interviews.)
We also found that the survey questions themselves (and even the existence of the survey itself) led to different interpretations and responses. Surveys are not just a means of collecting information from a target population for an organization, they are also communicating to respondents what the organization thinks is important to make decisions. For our employee survey, participants were concerned about how the results would be used to shape work policies. This could also be true for surveys of other types of populations, such as customers, eligible voters, students, etc., and respondents may attempt to sway results by responding in certain ways. Similar to the “hello-goodbye” effect where participants in health studies overstate their symptoms to attempt to qualify for treatment (Hathaway 1948; Choi and Pak 2005), respondents may try to “game” the survey results to get an intended outcome. Although we cannot fully ameliorate this issue, we used these cognitive interviews to shape the language in our survey invites and introductory text and to validate as best as possible the behavioral set of items as key outcomes.
Study Three: Field Pretesting
Overview
We conducted a field test of the full instrument with a small sample to assess time to complete, item performance, patterns of nonresponse, and the fielding procedures. Conducting a field test also offered the opportunity to embed experiments to test items or procedures with a larger sample that is representative of the population of interest (Willis 2016), so we included a response rate experiment to see the impact of a reminder email on the completion rate. We refined the survey by cutting items that performed poorly (e.g., no variation, took too long to complete, low reliability, high missingness, breakoff point) and set the final survey sampling and fielding procedures.
Data and Methods
Similar to cognitive interviews, the sampling strategy for the field test was focused on locations where offices were open for employees to choose to come in or to work from home to compare results in both types of locations. We received 143 responses from a randomly selected employee database sample of 300 employees (48% response rate) in sites across the global portfolio (see Table 1 in the appendix for participant details). Initial emails were sent on a randomly selected weekday during the morning local time. Reminders were sent to non-respondents in the experimental group the afternoon following the invite. No incentives were offered. The survey remained open for a week after invites were sent. We reviewed survey responses directly as well as paradata (e.g., time to complete, answer switching, breakoff points) generated from the survey platform.
Results
The field test informed several full-scale survey changes. The responses and paradata signaled when an item might not be performing well. For example, the priority of work task questions that performed poorly in the cognitive interviews (see Figure 3) were dropped because there was little variation and few of the scale points were used. We also looked at partial responses to see if specific items triggered breakoffs more than others. Most of the sample who opened the survey (92%) completed it and more than half of the breakoffs were early in the survey with no item or section acting as a specific breakoff trigger. This led to future full-scale experiments around progress bars (Villar, Callegaro, and Yang 2013) and encouragement messages to reduce breakoffs (Sakshaug and Crawford 2010).
We also tested contacting and data collection processes. We randomized half the sample into a control group that only received the initial survey invitation and an experimental group that received a reminder email if they had not completed the survey within approximately 36 hours. The reminder email significantly increased response rates by 11 percentage points (53% versus 42%) and was adopted for the full scale. We also conducted a nonresponse bias analysis to understand differential response rates by subgroups and noted areas where we might need to consider differential sampling rates and/or survey weights for the full scale.
Discussion and Conclusion
This paper provides an example of the steps needed to develop a new survey program. We used a multi-method set of research studies to identify key outcomes and create a scalable method to measure those outcomes as the role of the office in supporting work was evolving. By starting with deep foundational research with employees into how their work is done, we created a set of discrete activities that need to be supported wherever employees are working. We used cognitive interviews to build survey questions that could be fielded company-wide and conducted a small field test to check how well those items performed at scale and what fielding procedures would improve data quality. This instrument has been used through the return to office process and has allowed us to understand the unique value of the office in a hybrid work environment.
Even the best developed survey program must be monitored and maintained. We continue to regularly evaluate the questionnaire and fielding processes to ensure the survey continues to provide insights that are useful for our stakeholders, including embedded experiments (such as item order variation, wording in the survey invites, and reminder timing) to make decisions about what we ask and how we ask it. We complement this with qualitative research that reveals new types of constructs we want to develop into survey questions. As the future of work continues to be reimagined, so too must we evolve our methods of evaluating its success.
Acknowledgement
The author would like to thank Nick Lamel and Lindsay Graham for their ongoing support in conducting this work as well as all the members of the REWS UX team for their assistance with data collection and analyses throughout the survey redesign process.
Lead author contact information
Name: Sarah Crissey
Email: scrissey@google.com
Address: 1600 Amphitheatre Parkway
Mountain View, CA 94043