
Introduction
A person’s personality traits and psychological state influence their likelihood of participating in a survey when invited to do so. For example, the application of Social Exchange Theory as a driver of survey participation aims to change the potential respondent’s psychological state, activating a sense of communalism, shared inclusion, and trust (Dillman, Smyth, and Christian 2014). Groves, Cialdini, and Couper (1992) explore the idea that compliance with survey requests is generally influenced by certain factors, such as reciprocation, consistency, social validation, authority, scarcity, and liking, and they suggest that individuals’ psychological predispositions toward these qualities may logically affect their willingness to participate. Groves and Cooper’s (1998) framework for survey cooperation outlines four main factors influencing participation, the fourth of which (household or householder characteristics) is primarily based on the psychological dispositions of potential respondents.
The case for psychological and personality-based underpinnings of survey response, however, remains poorly conceptualized and even less well established empirically. Indeed, when reviewing the vast literature on survey nonresponse, one gets the sense that explorations of “why” people don’t respond are less developed than the “what” and the “how,” as in, what nonresponse does to survey estimates, how to minimize it operationally, or how to adjust for it through statistical modeling and weighting (Berkinsky 2007; Groves et al. 2011). Given the decline in survey response rates over the past quarter-century, and examples in election forecasting and other areas where demographic weighting and careful design have failed to eliminate bias, it is increasingly important for survey researchers to examine the relationship between personality and survey response more comprehensively. If indeed psychology is a significant contributor to systematic nonresponse, survey researchers must start understanding what attributes generate nonresponse, and then what can be done to mitigate it, be it through tailored designs that work against deleterious psychological tendencies or to engage in efforts that will “bring in” persons who initially, due to their psychological profile, do not respond.
The lion’s share of prior research on psychological and personality-based attributes in relation to survey nonresponse has focused almost exclusively on the Big Five model of personality (Brüggen and Dholakia 2010; Cheng, Zamarro, and Orriens 2020; Digman 1990; Dollinger and Leong 1993; Lugtig 2014; McCrae and Costa 2004, 2004; Richter, Körtner, and Saßenroth 2014; Saßenroth 2013; Satherley et al. 2015). Beyond the Big Five, only a handful of studies have examined other psychological or personality-based measures in the context of survey nonresponse, addressing attributes such as locus of control (Bosnjak, Tuten, and Werner 2005), communalism (Groves, Singer, and Corning 2000), utilitarian individualism (Loosveldt and Carton 2002), and narcissism (Marcus and Schütz 2005). In this paper, we explore the relationship between a broader set of psychological dispositions and personality types and their influence on response propensity, aiming to unpack both the direct and indirect causes of survey nonresponse. We include 20 metrics in total, not only the Big Five plus one (openness, conscientiousness, extraversion, agreeableness, neuroticism, and honesty-humility), but also authoritarianism, political uncontrol, narcissism, trust, social capital, communalism, acceptance, patriotism, fear, utilitarian individualism, compassion, privacy, locus of control, and belief in morality. These psychological metrics were selected based on a review of academic literature as well as popular literature on survey nonresponse, with each metric theoretically linked to potential underlying causes of nonresponse.
Nearly all prior studies on the relationship between personality or psychological traits and nonresponse have been limited in the range and variability of their outcome measures, often focusing on attrition in two- or three-wave panels or drop-offs in longitudinal surveys. In this study, we extend that research by using a more robust outcome measure with greater variance, drawn not from a short-term panel design but from nonresponse observed across hundreds of surveys conducted within a multi-purpose, probability-based, mostly online panel.
We express our goals in two simple research questions:
RQ1: What relationships exist between psychological and personality-based attributes and survey nonresponse?
Given the extensive literature and common practice of using survey weighting to reduce nonresponse bias, we find it important to ask whether these relationships persist even after controlling for variables typically used in weighting (e.g., age, sex, education, and so on):
RQ2: Can traditional weighting variables control the effects of psychological and personality-based attributes on survey nonresponse?
Data and Method
The data for this study come from the AmeriSpeak Panel, operated by NORC at the University of Chicago (Dutwin 2023). The panel is designed to provide a representative sample of the general U.S. household population. It employs a probability-based sampling methodology, randomly selecting U.S. households with a known, non-zero probability of selection from NORC’s National Sample Frame, which covers over 97% of U.S. households. During initial recruitment, sampled addresses are contacted through a sequence of mailings and phone calls, inviting them to join the panel either online or via telephone (inbound or outbound). A second stage of recruitment, nonresponse follow-up (NRFU), targets a stratified random subsample of nonrespondents from the initial recruitment. For NRFU, NORC selects approximately one in five initially nonresponding housing units and sends a new recruitment invitation via FedEx, followed by in-person household visits to personalize outreach and encourage panel enrollment.
For this psychological and personality-based survey, we invited a sample of 9,975 panelists via emails, text messages, and phone calls between April 26, 2022, and May 25, 2022. A total of 5,818 panelists completed the survey at a completion rate of 58%. Given a panel recruitment rate of 20% and a panel retention rate of 77%, the cumulative response rate is 9%.
For each of these 5,818 panelists, we calculated a mean participation rate based on the surveys they were invited to during the six months immediately preceding the psychological and personality-based survey. This metric reflects their cooperation rate during the period when trends in panel nonresponse are most acute, that is, their “present-day” cooperation rate. Our metric offers a great deal more precision and range than a variable that simply measures whether a person who participated in an initial survey continued on to the second wave. Instead, we measure participation rates across dozens to hundreds of surveys to which the panelists were invited during their panel tenure.
Each of the 20 personality and psychological traits was measured using full or abbreviated scales drawn from prior literature (see the online supplementary appendix for sources and reliability metrics). Cronbach’s alpha was calculated for all scales and fell within acceptable ranges, with an average of .72. Two scales (narcissism and acceptance) had alpha values below .6. While these scales have been used frequently in previous research, we report their results, but advise readers to use caution in interpreting them.
For our main analysis, we report a series of least-squares linear regression models, one for each of the 20 psychological or personality-based scales, using mean participation rate as the outcome variable. Each regression includes two models. The first is a simple bivariate association between the psychological scale and the outcome. The second model builds on the first by adding demographic controls commonly used in weighting, including age, sex, race and ethnicity, education, and Census region. In addition, we standardized all scales using z-score transformations and re-ran the models both with and without control variables. In total, 80 regression models were estimated, with full results provided in the online supplementary appendix.
Results
Summary results of the regression analyses are presented in Figure 1. The blue bars represent the standardized regression coefficients from Model 1, which does not include common weighting variables. The orange bars represent coefficients from Model 2, with common weight variables as the control variables. Dark-colored bars indicate statistical significance at the .05 level, while light-colored bars denote nonsignificant coefficients.
Of the 20 psychological and personality-based scales, 14 were statistically significant predictors of mean participation rate in Model 1, which included only the individual scale. When typical weighting variables were added in Model 2, the number of significant predictors dropped to eight.
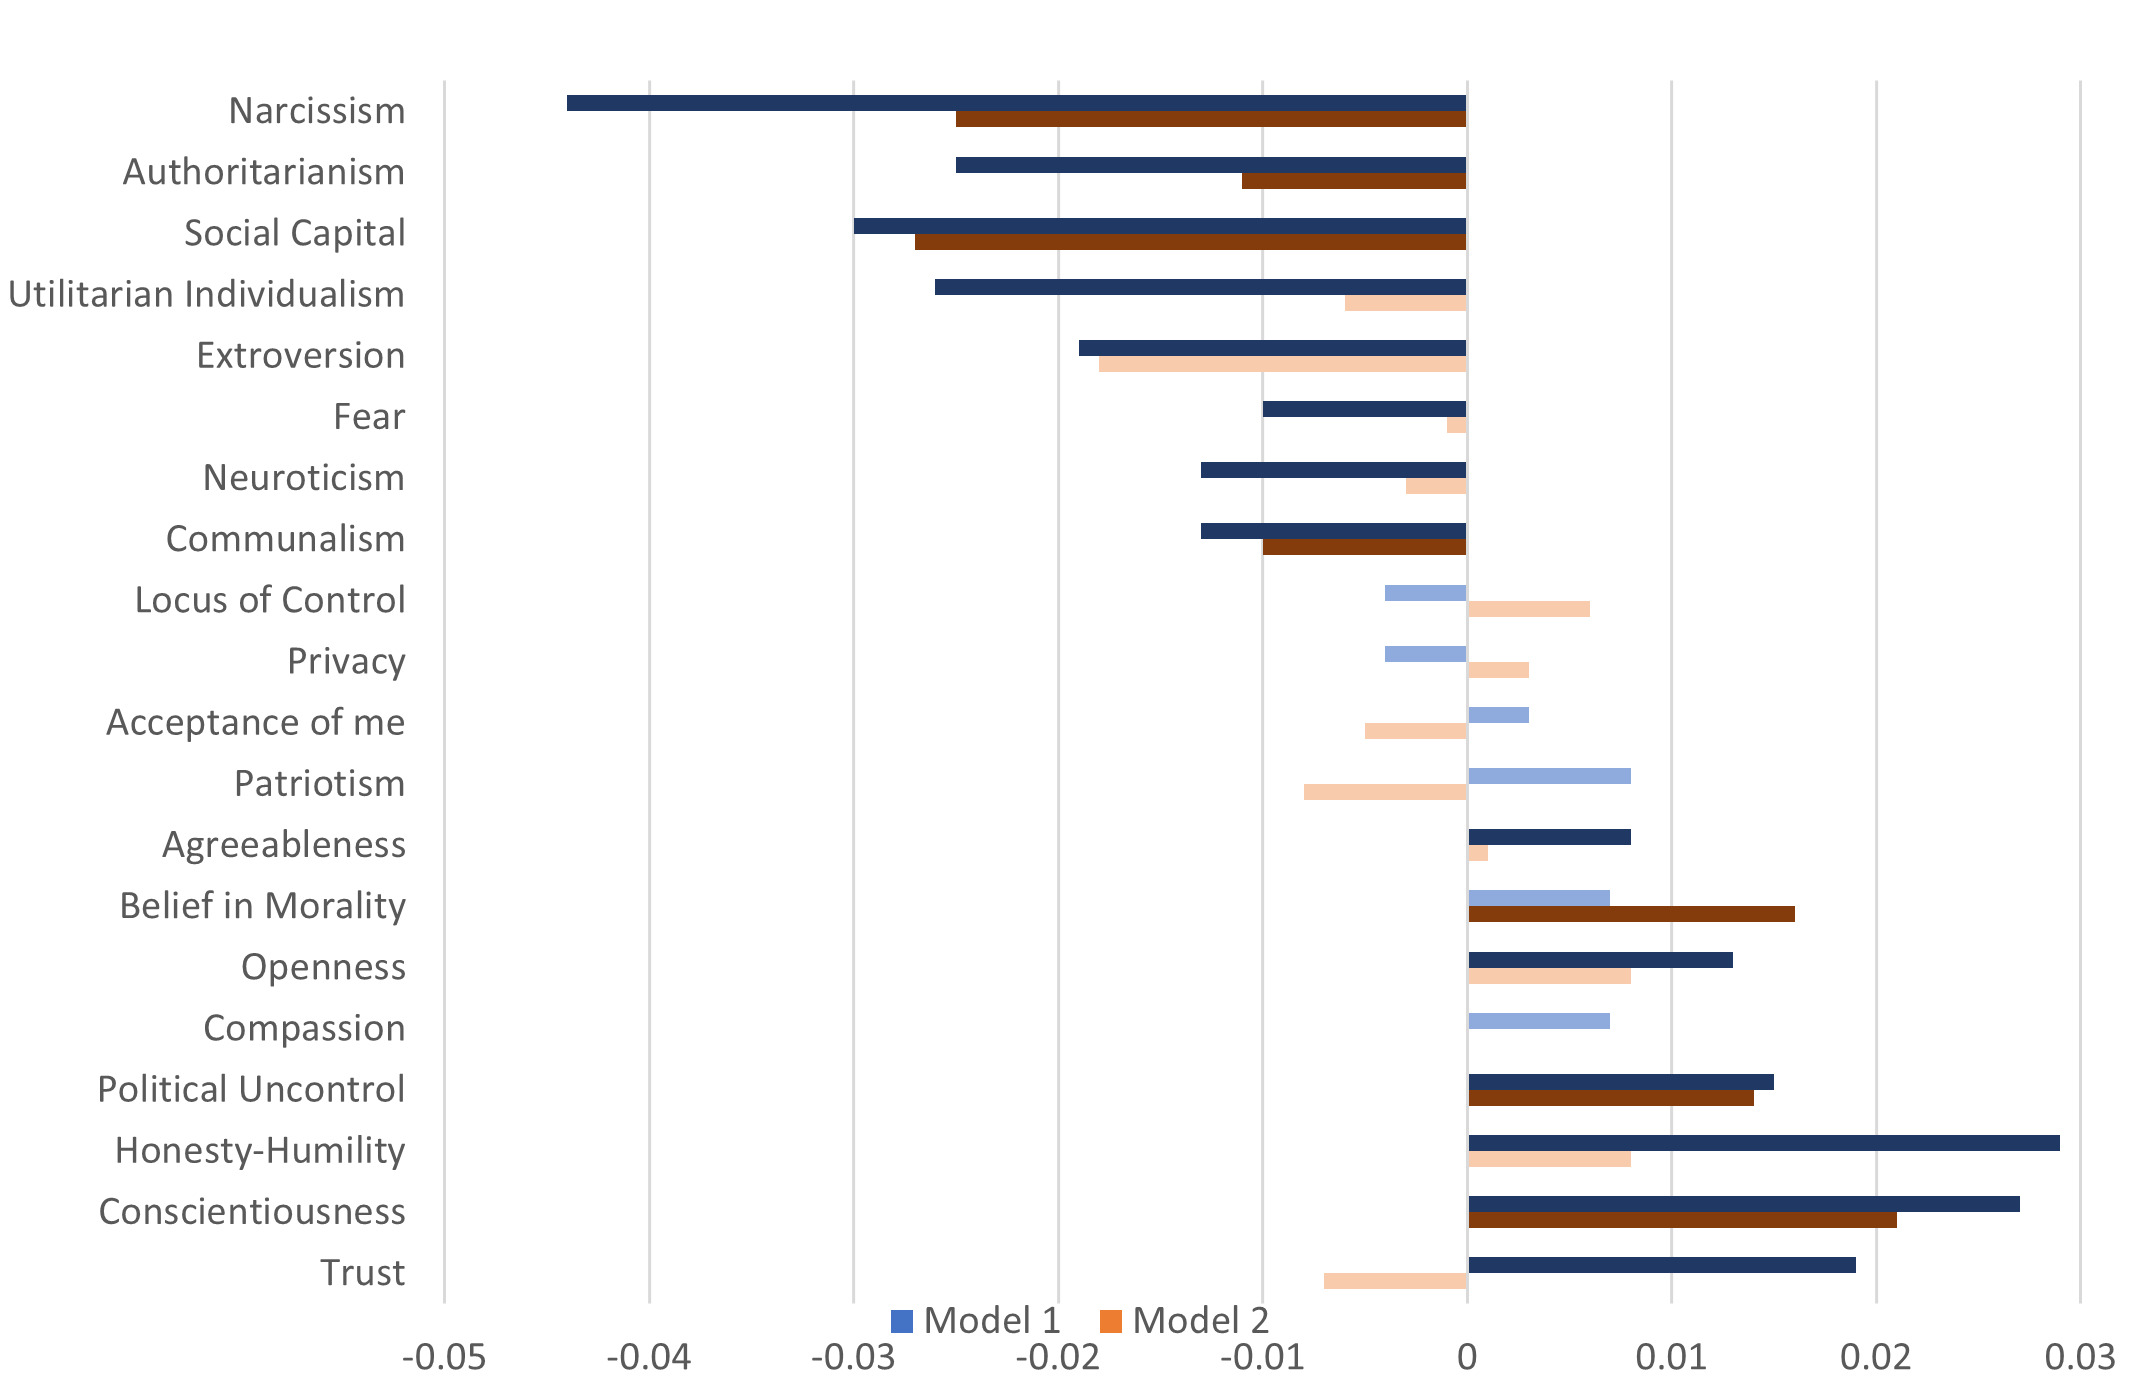
Generally, we find that several notable variables are negatively associated with mean participation rate, listed below in order of the strength of the relationship:
-
Narcissism: For every one-point increase on the narcissism scale (an 8-point scale), mean participation rate decreases by 26%. Even after accounting for weighting variables, participation drops by an average of 15% for each unit increase in narcissism.
-
Authoritarianism: Authoritarianism negatively impacts mean participation rate by seven percent. As a negatively valanced metric, persons sympathetic to authoritarianism are less likely to participate in surveys.
-
Social Capital: Every unit increase in social capital (four-point scale) leads to an average 4% decline in participation rate. Including weighting variables does not change this pattern.
-
Extroversion: Persons who report being extroverted are more likely to be nonrespondents. A one-point increase in the six-point extroversion scale leads to about a one percent decline in participation.
-
Communalism: People scoring higher on communalism are less likely to participate in surveys.
Two notable variables are positively related to mean participation rate, shown below in the order of the strength of the relationship:
-
Conscientiousness: Conscientious individuals participate in surveys at a rate about 2% higher, on average, for each unit increase on this 4-point scale.
-
Political Uncontrol: Persons who feel a lack of political control are more likely to be respondents. A one-point increase on the 4-point political uncontrol scale is associated with about a 1% increase in participation.
Other variables are less consistent. Utilitarian individualism, fear, and neuroticism have a significant negative impact on mean participation rates in Model 1 but no impact in Model 2. Similarly, agreeableness, openness, honesty-humility, and trust have a significant positive impact on mean participation rate in Model 1 but no impact in Model 2. In addition, we find that persons with a strong belief in morality are also more likely to be responders in Model 2, but not in Model 1.
Discussion
Our data may tell a story whereby people at both ends of "the ‘sociality’ spectrum are more likely to be nonrespondents. On one hand, individuals high in social capital, communalism, and extraversion tend to have lower participation rates. On the other hand, the strongest predictors of nonresponse are narcissism and authoritarianism. What might drive people to participate? While those who feel a personal lack of control were no more likely to be participators or nonrespondents, individuals who feel a lack of political control appear more motivated to make their voices heard. As well, those who score high in conscientiousness are also more likely to be active participants.
Given the central role of weighting in mitigating errors such as nonresponse bias, it is important to highlight that several variables initially shown to significantly predict nonresponse lose their significance once typical weighting variables are included. For example, lack of trust was associated with a two percent decrease in participation for each unit drop on its six-point scale, but this relationship became statistically nonsignificant after controlling for common weighting variables. A similar pattern was observed for honesty-humility, openness, agreeableness, utilitarian individualism, fear, and neuroticism. Overall, weighting appears to account for some (but not all) of the psychological variables that initially show significant associations with nonresponse in bivariate regression models.
One potential application of these findings is to better understand the prevalent psychological profiles of nonrespondents in order to craft messaging that resonates with certain psychological predispositions and more effectively persuades them to respond to surveys. The art of survey persuasion remains generally poorly understood, but understanding the psychology of the reluctant respondents or nonrespondents could be a crucial first step toward creating more persuasive communication strategies to mitigate survey nonresponse.
One limitation of this study is that participation rates were calculated based on surveys administered prior to the psychological and personality-based survey. As a result, panelists who dropped out before completing the psychological and personality measures were not included, potentially introducing bias into the regression results. Future research should consider an alternative design that first collects psychological and personality data, then tracks respondents’ participation in subsequent waves of data collection.
Surveys have always relied on voluntary participation. Aside from small incentives, we as survey practitioners have long relied on the goodwill and openness of the public to share their thoughts. It may seem almost too obvious to say that those who are less open and possess less goodwill are unlikely to participate in surveys. Yet, despite over 50 years of intensive research on survey nonresponse, such factors have been largely overlooked. Our study underscores that psychological predispositions are a significant driver of nonresponse, and future research should further explore how these predispositions can be leveraged to mitigate nonresponse in survey research.
Corresponding Author’s contact information
David Dutwin
55 East Monroe St, 30th Floor, Chicago, IL 60603, (312) 759-4000
Dutwin-David@norc.org