
Background
To conduct valid, generalizable survey research, investigators must collect data from all population segments. However, some groups (e.g., Black and Hispanic Americans) have historically been less likely to respond to surveys (Jang and Vorderstrasse 2019; Sheldon et al. 2007; Moorman et al. 1999). Among Veterans, women respond at lower rates (Harrington et al. 2019).
In a study on suicidal ideation and attempts among Veterans (ASCEND; Hoffmire et al. 2022), Black/African American, Hispanic, Asian/Native Hawaiian/Pacific Islander (AANHPI), female, and younger (18-34 years) Veterans responded at lower rates than non-Hispanic White, male, and older (≥35 years) Veterans (Herring-Nathan et al. 2021). Veterans separated within the past 3 years also responded at lower rates than those separated more than 3 years ago (Herring-Nathan et al. 2021). The decreased responding among younger Veterans and Veterans of color mirror response patterns observed in general population studies (Jang and Vorderstrasse 2019; Morgan 2020).
Understanding how to increase survey response among harder-to-reach respondents is critical. Ensuring representative Veteran samples improves generalizability (Groves 2006), which is essential for research designed to improve Veteran health and well-being. While nonprobability sampling can increase the number of participants from hard-to-reach populations (Shaghaghi, Bhopal, and Sheikh 2011), further efforts are needed to increase these groups’ response rates. One study with female Veterans found that personalized information about the research team can increase response rates (Gaeddert et al. 2020). Additionally, including culturally reflective imagery and language in survey invitations and materials has been found to increase participation among racial/ethnic and linguistic minority groups (Yancey, Ortega, and Kumanyika 2006; Laganà et al. 2013; Sullivan et al. 2011; Banducci, Donovan, and Karp 2004). It is unknown if this strategy is effective when tailored for other demographics (e.g., by sex or age) or among Veterans.
As it is critical to understand how to increase survey response from Veteran groups that have experienced divergent patterns in their suicide rates and trends over time (U.S. Department of Veterans Affairs, n.d.), we examined if including tailored inserts was effective in a suicide prevention study. We hypothesized that including images in recruitment materials that reflected aspects of one’s identity would increase survey response within these groups (i.e., Black, Hispanic, AANHPI, female, and recently separated).
Data and Methods
Participants and Procedures
This experiment was embedded into ASCEND Wave 1 data collection, fielded over 16 weeks between 2/2022-6/2022 (Hoffmire et al. 2024). Standard strategies for optimizing response were employed, including mixed contact and response modes, pre- and post-incentives, and reminders (Dillman, Smyth, and Christian 2014). A sequential multi-mode, push-to-web design was used (Appendices A and C). 97,287 Veterans residing in the United States (all 50 states, the District of Columbia and Puerto Rico) were invited to participate; 17,383 completed the survey (yield=17.9%; AAPOR RR3 =19.1%).
Insert experiment
We conducted an experiment of tailored inserts included in the initial postal mail invitation and Week 6 paper survey mailings to examine if their inclusion improved response rates among specific demographic subgroups. Veterans were randomly assigned to control or tailored insert conditions. The only difference between the two conditions was the insert included; there were no outward differences in the envelopes/mailings.
Control conditions. To provide a relevant comparison group, those in the control condition received no insert or a generic insert in which images were not limited to any specific demographic group (Appendix B). This allowed testing the effectiveness of including the tailored insert (experimental condition), relative to no insert or a generic insert.
Tailored condition. In this condition, the postcard front featured three images of Veterans with likeness to one’s demographic group (Appendix B). Inserts tailored by race or ethnicity (Black/African American, AANHPI, and Hispanic Veterans) were included in Replicates 1 and 3; inserts tailored to female and recently separated Veterans were included in Replicates 2 and 4.
To reduce potentially confounding effects, images across insert conditions were selected to display similar general characteristics; each included images of a family, plus a range of ages, races/ethnicities, and sexes, when these characteristics were not aligned with the demographic group of interest. Images of individuals in uniform were avoided, to align with the Veteran focus. Members of a project Veterans Engagement Board (Wendleton et al. 2023) provided input on images and informed expectations of insert performance and feedback for future experiments. Images were purchased from stock image sites. The backs of all inserts included an illustration of how to access the web survey (Appendix B). Inserts were printed on 8x5.5 inch, full-color, two-sided postcards.
Some demographic groups were not mutually exclusive (e.g., females were also part of all other groups; recently separated Veterans are of all races and ethnicities); thus, decisions about which group to place a Veteran into were necessary. In Replicates 1 and 3, where the insert experiment focused on race and ethnicity, Hispanic ethnicity was prioritized. Hispanic Veterans who also indicated another race/ethnicity were coded as Hispanic, meaning all other groups were comprised exclusively of non-Hispanic respondents. Veterans with more than one race or whose race was listed as “Other” in the sampling frame were placed in the “All Other Races” group and not sent a tailored insert. For each experiment, Veterans in an “All others” category included Veterans not in the demographic group of interest for the given replicate and received a generic insert.
In Replicate 2, where the insert experiment focused on sex and recency of separation, female sex was prioritized (i.e., recently separated female Veterans were considered female in Replicate 2). Conversely, in Replicate 4, recently separated status was prioritized (i.e., recently separated female Veterans were considered recently separated in Replicate 4). This design promoted balance and representativeness. Among the demographics of interest, the design allocated 50% to the tailored condition, 25% to the generic insert control, and 25% to the no-insert control. The number of Veterans sampled in each group and condition is provided in Tables 1 and 2. The non-experimental group primarily included non-Hispanic White Veterans, but also Veterans who indicated more than one race/ethnicity or American Indian Alaska Native in Replicates 1 and 3, and older male Veterans in Replicates 2 and 4.
Statistical Analysis
To evaluate the impact of inserts on response, we calculated yield (percentage of sampled cases who returned a completed survey) for each demographic group, overall and by condition (tailored insert, generic insert, no insert). As this experiment was embedded in the larger ASCEND study and design was thus largely driven by practical considerations and operations related to printing and mailing materials, we conducted a post-hoc power analysis to evaluate the minimum effect size (i.e., difference in yield) we could detect with 80% power, nominal Type 1 error of 0.05, and 15% yield. For AANHPI and recently separated Veterans, we had 80% power to detect a difference of at least 8% across experimental conditions. For all other demographic groups, we had 80% power to detect a difference of at least 4% across conditions.
Next, logistic regression models examined the relationship between experimental group and the likelihood of survey completion. Age was included as a potential confounder, as preliminary analyses revealed a significant association between age and survey response across demographic groups (p<.001 for female, Black/African American, Hispanic, recently separated, and AANHPI), with older Veterans more likely to participate. An a priori decision was also made to evaluate whether age was an effect modifier of the relationship between experimental group and survey completion given prior research suggesting that response relationships often differ by age (Kolaja et al. 2023; Wu, Zhao, and Fils-Aime 2022). Thus, for each demographic group, three sequential logistic regression models were fit: (1) experimental condition as the only independent variable to assess for overall unadjusted associations with responding; (2) experimental condition and age as independent variables to investigate whether the effect of the experimental manipulation was independent of age; and (3) experimental condition, age, and their interaction to evaluate whether the relationship between the experimental condition and responding differed by age. The independent experiment variable for all models was categorical (no insert [reference], generic insert, tailored insert). The dependent variable was binary survey completion status (yes/no); age (in years) was included as a continuous variable.
Results
97,287 Veterans were invited to participate in the ASCEND Wave 1 survey; 26,843 were randomly assigned to an experimental condition. Overall, 17.9% (N=17,383) of invited Veterans completed the survey, compared to 13.6% (N=3,642) of those included in the experiment. Figure 1 illustrates overall yield (from 11.6% to 14.9%) for those in the experimental condition, by demographic group. Each group had lower overall response (statistically significant difference in yield at p<0.001), compared to the non-experimental group (N=70,444; yield=19.5%).

Within the experimental sample, we compared the yield of insert types across all demographic groups (Table 3). Yield was highest for the no-insert condition (14.2%; 95%CI=13.4-15.1), followed by the tailored insert condition (13.5%; 95%CI=12.9-14.1), and lowest for the generic insert condition (13.0%; 95%CI=12.2-13.9). The no-insert control group had a significantly higher yield than the generic insert condition (p<.05). However, yields were not significantly different between the no-insert and tailored insert conditions, nor between tailored and generic insert conditions.
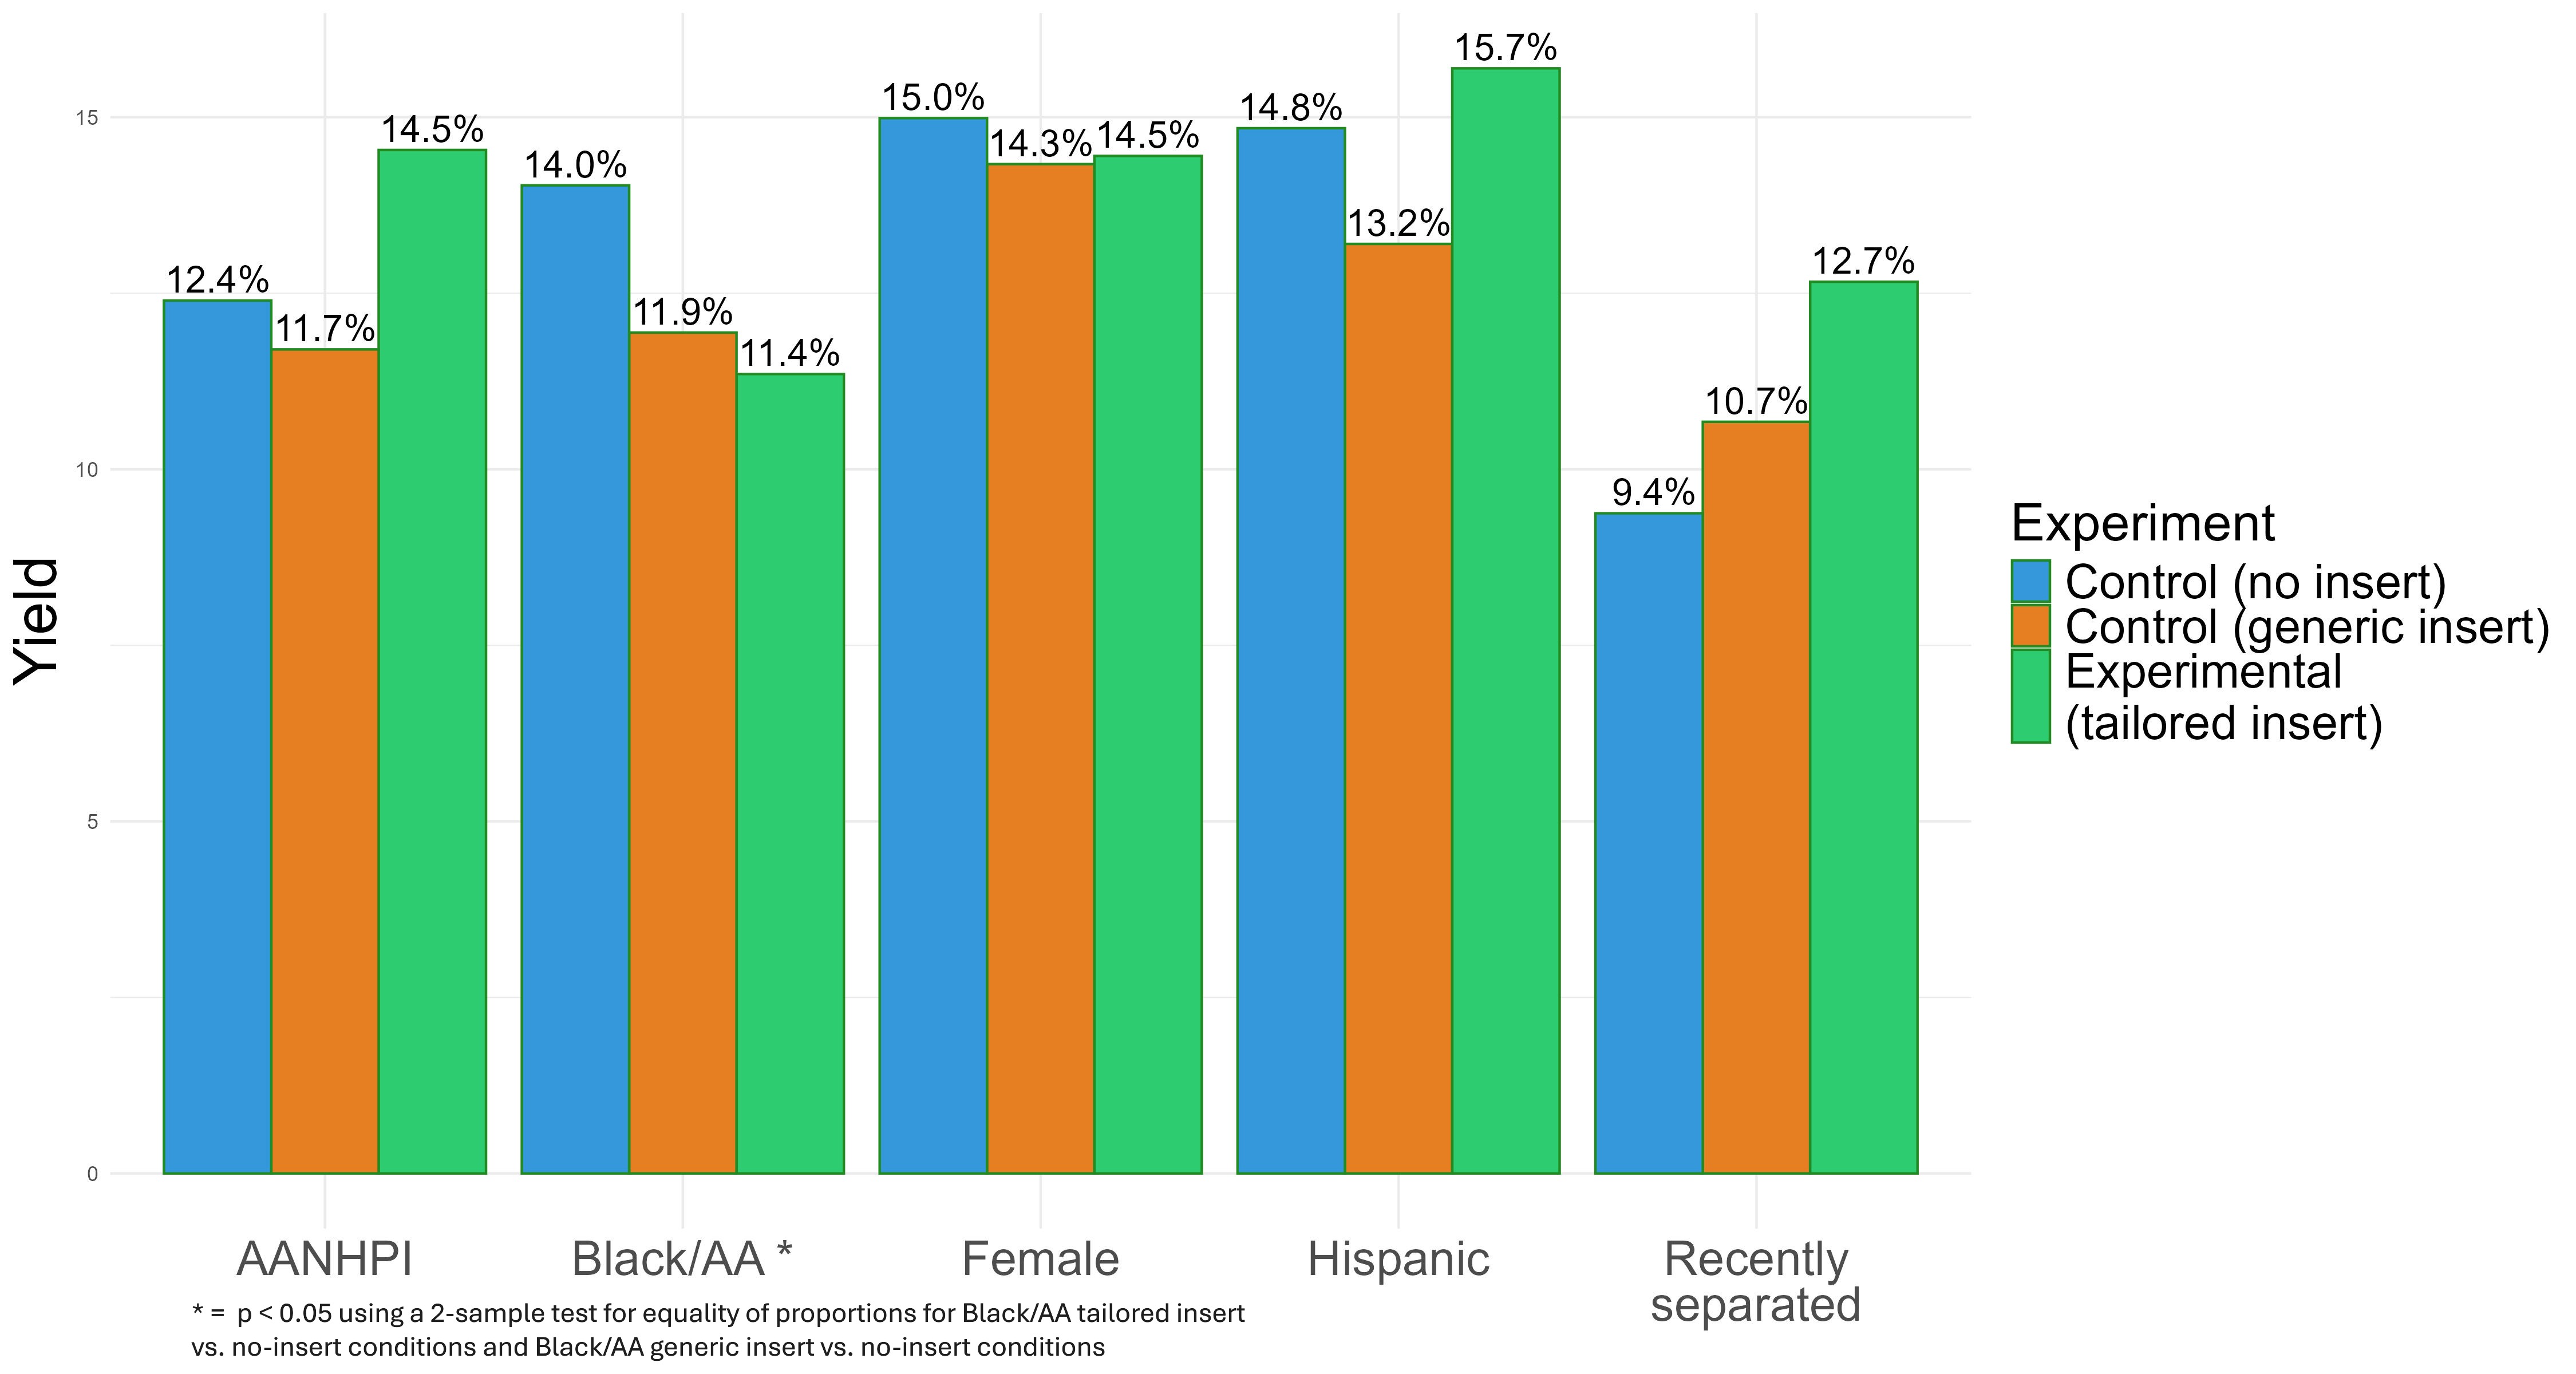
Figure 2 illustrates survey yields by experimental condition and demographic group. The pattern of findings regarding the effect of insert type differed across groups. Significant differences by insert type were only observed for Black/African Americans, among whom both insert conditions were associated with a statistically significant difference in yield; those who received tailored (11.4%; 95%CI=10.4-12.3) or generic (11.9%, 95%CI=10.6-13.4) inserts responded at significantly lower rates, compared to those who received no insert (14.0%; 95%CI=12.6-15.6; p=.02). No other demographic groups displayed this pattern, irrespective of statistical significance.
Additionally, no demographic group, including Black/African American Veterans, experienced significant differences in responding between those who received generic and tailored inserts. However, the magnitude of yield was notably larger in the tailored insert condition, compared to both the no insert and generic insert conditions among AANHPI and recently separated Veterans, and compared to the generic insert condition among Hispanic Veterans.

Results from logistic regression modeling are presented in Tables 4 and 5[1]. A negative effect of the tailored insert, relative to no insert, for the Black/African American group remained after accounting for age. No other significant effects were observed after accounting for age, nor was the interaction between age and tailored insert condition significant for any group, indicating no differential effect by age.
Discussion
While prior research suggests that tailored recruitment materials increase responding among different groups in the general population (Cunningham-Erves et al. 2022; Taani et al. 2020; Hughson et al. 2016), our findings suggest this may not be an effective approach to increase response among U.S. Veterans. Although we did not observe a significant increase in responding in the experimental condition for any Veteran groups in this study, we did observe a non-significant trend towards a positive effect of tailored imagery, compared to the no insert and/or generic insert, among AANHPI, recently separated, and Hispanic Veterans. Conversely, a statistically significant negative impact of tailored images was observed among Black/African American Veterans, for whom the no-insert control group had a higher yield rate than those who received inserts with tailored imagery. Consequently, the present findings do not support the effectiveness of using tailored imagery in recruitment materials to increase responding to a Veteran suicide prevention survey, though do suggest that further research is warranted. While the current research pertains to a Veteran population, the lessons learned about the use of tailored recruitment material for harder-to-survey subgroups can inform practices in other populations since, as noted above, the response patterns in Veterans by race/ethnicity and age mirror the response patterns in the general population (Jang and Vorderstrasse 2019; Morgan 2020).
A few possible explanations exist for these findings. First, recruitment materials representing one aspect of respondents’ identity may not positively influence survey response among Veterans. Individuals possess multiple identities, and the experimental manipulation focused on a singular assumed aspect of identity, which may have been inconsistent with their self-identity. It is also possible that the imagery did not highlight the most salient aspect(s) of identity; Veteran status or aspects of military service (e.g., branch) not featured may have produced results consistent with prior research in non-Veteran populations in which representation was associated with higher responding (Cunningham-Erves et al. 2022; Hughson et al. 2016; Taani et al. 2020). It is additionally possible that the imagery on the tailored inserts was better suited for some groups (i.e., AANHPI, recently separated, Hispanic Veterans) than for others (i.e., Black/African American Veterans) and/or that the generic insert influenced responding differentially across groups. Specifically, while the generic insert clearly included recently separated, female, and Black Veterans, other images were more racially and ethnically ambiguous and thus AANHPI and Hispanic Veterans may or may not have identified with the generic insert images. Additional research to identify optimal imagery for survey research with Veterans is warranted.
Another possible explanation is that different groups respond differently to visual representations of themselves in recruitment materials due to differential exposure to their group (e.g., in popular culture). If the novelty of seeing one’s group represented in recruitment materials motivates responding, members of less well-represented groups might respond better to tailored recruitment material than those of better represented groups. AANHPI representation in broader US culture, especially portraying such individuals as multidimensional, lags behind that of Black/African Americans and females (Wickliffe 2020). The lack of visibility among AANHPI individuals is a concern for AANHPI communities and Veterans (Yip et al. 2021; Polzer et al. 2025). Thus, one possibility is that Black/African American Veterans responded differently than AANHPI Veterans because images of AANHPI individuals are less commonly encountered. If supported by subsequent research, this would suggest that group-specific imagery highlighting race/ethnicity is unlikely to result in higher survey participation for some groups. Research is needed to evaluate this hypothesis.
Limitations
While this experiment had a sound design and robust overall sample size, there are limitations. We were only able to use three images on each insert and chosen images may not have been the most effective. Additionally, the AANHPI and recently separated subgroups had smaller sample sizes; post-hoc power analysis indicates this may explain why some larger differences observed for these groups were not statistically significant. Moreover, inserts were not the only material in the recruitment envelope, which also included a letter and, in the second insert mailing, a paper survey; such materials might have distracted respondents from the insert, limiting exposure to the stimulus. Nonetheless, this would be the case for most studies using tailored inserts; further efforts to isolate the insert effect may not optimally convey true effectiveness. Finally, the lack of additional covariates from the sampling frame (e.g., education) limited adjustment for potential confounding.
Conclusions
Given the myriad interpretations of our findings, which run somewhat contrary to existing literature, continued research is needed to understand the most effective recruitment materials for Veteran survey research. Such research could be qualitative (e.g., focus groups to understand recruitment material characteristics most responsive to individual group needs) or quantitative research (e.g., discrete choice analyses to understand the most influential features of recruitment materials). Such future research is critical to ensure that studies with Veterans are representative and generalizable.
Corresponding author contact information
Claire A. Hoffmire, PhD, Rocky Mountain Regional VA Medical Center, Rocky Mountain MIRECC for Suicide Prevention, 1700 North Wheeling St., Aurora, CO 80045. Telephone: 585-301-1442; E-mail: Claire.Hoffmire@va.gov
Acknowledgements
This material is based on work supported by the U.S. Department of Veterans Affairs (VA) Office of Mental Health and Suicide Prevention and the VA Rocky Mountain Mental Illness Research, Education and Clinical Center (MIRECC) for Suicide Prevention. The views expressed are those of the authors and do not necessarily represent the views or policy of the VA or the United States Government. The authors would like to thank all the ASCEND Veterans Engagement Board members for their contributions and input.
The interaction of age and experiment condition was not found to be significant in any of the regression models. For this reason, those models have not been included as they should not be interpreted.