Demographic items have long been an important element of survey research. They provide information about the sample, verify its representativeness, and allow for disaggregation of data by subgroups. In terms of design, one longstanding recommendation is to place these items at the end of the survey, so as not to distract respondents from key topics of interest (Dillman 2007). One more recent trend in the design of demographic items is to include a “prefer not to respond” (PNR) option, particularly for items that might be considered sensitive information (Santos et al. 2023). This allows the researcher to determine intentional vs. unintentional missing item-level information (Sischka et al. 2022), as the respondents can provide data points even for topics that elicit discomfort (Montagni et al. 2019). Including this response option is now recommended as a “best practice” in survey design across multiple sources. This suggestion appears in publicly available materials from leading professional organizations (AAPOR 2022), resources for institutional research professionals (Clayton 2021), or guidelines from industry user experience (Brown 2023). However, systematic searches yield very little scholarly research on how this option impacts data quality, either in the form of rigorous controlled experiments or descriptive explorations of how and why this option is used, and by whom. This study looks at use of the PNR option on a survey of postsecondary student experiences, to determine whether it is related to other quantitative and qualitative survey content, and what that might reveal about their motivations for selecting PNR.
Example Project: NSSE
Student engagement, defined as student involvement in educationally purposeful activities (Kuh 2001), has long been acknowledged to have positive impacts on key outcomes in higher education, such as learning, retention, persistence, and satisfaction (Astin 1993; Kuh 2003; Pascarella and Terenzini 2005). Engagement encompasses a range of experiences and perceptions (Kuh 2001; McCormick et al. 2013) and is related to courses and academic behaviors, thus making it a valuable element of institutional research and assessment activities. The National Survey of Student Engagement (NSSE), first launched in 2000 and then updated in 2013, was created to assess “activities and experiences that have been empirically linked to desired college outcomes” for students and uses student engagement as an umbrella term to capture numerous content areas including academic challenge, learning with peers, experiences with faculty, and campus environment (NSSE 2018, 1).
Over the past two decades, NSSE has been expanding the practice of including a PNR option. A relatively early adopter of the practice, NSSE first included a PNR option in 2005 for the race/ethnicity item. For many years, race/ethnicity was the sole item with this option. However, in 2013 during a major overhaul of the survey instrument, NSSE took this opportunity to expand the number of items offering a PNR option. Specifically, the 2013 update added a PNR option for the disability and sexual orientation questions in addition to the race/ethnicity question. The following year, a PNR option was added for gender identity. These four PNR items were featured on the survey from 2014 to 2022. In the 2023 administration, a fifth PNR option was added to an existing item about parent education level, thus resulting in the five current items with a PNR option: race/ethnicity, disability, gender identity, sexual orientation, and parent education.
The Current Study
There is an increasing use of PNR as a response option within survey design overall and NSSE specifically. Although recommended as a best practice, there is a lack of systematic research on how this demographic response option might be related to other survey content. Therefore, the goal of this study was to explore whether selecting PNR is indicative of any other aspects of the student experience. The research questions were:
-
What is the prevalence of PNR selection in this sample of postsecondary students?
-
What types of students are more likely to select PNR?
-
Is there a relationship between student engagement and the frequency of PNR selection?
-
For students who have a high frequency of PNR selection, are there any patterns in their qualitative perceptions of their institutions that might explain this survey-taking behavior?
Method
Data Source
This study uses data from the 2023 NSSE administration. NSSE is an annual survey administered in the spring semester to first-year and senior students at four-year colleges and universities across the United States (for the full survey instrument, see www.nsse.indiana.edu). We examined responses from 114,750 first-year students and 125,003 seniors attending 456 baccalaureate-granting institutions.
NSSE data collection takes place annually during the spring semester. Participating institutions provide NSSE staff with contact emails for all eligible students. These students are then invited to respond via an email request, which includes a link to the online survey instrument. Students receive a maximum of five contact emails. Because large institutions have disproportionately lower response rates, NSSE reports average institutional response rates, which for the 2023 administration was 26% (NSSE 2023).
Sample
Approximately 63% of the respondents identified as women, 32% identified as men, and between .3% and 2.6% selected one of the nonbinary gender categories (e.g., genderqueer, genderfluid, or transgender; students were allowed to select more than one gender category). A majority (90%) were enrolled full-time, and 81% were younger than 24 years old. About half (57%) of respondents were White, 8% Asian/Pacific-Islander, 9% African American/Black, 11% Hispanic/Latino, 10% multiracial, and 5% identified with another racial/ethnic group (e.g., Native American, “Another race/ethnicity” category) or preferred not to respond. Respondents self-reported a variety of academic major fields.
Measures
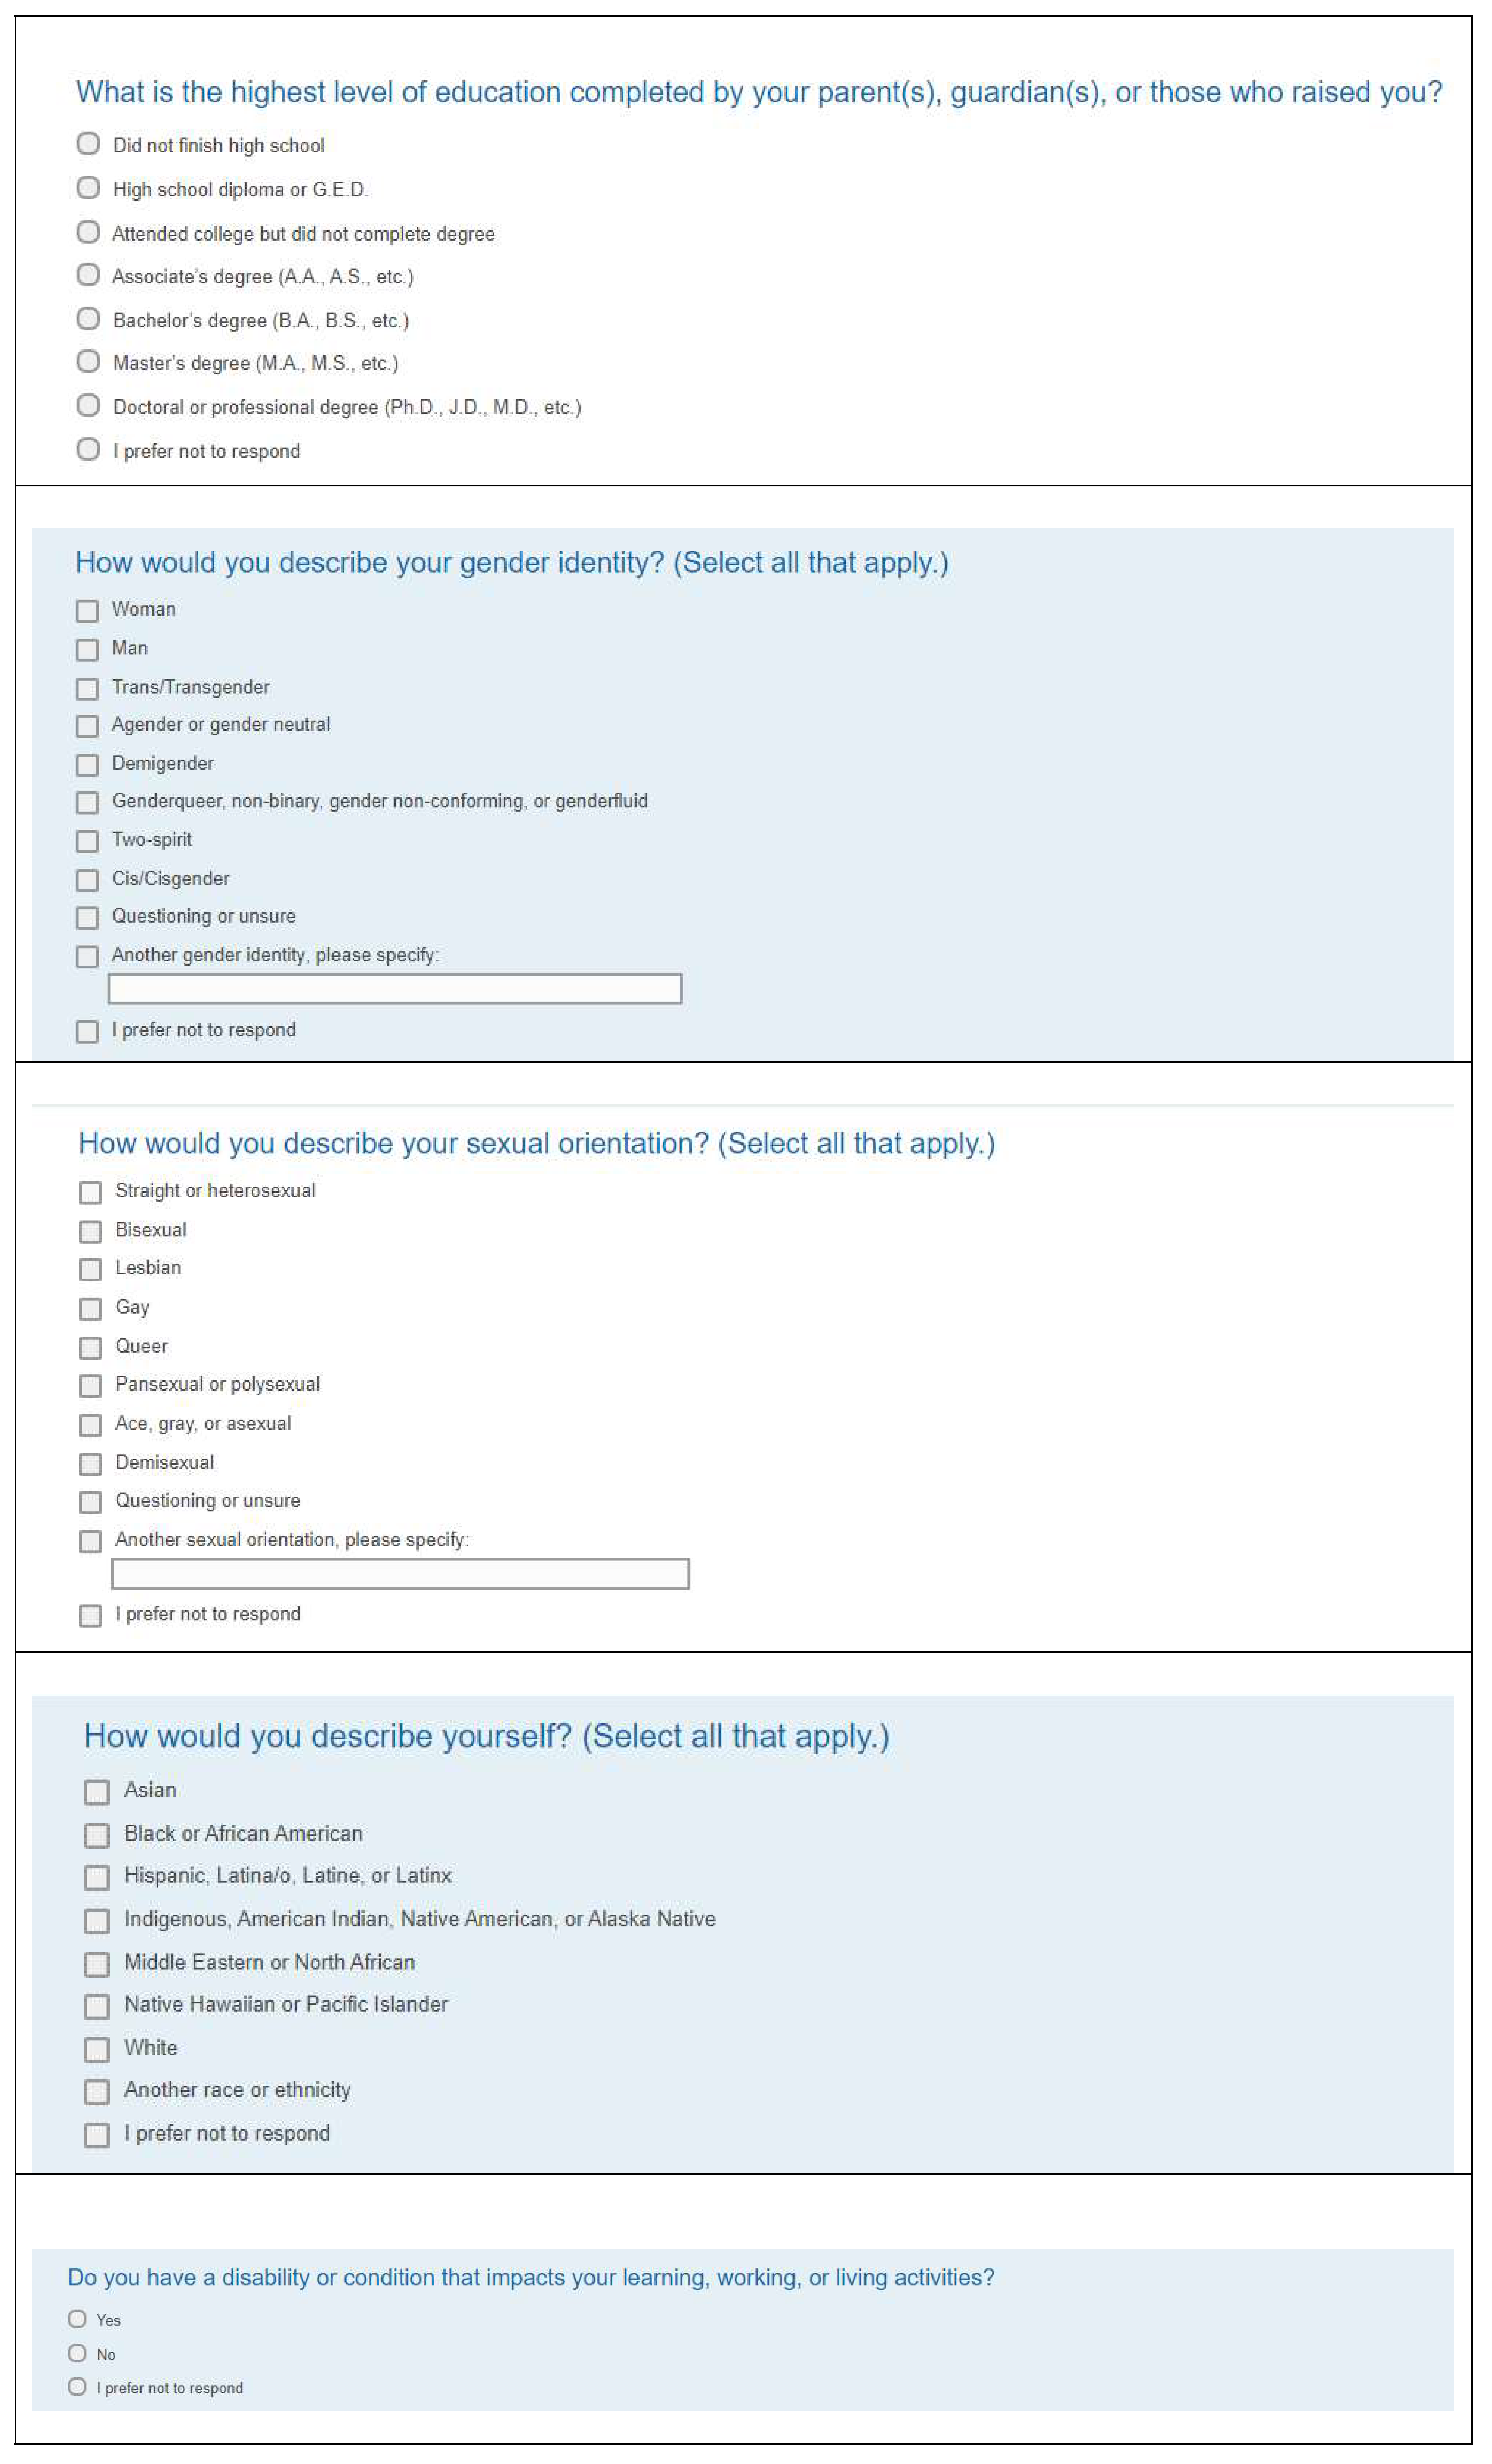
All five items from the NSSE demographics section that include a PNR option were the main focus for this study (see Appendix A for exact wording/layout of each). A count variable of “PNR frequency” was also created by summing the total number of these responses. For this created variable, students could range from a score of 0 (selected no PNR) to a score of 5 (selected all PNRs possible).
Other variables of interest for the study included 10 scales, which NSSE terms “Engagement Indicators” (EIs): higher-order learning, reflective and integrative learning, quantitative reasoning, learning strategies, collaborative learning, discussions with diverse others, student-faculty interactions, effective teaching practices, quality of interactions, and supportive environment. These have various stems and response options, with 3–8 items per scale. Each engagement indicator is scored on a 60-point scale. For more detailed information on the scale construction process see the NSSE website at https://nsse.indiana.edu/nsse/survey-instruments/engagement-indicators.html. Similarly, NSSE has also developed scales for sense of belonging and perceived gains (with parallel scoring construction to the EIs; see Table 1 for all Cronbach’s alphas and number of items per scale).
Other variables included in this study were individual survey items for overall institutional satisfaction, intention to return the following year (for first-year students only), and self-reported grades, self-reported course type (mostly in-person, mostly remote, mostly hybrid, or a mix of course type) and institution-reported age were also included in the study. Finally, an open-ended final comment asking students to make an overall assessment of their institutional experience and provide any additional feedback was also included in the qualitative component of the study.
Analyses
We explored the research questions using a mixed-methods approach that included descriptive statistics, inferential statistics, and a qualitative thematic analysis. First, we looked at frequencies for each item with a PNR option, as well as the frequencies of the created PNR count variable. Quantitative analyses, separate for first-year students and seniors, examined correlations for PNR sum and the continuous variables (EIs, sense of belonging, perceived gains, overall institutional satisfaction, self-reported grades, and age). An independent samples t-test compared means of PNR sum across first-year students who intended to return to those who did not. Chi-square analyses examined number of PNR responses by the categorical variable of course type, as well as age and grades by collapsed categories. For the qualitative analyses, a subgroup of students with the highest scores (4 or 5) for PNR count were selected, and their open-ended final comments were analyzed for themes.
Findings
Quantitative
Overall, there are low percentages for all five PNR options: gender identity (1.9%), sexual orientation (4.3%), race/ethnicity (3.0%), disability status (4.8%), and parent education level (3.2%). This is also reflected in the summed PNR count variable, with a frequency distribution of: no PNR responses (88.6%), one PNR response (8.3%), two PNR responses (1.5%), three PNR responses (.9%), four PNR responses (.5%), and five PNR responses (.2%). Overall, most respondents do not provide any PNR responses but among those who do, there is variation in their choice. It does not appear to be the case that if someone selects PNR for one question that they will automatically select that every time it is available, indicating that it is not a response style (Van Vaerenbergh and Thomas 2013).
Basic correlations (Table 1) showed small but statistically significant negative relationships between PNR count and all ten NSSE Engagement Indicator scores. There were also significant negative relationships for perceived gains, sense of belonging, overall institutional satisfaction, and self-reported grades, as well as a positive relationship for age (as a continuous variable). First-year students who did not intend to return to the institution the following year also had significantly more PNR responses compared to those who did intend to return; t(10361) = 10.25, p < .001, d = .138. Chi-square analyses suggested that students taking most of their courses online had significantly more PNR responses (Table 2). However, the chi-square analyses for collapsed categories of age and grades across PNR count also suggest that the distributions for age and grades may be non-linear, with the biggest differences for age and grades showing up for only one or two PNR options selected.
Qualitative
Of the students who had four or five PNR responses, 42% also provided a comment in the final question of the survey (n=466). Qualitative thematic analysis aimed to identify any common themes across comments, including why they may have chosen PNR or other survey-taking behaviors. A very small subset of students (n=4) directly expressed disapproval of the inclusion of demographic questions, noting they did not believe demographics were crucial to their experiences. Another subset (n=17) expressed hostility toward Diversity, Equity, and Inclusion (DEI) work on campus, which potentially influenced their reluctance to provide demographic information, as DEI work often targets specific demographic groups. An example of one of these comments is the student who said, “I don’t give a s–t about pronouns, or your sexuality or other f—ing nonsense.” [expletives redacted]. The use of expletives in this quote indicates a level of hostility towards demographic information that may have influenced their decision to choose PNR. Beyond these subsets, students’ comments did not directly indicate reasons for a PNR response. However, their comment data did have some other unifying themes, explored below.
Overall, the comments indicated a divide between students who expressed a loss of institutional trust or feelings of alienation and high-achieving students who praised their professors and the academic experience. In particular, the students’ praise often centered around interactions with professors. Some exemplar quotes can be found in Table 3.
While seemingly contradictory, the positive correlation between age and PNR count may suggest older students’ tendency to view relationships with professors as part of their support network. Self-exclusion from the demographics may be a cultural or generational preference rather than a reflection of their institutional experiences. This may explain the intentions of high PNR count students who left very positive comments.
Other comments reflected a loss of trust in their institution. These students’ comments indicate feeling disconnected from their community. For students whose comments showed a loss of institutional trust, refusal to provide demographic information may reflect overall withdrawal from engagement with the institution or distrust of how the institution would use the information. Exemplar comments from this category can be found in Table 4. Taken together, the qualitative responses indicate that students select PNR for a variety of reasons, not all of which should be interpreted as a red flag for student engagement or experience on campus.
Implications
For the NSSE survey, students who selected PNR responses were more likely to be outside of the 18–24 age range. Students outside of this age range tend to represent a small percentage of students on most campuses across the country (with the exception of online-only institutions) and their experiences may vary from students who fall within the 18–24-year-old range. The emphasis of these students in praising the relationships with staff and professors indicates they may view these relationships as important to their campus support systems, despite the quantitative trends that PNR students are overall less engaged and less satisfied with their educational experience. For students outside of the 18–24 age range, selecting PNR may be motivated by a cultural difference, rather than a reflection on their institution experience. While PNR responses can limit the ability to disaggregate data by demographics, these results provide an important reminder that this group may have various unknown background influences on their response choices.
Including PNR response options on surveys can provide more precision in data by reducing missingness (Sischka et al. 2022), but it is also important to understand the potential reasons behind this response preference and how they might reflect the respondent’s experience. Overall, these results indicate that students who selected PNR responses are less engaged and potentially disenchanted with various aspects of their undergraduate experience. However, their relationships were small in magnitude, denoting that dissatisfaction or a lack of engagement is not the only explanation. The further qualitative analysis of student comment data also suggests that this is not a unidimensional group when it comes to engagement and satisfaction. Their motivation extends beyond mere dissatisfaction with their education or institutions, so survey researchers should not necessarily assume that a PNR response is only indicative of dissatisfaction or negative affect. Our varied results indicate that researchers including a PNR response on their surveys should include qualitative analysis, when possible, to contextualize PNR responses. It may be just as important for these students to “feel seen” through their PNR selection as it is to have other inclusive identity options on the demographic items.
Future research should also address various comparisons between respondents who do and do not utilize PNR options, from both quantitative and qualitative perspectives. Although it was beyond the scope of this particular study, a sample of comments from the students who did not select PNR could provide some additional comparisons, especially if it focused on older students. Deeper investigations of other components of data quality might also shed light on PNR responses, such as looking at relationships between PNR count and straight-lining patterns or looking at previous years of data (before the PNR option was added) for comparisons of the missingness on those specific items. Experimental designs could also be implemented to directly test whether a PNR option can reduce missingness for survey items. This work should also be replicated with other surveys on topics outside of postsecondary education. Surveys on varied topics such as drug use, sexual behaviors, or even consumer studies might elicit different distributions of PNR selection or connections to other survey content.
Limitations
Although there are several strengths of this study, some limitations should be stated as well. Given the data collection procedures and response rates, the sample may not be representative of all students in the population, and thus, generalizations should be made with caution. Additionally, this study relied on self-reported data. While self-reported aspects of the PNR responses were part of the research question, the reported engagement behaviors and satisfaction items may not always be completely objective. However, most studies looking at self-reports in higher education suggest that self-reports and actual measures of things like abilities are positively related (Anaya 1999; Hayek et al. 2002; Pike 1995; Zilvinskis, Masseria, and Pike 2017). Furthermore, the approach to converting the PNR responses into a count-based measure is innovative yet also may be losing nuance when it comes to interpretation. The qualitative component of the study did, on the other hand, attempt to address the distinctions in PNR responses, albeit this thematic analysis was based only on respondents with four or five PNR selections and may not fully generalize to those who selected fewer.
Conclusion
This study offers insight into the rationale and development of demographic items that include “I prefer not to respond” as a response option, using a well-known national research and assessment project as an exemplar. It is useful to explore engagement and experience patterns in the context of PNR responses for first-year and senior students, with the benefit of a large sample including hundreds of four-year colleges and universities. Investigating the quantitative and qualitative patterns of PNR responses, engagement items, experience items, and open-ended comment themes, as well as some potential reasons for these findings, can promote reflections about institutional and survey research professionals’ own experience with PNR survey items. Knowledge of this topic can better inform best practices in survey design and interpretation and can advance the conversation about more research that should be done to explore the effectiveness of this practice for the field and better understand motivations of respondents who select this option.
Funding statement
This research did not receive any specific grant from funding agencies in the public, commercial, or not-for-profit sectors.
Data availability statement
The NSSE data set is proprietary and not currently available for free public use. Syntax for all analyses included in this paper are available from the authors upon request.
Declarations of interest
None.
Human subjects statement
The data collection and analysis adhere to all human subject guidelines, as specified by the Indiana University Institutional Review Board (Protocol # 709000079), as well as with the Institutional Review Boards of all institutions participating in the study.
Corresponding author contact information
Angie L. Miller, Ph.D., Indiana University Bloomington, anglmill@iu.edu
