


Introduction
The Current Population Survey (CPS) is adding a web mode to its interviewer-administered data collection (Linse and Johnson 2023). The CPS interviews a monthly sample using a four-eight-four design where respondents are interviewed once a month for 4 months, leave the sample for 8 months, and return for another 4 months.
In 2024, we conducted usability testing on the newly designed CPS web instrument in preparation for a field test. While the first interview, the month-in-sample 1 (MIS-1), and the MIS-2+ interviews are similar, some differences exist that required usability testing to be conducted on both versions of the web instrument. In MIS-1, household respondents build a household roster, answer demographic questions about each household member, and then answer labor force participation questions about each household member ages 15 and older. In MIS-2+, household respondents must confirm or update the household roster (see Figure 1) and update labor force information for eligible household members.

The MIS-2+ instrument reduces respondent burden by presenting previously collected data (“dependent data”) to the respondent to confirm or update (see Figure 2). While dependent interviewing has been studied carefully in interviewer-administered contexts (see Jäckle and Eckman 2019), there has been limited research in dependent interviewing in web-administered surveys (see Engstrom and Sinibaldi 2024 for one example) and few, if any, have focused on the usability of questions with dependent data on the web.

The login process also differed for first-time and returning users. First-time users must enter three pieces of information: (1) their email address, (2) an 8-digit verification code sent to their email, and (3) a 12-digit User ID listed in their survey invitation. Returning users only need to enter their email address and the 8-digit verification code sent to their email.
Iterative usability testing is considered best practice because it enables the instrument to be updated between rounds based on feedback from prior usability sessions (Geisen and Bergstrom 2017). Usually, rounds are conducted with different participants. Given the objectives of this study, we opted for a longitudinal study design where participants were recruited to participate in two usability sessions – one on the MIS-1 web instrument to evaluate the initial rostering and first-time login procedures, and the second on the MIS-2+ web instrument to evaluate returning user login procedures, roster updates and confirmation, and use of dependent data. This paper details the considerations we made in designing the longitudinal usability study, lessons learned, and recommendations for others who may pursue a longitudinal qualitative design in future work.
Longitudinal Usability Study Recruitment Design and Procedures
Longitudinal usability testing has the unique risk of attrition between rounds of data collection. Prior longitudinal qualitative studies document the importance of developing retention plans and suggest strategies such as collecting multiple modes of contact information from participants, sending interview reminders, establishing the best time and mode of communications, providing incentives and increasing incentives at later interviews to encourage participation, gathering contact information of family or friends, keeping follow-up interviews brief, or providing updates or findings from the study to participants (Hewett 2017; Farrall et al. 2015; Thomson and Holland 2003; Sullivan et al. 1996). We selected several strategies to minimize the potential impact of attrition, including setting the interview goal higher in the first round, increasing incentives in Round 2, compressing the interview schedule, and adopting proactive scheduling protocols for the second-round interviews.
First, we needed to decide how to divide the total number of interviews (about 120) between Round 1 (the MIS-1 instrument) and Round 2 (the MIS-2+ instrument). We assumed we could recruit at least 50 percent of participants to return for a second interview and we needed to collect data in Round 2 from at least 40 participants to test all potential paths through the MIS-2+ instrument. With this in mind, the interview goal for Round 1 was set at 80 interviews. We anticipate that more than 80 interviews in Round 1 would be cost prohibitive for data collection, especially if no insights were gained from additional interviews.
When conducting 1-hour interviews for the U.S. government, a $40 incentive is usually offered to help offset costs for an individual’s participation. To encourage participants to complete both interviews, we increased the incentive amounts to a $50 electronic gift card in Round 1 and a $60 electronic gift card in Round 2. The higher incentive amount in Round 2 was designed in part to encourage their continued participation in the study.
The study team conducted interviews from June to August 2024 for Round 1 and from October to November 2024 for Round 2. While programmatic needs drove the timing of interviews for Round 2, we also believed that minimizing the amount of time between the Round 1 and Round 2 interviews would reduce the risk of attrition. Figure 3 shows the number of weeks between participants’ Round 1 and Round 2 interviews (mean=13.3, std dev=1.7).

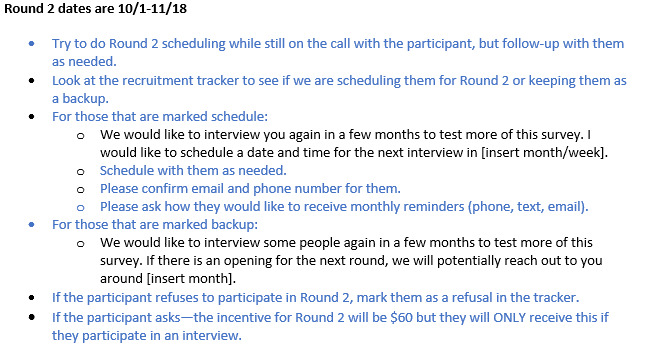
At the end of Round 1 interviews, interviewers assessed participants’ interest in and availability to be reinterviewed and their preferred way to receive a reminder (see Figure 4). Participants were marked in the recruitment tracker as either a priority to schedule for Round 2 or a backup. Priority determination focused on employment status and the device used to complete the Round 1 interview to ensure a variety of participants in Round 2. Priority participants were scheduled immediately, when possible, and sent a reminder 1 month prior to the Round 2 interviews via their preferred contact mode. A few weeks before the Round 2 interviews began, recruiters completed scheduling for those not scheduled already. In these contacts, we emphasized the incentive amount to draw attention to the increased incentive amount (see Figure 5).

Recruitment Outcomes and Challenges
The study team received more than 950 screening responses across all the online advertisements posted in Round 1. Table 1 displays the recruitment outcomes. In Round 1, we completed 80 interviews and contacted an additional 71 eligible participants who were not interviewed for various reasons.
During Round 2, we completed 47 interviews exceeding the goal of at least 40. We contacted an additional 13 eligible participants who were not interviewed for various reasons. We did not attempt to contact the remaining 20 participants because we had already met our minimum goal, and we reached saturation where no new insights were emerging from additional interviews.
Overall, the Round 2 recruitment was successful. The rates of no response, refusals, no show, and withdrawals were lower in Round 2 than in Round 1. This is likely due to several factors – our pool of potential participants for Round 2 included those who were able and willing to complete a Round 1 interview, the Round 1 and Round 2 interviews were only a few months apart, and we increased the incentive amount for Round 2.
Designing the Protocol and Instrument for a Longitudinal Usability Study
The process of developing the Round 1 protocol was like designing protocols for other usability studies where we identified the main areas of concern, defined the observational data interviewers should collect, and scripted probes for areas of interest. In Round 2, we added new probes to address features in the MIS-2+ instrument, particularly for questions that had dependent data prefilled in select-one and write-in question.
However, developing the Round 2 protocol presented unique challenges. Because returning participants were already familiar with the system and survey, there was a potential for redundancy in their experience and feedback. Additionally, screens that may have been challenging for them in Round 1 may not be challenging in Round 2 due to their prior exposure. To deal with this, we developed conditional probes to be asked only if the participant had issues. For example, people currently looking for work are asked about the activities they did to look for work. The scripted probes for this question were only to be asked if the person had issues with the screen, such as having trouble selecting an answer or not knowing the correct way to navigate through the instrument (see Figure 6).

On the other hand, some question formats had relatively little empirical usability data in Round 1 because only respondents experiencing relatively rare labor force situations encountered the format. One example was questions where the participant could select the unit of measurement in a dropdown alongside a write-in box (see Figure 7). This question format was only used for items asked to people who had been laid off or who were not working and looking for work. We wanted to collect additional data on these items – especially among those who might be seeing them for the first time. Therefore, on these screens, we encouraged interviewers to administer the scripted probes regardless of whether the participant had issues or not.

Finally, we developed alternatives for a few questions because participants had difficulties with them in Round 1. We opted to administer scripted probes in Round 2 to test these alternatives only if someone experienced issues on the screen. We limited these probes since we were concerned that participants’ exposure to the Round 1 design may bias their answers or their experience leading to more positive findings than we would get if these designs were tested on a new set of participants (see Figure 8 for an example of one of the alternative items tested).

In contrast to iterative study designs, the longitudinal design of this study challenged our ability to develop a protocol to thoroughly test design changes. For example, participants experienced usability issues in a country dropdown list for questions on the household members’ country of birth in Round 1. Design changes were made for Round 2. However, if the participant previously answered the country of birth questions in Round 1, the instrument bypassed these questions in Round 2 to reduce respondent burden. Only a subset of participants saw these questions in Round 2, which limited our ability to gather feedback on this design change across the full set of participants.
Conducting Interviews and Analysis in a Longitudinal Usability Design
The process of analyzing each round’s findings was generally similar to that used in other usability studies. However, because the time between rounds was intentionally short to reduce the risk of attrition, conducting flow analysis was vital to detect any major issues that required design changes. During the Round 1 interviews, each week the research team reviewed new interview summaries and met to discuss any common usability issues that participants experienced. This allowed the team time to research and implement design changes for Round 2, such as updating the country of birth dropdown list. However, it should be noted that these analyses could only detect major issues that occurred across many participants early in data collection.
There were some differences in the findings between Round 1 and Round 2. Overall, participants experienced fewer usability issues in Round 2 than in Round 1, which we attribute to the design features of the Round 2 instrument and to their prior exposure to the survey. The major difference between the Round 1 and Round 2 instruments was the use of dependent data in Round 2. For example, in Round 1 many participants had difficulty logging in, building the household roster, answering questions about disabilities for people in the household, and reporting the country of birth for household members. For these sections in Round 2, participants were sometimes asked to confirm or update information, and other items were not asked if there was previously provided data. To some extent, the observation of fewer issues in Round 2 was tied to the use of dependent data. Overall, the findings on participants’ interactions with dependent data were positive and few usability issues were identified. Many participants noted that the pre-filled answer in the select-one and write-in questions made the response process more efficient and those who needed to update responses were able to do so successfully. The only issue found with dependent data was that, for some mobile participants, the wrapping for write-in questions did not appear on the screen correctly, making it difficult for them to read.
Familiarity with the system and learning how to interact with the instrument during Round 1 also contributed to fewer issues in Round 2. In fact, some mentioned remembering how a feature was implemented in the Census Bureau’s web survey platform in the previous round. For example, the Round 1 login process (where participants entered their email address, an 8-digit verification code sent to their email, and a 12-digit user ID) was very difficult for some participants to successfully complete. Many had at least some issues with this process. However, the login process in Round 2 was much easier for participants and they experienced fewer issues. Participants commented that the Round 2 login process was easier because it had fewer steps (users only needed to enter the email address and the 8-digit verification code sent to their email). Additionally, we do not discount the effect of their familiarity with the login process learned in Round 1.
Discussion
Driven by operational design and key research objectives, we conducted a longitudinal usability study to evaluate the new web instrument for the Current Population Survey. This study design differed from the best practice of conducting iterative usability testing to evaluate revisions to an instrument. Overall, this design had a few advantages for our research goals. We were able to evaluate how a returning user would interact with the login process, roster confirmation and updates, and dependent data screens in a setting that resembled a production environment. We gathered important information about how participants perceived the use of dependent data in the instrument and found that it was successfully implemented in most scenarios.
We were successful in meeting our total participant goals for both rounds and our procedures developed for recruiting and retaining participants for the second round were effective. This included increased incentives for the second interview, using the first interview to encourage participation in the second round, scheduling interviews close together, and sending reminders for participation in the second interview, all of which were effective in limiting attrition. For other studies, a retention plan may require additional strategies to minimize attrition if the time between interviews is longer or if the study is focused upon participants who are likely to change their contact information frequently. For example, Farrall et al. (2015) note that retention plans may even differ within the same study depending on the characteristics of the participants. For other researchers designing longitudinal usability studies in the future, it may be useful to gather data from participants on which strategy used most encouraged their participation in later interviews.
Tradeoffs did exist in this study. While the timing between surveys was driven by programmatic timelines and our desire to limit attrition in the usability testing, the close timing of Round 1 and Round 2 interviews limited our ability to make substantial changes to the instrument (e.g., order of the questions) based on what we learned in the first round. For those changes that we did make, it was difficult to design a protocol for Round 2 that would allow us to collect sufficient information on these changes due to the use of dependent data. We observed fewer issues in Round 2, which was at least partly due to its use of dependent data; we also suspect that the prior exposure to the survey and production environment reduced many usability issues from arising.
For others conducting usability testing with a longitudinal design, we recommend balancing the compressed timing between rounds to reduce attrition and allowing time for instrument design changes. The approach we used for recruiting, scheduling, and reminding participants of interviews, and offering increased incentives for the second interview helped manage attrition effectively. Our findings suggest that we could have recruited fewer participants in Round 1 and still obtained the same number of interviews in Round 2. Alternatively, to address the limitation of not being able to effectively test changes iteratively, a sample of new participants could be included in the second round to test the instrument changes between rounds. However, this design may require extra resources for conducting and analyzing interviews in the second round.
Any views expressed are those of the authors and not those of the U.S. Census Bureau. The paper has been reviewed for disclosure avoidance and approved under CBDRB-FY25-CBSM004-007.
Conflicts of interest
The authors declare no potential conflicts of interest with respect to the research, authorship, and/or publication of this article.
Funding
The authors did not receive specific funding for this work.
Corresponding author contact information
Renee Stepler, U.S. Census Bureau, 4600 Silver Hill Road, Suitland, MD 20746,
Email: renee.a.stepler@census.gov