Background
Longitudinal studies offer a unique opportunity to study the long-term impacts of behaviors, experiences, and interventions on important outcomes. Retaining study participants over time is necessary to ensure sufficient sample sizes and reduce the potential for bias; however, efforts to improve response rates can substantially increase data collection costs. Understanding how to balance collecting high quality, reliable data with cost is critical to the sustainability of such studies. This paper describes a mixed-mode experiment comparing two web/mail designs on response and cost for a longitudinal study of 1990-1991 Gulf War-era veterans, focusing on those that had historically low response.
A variety of strategies have been tested to yield higher response rates while maximizing cost-effectiveness. Offering multiple modes, varying when they are introduced, and using incentives to “push” sample members to complete in specific modes holds promise, though results are mixed. While early research suggested that giving people a choice to respond by web or paper lowered response rates (Dillman, Smyth, and Christian 2014; Gentry and Good 2008; Griffin, Fischer, and Morgan 2001; Grigorian and Hoffer 2008; Medway and Fulton 2012; De Leeuw 2018; Millar and Dillman 2011; Smyth et al. 2010), more recent studies suggest offering modes concurrently yields similar or even higher response rates (Bucks, Couper, and Fulford 2020; Jackson, Medway, and Megra 2023; Medway et al. 2022). Longitudinal surveys can be quite costly, largely due to the upfront expense of tracking people who move (Joshi 2016; Lynn and Lugtig 2017). For this reason, it is important to find efficiencies in survey administration which reduce costs to sustain the study long-term. Cost during data collection is largely driven by mode selection and can be substantially lower if more respondents complete by web than paper (reducing the cost of mailings and processing paper surveys). Offering “Choice+”, in which study participants are given the option to complete the survey on the web or by paper but offered a bonus incentive to complete the survey on the web, can result in higher web response and lower cost-per-complete with positive or neutral impact on response rates (Biemer et al. 2018; Lewis, Freedner, and Looby 2002)
The Gulf War Era Cohort Study (GWECS), sponsored by the U.S. Department of Veterans Affairs (VA), is the largest and longest-running longitudinal cohort study of 1990-1991 Gulf War veterans. It has contributed much of what is known about the health effects of 1990-1991 Gulf War deployment, producing more than 30 peer-reviewed publications. By reinterviewing 30,000 veterans approximately every 10 years, the study provides critical information on chronic medical conditions, mental health conditions, functional impairment, and healthcare utilization. These findings are used to inform healthcare and benefits policy for Gulf War veterans making the maintenance of sufficient sample sizes for longitudinal analyses essential. Historically, paper has been the predominant mode, supplemented with computer-assisted telephone follow-up. To address declining response rates, a web mode was added in the third wave (2012) and proved effective. However, further improvements are needed to maintain response in a cost-efficient manner.
To further explore ways to maintain or improve response for the GWECS, an experiment was embedded into the fourth wave (conducted in 2024) to evaluate the impact of offering study participants Choice+. Two Choice+ designs were compared, one in which web was offered initially with paper introduced later (sequential), and one in which both web and paper were offered at the same time (concurrent) to determine which would result in higher response. Each design was also evaluated for its effect on sample representativeness and associated costs.
Data and Methods
Sample
The full sample for Wave 4 of the GWECS was comprised of 30,000 veterans—15,000 who were deployed to the Persian Gulf between 1990 and 1991 (Gulf War veterans) and 15,000 who served elsewhere during the same period (Gulf Era veterans). These veterans were sampled from the Department of Defense’s Defense Manpower Data Center (DMDC), with representation from each branch of service (Air Force, Army, Marines, Navy). Women, National Guard members, and reserves were oversampled (Kang et al. 2009) to enhance subgroup analyses. Of the original 30,000 in the cohort, a total of 26,580 living veterans were invited to participate in Wave 4.
The experiment included 15,135 veterans who participated in only one or two of the previous three waves. These veterans were randomly assigned to either the concurrent (n = 7,567) or sequential Choice+ group (n = 7,568). This subset was selected based on the premise that partial prior participation, coupled with targeted outreach, might increase their likelihood of engaging in Wave 4. A comparison of this group to the eligible sample revealed some significant differences based on sample characteristics; however, the differences were small (i.e., no more than one percentage point).
Experimental Design and Study Protocol
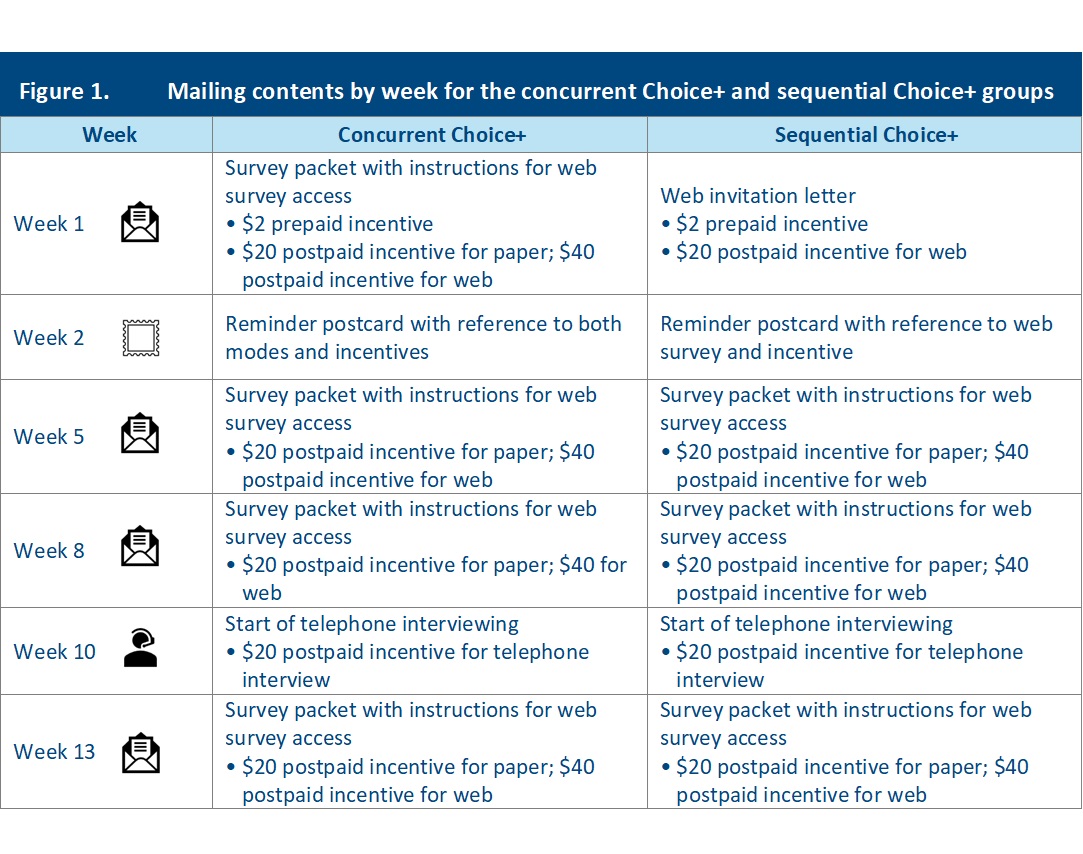
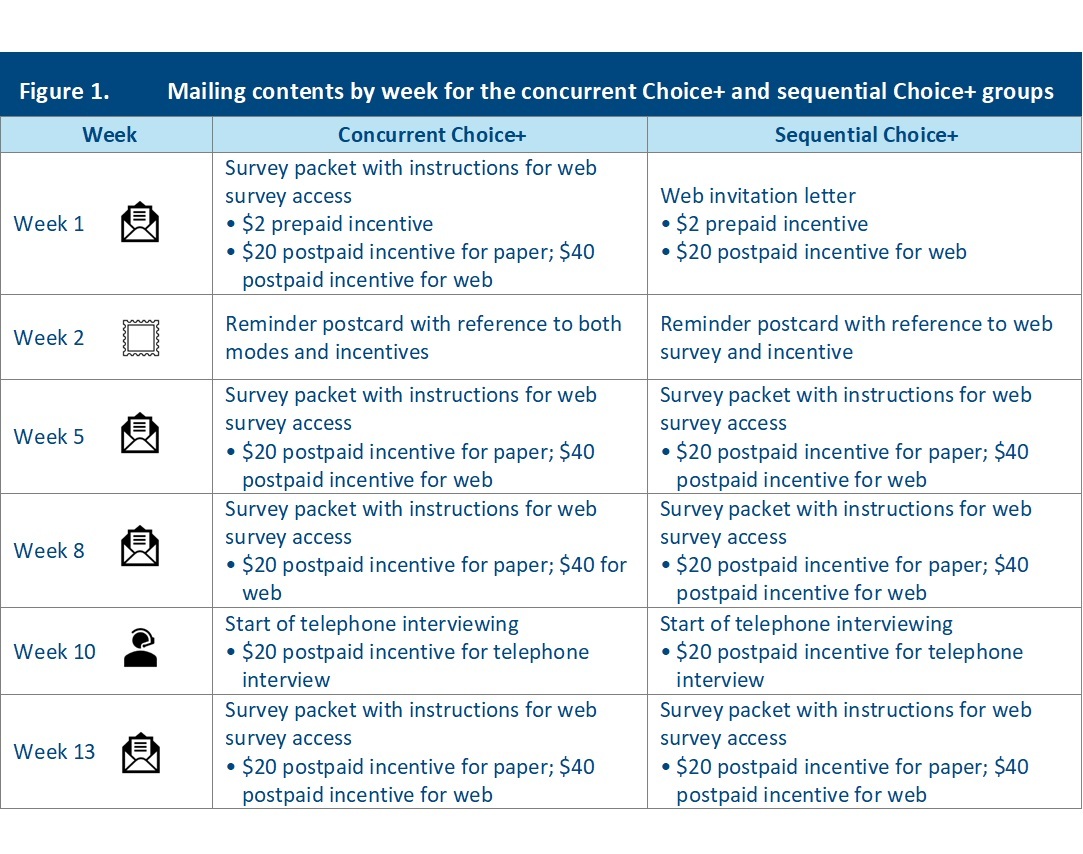
The experiment was designed to compare response rates and costs between the concurrent Choice+ and sequential Choice+ designs. Veterans in the sample were randomly assigned to two groups with equal probability. The protocols, as shown in Figure 1, differed only for the first mailing: the sequential Choice+ group received a letter with instructions for completing the survey on the web and a $2 prepaid cash incentive (a paper survey was not provided until second full mailing). This group was offered a $20 postpaid incentive for completing the survey on the web. The concurrent Choice+ group received the same instructions for completing the survey on the web and a paper copy of the survey in the initial mailing along with a postage-paid return envelope, and a $2 prepaid cash incentive. This group was offered a $20 postpaid incentive for completing the survey on paper, and a $20 bonus incentive ($40 total) for completing the survey on the web. Because the web bonus was offered from the beginning of data collection for the concurrent Choice+ group and when the paper survey was introduced for the sequential Choice+ group, the experiment is not a strict test of concurrent and sequential designs. Rather, it is a test of a concurrent design that offered a web bonus versus a sequential design that offered a web bonus when the paper survey was introduced. Veterans in both groups who had not responded by week 10 were contacted by telephone. They were offered a $20 postpaid incentive for completing the survey via Computer Assisted Telephone Interviewing (CATI).
Analysis Plan and Statistical Methods
Response rates. To determine whether response rates differed significantly between the groups, unweighted response rates were compared both cumulatively at the end of data collection and for each week. Response rates were calculated using the American Association for Public Opinion Research’s RR6.[1] A chi-square test was used to test for significant differences in the unweighted response rates at the end of data collection.
Nonresponse bias. Respondents in both groups were compared with eligible members of the sampling frame on basic demographics (sex, age, and marital status) and military characteristics (deployment status, military rank, branch, and type of service) at the time of the Gulf War to determine if respondents were over- or under-represented in each design. Differences between respondents and eligible members of the sampling frame were tested using t-tests.
Survey estimates of socio-economic factors and health conditions. To determine whether the concurrent Choice+ or sequential Choice+ designs resulted in significantly different survey estimates, several key estimates of particular interest to VA health researchers were examined. Estimates of self-reported health conditions were compared across groups, including indicators of general health, chronic medical conditions, mental health conditions, alcohol and drug dependence, and cigarette smoking. All estimates were weighted using base weights reflecting selection probabilities,[2] with variances computed using the jackknife replication (JKn) method. Differences between groups were tested using the Rao-Scott chi-square test. Survey estimates among respondents were also compared on two socio-economic factors: educational attainment (high school or below, some college or associate’s degree, bachelor’s degree, graduate or professional degree) and household income.
Survey cost. The cost of each protocol was evaluated by calculating the cost-per-complete. Costs included printing, assembling, and mailing surveys (including outbound and return postage); labor associated with scanning paper surveys; interviewer labor associated with CATI nonresponse calls for each protocol, and the cost of incentives. Total costs for each protocol were divided by the number of respondents to derive the cost per completed survey.
Many data collection costs were fixed and applicable to both groups. The cost analysis therefore focused on direct costs specific to recruiting participants and collecting data. For example, the time to develop and program each survey mode (since this cost was the same across groups) were excluded, but did include the time needed to scan and confirm the data captured for each paper survey returned (since the number of returns varied by condition).
Results
Response Rate Comparison
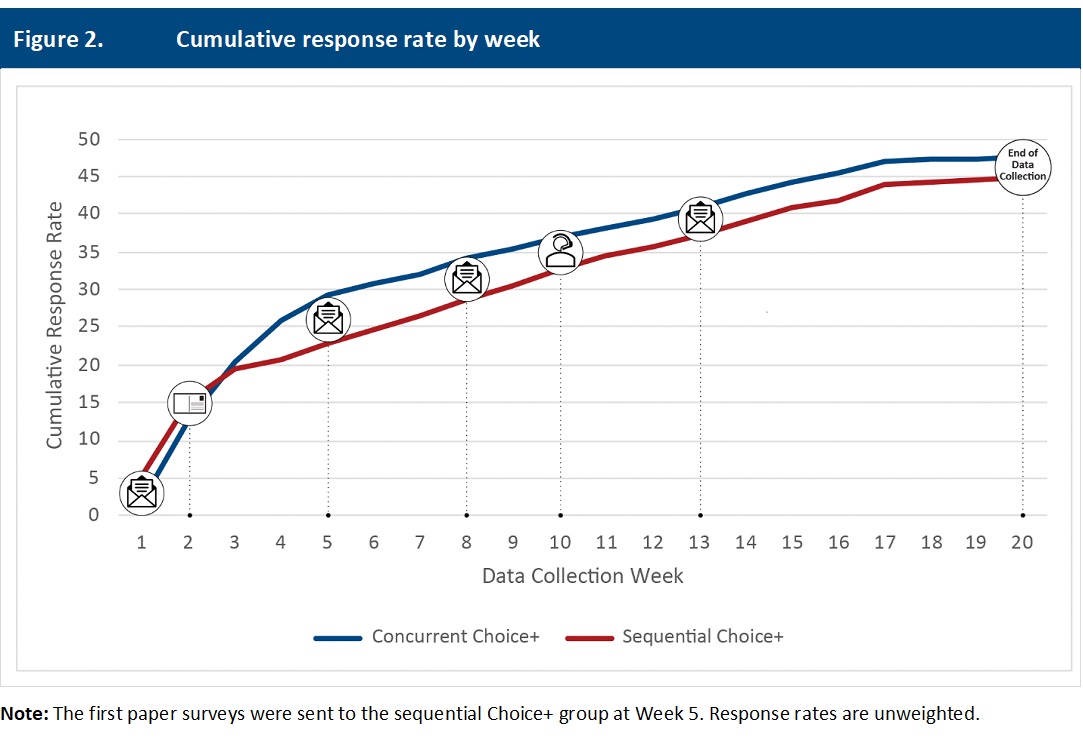
The final response rate for the concurrent Choice+ group was 2.8 percentage points above that of the sequential Choice+ group (47.5 versus 44.7 percent, p < 0.01). Although response was initially higher in the sequential group during the first two weeks of data collection, the receipt of paper surveys in the concurrent group shifted the trend. From that point forward, response rates in the concurrent group remained higher than those in the sequential group for the remainder of the data collection (see Figure 2).
The majority of veterans chose to respond to the survey via web, regardless of experimental group (see Table 1). However, the percentage of respondents choosing to respond by web was 10.4 percentage points higher in the sequential Choice+ group than in the concurrent Choice+ group.
The concurrent Choice+ group was offered the bonus incentive for web from Week 1, while the sequential Choice+ group was not offered the bonus until Week 5. Still, the sequential Choice+ group maintained a higher web response rate throughout data collection: consistently between one and three percentage points higher than the concurrent Choice+ group. In Week 3, we began receiving paper surveys from the concurrent Choice+ group. Because the sequential group did not have an opportunity to respond by paper until the Week 5 mailing, paper surveys were not received from that group until Week 7. The concurrent group’s paper response rate remained higher than the sequential group’s by about six to seven percentage points throughout data collection.

Nonresponse Bias
Comparisons of respondents in both groups to eligible members in the sampling frame indicate that patterns of nonresponse were similar for both the concurrent Choice+ and sequential Choice+ groups (see Table 2).
Survey Estimates of Socio-Economic Factors and Health Conditions.
We compared socio-economic factors between respondents in the concurrent Choice+ and sequential Choice+ designs using chi-square tests. Respondents did not differ on educational attainment and household income (see Table 3).
The chi-square tests on key survey health estimates indicated no significant differences in the percentage distributions between the concurrent Choice+ and sequential Choice+ respondents for most estimates (see Table 4). The difference in distribution of alcohol use quantity was statistically significantly different; however, the absolute differences were relatively small.
Comparison of Costs
The cost-per-complete for the concurrent Choice+ protocol was 16 percentage points higher than for the sequential Choice+ protocol. The largest differences were in the cost of processing paper surveys and incentives. Processing paper surveys was more expensive per complete for the concurrent Choice+ group because veterans in this group returned a higher proportion of paper surveys. Incentive costs were higher for the concurrent Choice+ group because this group received $40 to complete the survey by web from the beginning of data collection (Week 1), while the sequential Choice+ group only received $20 to complete the survey by web until Week 5, when they received the additional $20 bonus. At this stage, however, many had already completed the survey via web for the lower incentive amount. Nonetheless, the cost-per-complete was still higher among the concurrent Choice+ group even with incentives excluded, although the difference between concurrent and sequential group costs was smaller (a relative increase of 9 percent). Table 5 shows the ratio of cost-per-complete in the two protocols for each of the data collection categories as well as the total.
Discussion and Conclusions
Overall, the concurrent Choice+ design produced a modestly higher response rate than the sequential Choice+ design. However, there were no detectable differences in the characteristics of respondents in each group compared with the eligible sample or between respondents in each group on key survey items, suggesting the lower response did not introduce bias into estimates. At the same time, the cost to implement the concurrent Choice+ design was substantially higher per complete than costs to implement the sequential Choice+ design, with incentives and the cost of processing paper surveys accounting for the largest increase. This suggests that the less costly sequential Choice+ approach may be the preferred approach for subsequent waves.
In addition to mode order, a difference in the bonus incentive between the groups could explain the differences in response rates. The concurrent Choice+ group was offered the web bonus from the beginning of data collection, whereas the sequential Choice+ group was offered the web bonus only after the paper survey was introduced. Offering the web bonus from the beginning of the data collection for the concurrent Choice+ group may have contributed to the higher response rate for that group. If the web bonus had been available from the beginning of data collection in the sequential Choice+ group, it seems likely that the already modest difference in response rates may have been attenuated. This further underscores the conclusion that the less costly sequential Choice+ design is preferable given the lower cost of processing paper surveys and lack of evidence of bias in the estimates.
Declining response to surveys and changes in respondent behavior requires continual exploration and testing of designs that will engage participants and reduce burden without sacrificing the quality of the data collected. In longitudinal studies, respondent preferences may change over time, making it important to continue to evaluate the trade-offs of various approaches. Veterans were nearly 3 times more likely to respond by web in Wave 4 of this study than in the prior wave conducted in 2012. Some of this increase may be due to increasing comfort with using the internet that veterans have gained over the last decade, making web a more viable option.
Future research may benefit from exploring different elements of the sequential Choice+ design itself—for example, varying amounts for the web bonus and other incentives to determine the best balance of cost and response. Some surveys may be unable to include a paper option because of complex skip patterns or sensitive questions. Research should consider how a sequential Choice+ protocol could be used to increase response rates for multimodal surveys that include web and CATI but not paper. This additional research may allow researchers to determine which factors can be adjusted to best balance encouraging web participation and maintaining data quality with cost.
Corresponding author contact information
Erin K. Dursa, PhD, MPH
Erin.Dursa2@va.gov
810 Vermont Ave NW
Mailstop 12HOME
Washington, DC, 20420
where I = complete interview, P = partial interview, R = refusal and break-off, NC = non-contact, and O = other eligible nonresponse (AAPOR, 2023). RR6 assumed that all veterans who could not be contacted were eligible and includes partially completed questionnaires. For this study, questionnaires were considered complete if 80% or more of the questions were answered and partially complete if 50% to 79% of the questions were answered.
We repeated the comparison of survey estimates using final weights. The conclusions were the same and so are not presented here.