
Introduction
Survey response rates continue to decline, raising concerns about data quality and the effectiveness of traditional survey administration methods (Ali and Kauermann 2021; Peytchev and Peytcheva 2017). Longer surveys in particular are associated with higher breakoffs, satisficing behaviors, and nonresponse, threatening the validity of research findings (Toepoel and Lugtig 2018). In response, survey researchers have explored various methodological innovations.
Split Questionnaire Design (SQD) is one such approach that divides a full-length questionnaire into smaller modules, with each respondent completing only a subset of the total questions (Munger and Loyd 1988; Raghunathan and Grizzle 1995). Also referred to as between-respondent modularization, this survey data collection design distributes survey burden across participants. By shortening a survey and strategically assigning modules to different groups, researchers can reduce respondent time and cognitive burden while capturing broad content and enhancing response rates—especially in mobile and web-based contexts, where short surveys are perceived as more manageable (Toepoel and Lugtig 2018).
Survey participation challenges are pronounced in higher education survey research where widely used assessment instruments like the National Survey of Student Engagement (NSSE) can include more than 100 questions and capturing data from nonrespondents remains a persistent issue (Sarraf 2025). This article documents a multi-institution controlled experiment to evaluate SQD’s feasibility and effectiveness for targeting NSSE nonrespondents using a rebranded survey. Multiple factors motivated this investigation, including survey data quality concerns; pleas from respondents and participating institutions to minimize survey burden; and to better understand nonresponders’ curricular and co-curricular experiences during college. Study findings aim to inform best survey practices for colleges and universities that rely on student data for decision-making while contributing to broader efforts to improve survey data quality.
Prior Research
Though no published SQD studies that we know of have used a college student assessment survey, several suggest the approach may be effective for increasing participation rates and survey completion with this relatively young population. For example, Adigüzel and Wedel (2008) developed an optimization framework for SQD, applying the modified Fedorov algorithm to divide long surveys into modules with a goal of minimizing information loss. Importantly, their field experiment revealed that two variations of between-respondent SQDs shortened completion time by about 25% while reducing item nonresponse, and feelings of fatigue and boredom, suggesting that well-designed modularization can preserve data quality while lowering burden.
In applied contexts, modularization has also been linked to improved participation and response quality. In a commercial automobile tracking survey, Bansal et al. (2017) compared a 30-minute instrument with a five-block SQD. The modular approach lowered drop-off by 12.5%, cut poor-quality responses nearly in half, and reduced average completion time by over a third, while maintaining statistical accuracy above 90% after imputation. Similarly, Peytchev and Peytcheva (2017) experimentally evaluated survey length effects and found that long questionnaires produced six times more bias than modularized versions. In their study, split designs with multiple imputation yielded estimates closer to a gold-standard benchmark and reduced mean squared error by an order of magnitude, underscoring the analytic benefits of planned missing data designs.
More recent studies have advanced SQD methods by addressing the analytic challenges introduced by planned missing data. Lin et al. (2023) applied a two-stage SQD framework to the European Social Survey, introducing a block-weighted least squares estimator that reduced respondent burden and survey costs while still producing accurate estimates. Ali and Kauermann (2021) offered a complementary perspective by framing SQD as a statistical matching problem; through simulations and a real-world application, they demonstrated that valid inferences could be drawn without extensive imputation, highlighting SQD’s practicality in applied survey settings.
Together, these studies demonstrate that a modular survey design when thoughtfully implemented has the potential to reduce burden and sustain or enhance data quality, such as response rates. These findings provide a rationale for testing SQD in higher education settings where long instruments and nonresponse remain persistent challenges.
Research Questions
The following four research questions guided our investigation to better understand the impact of SQD with college student nonresponders to NSSE:
-
In the aggregate and across different institutions, how effective is SQD at getting college student nonresponders to complete surveys?
-
To what extent can SQD respondents enhance standard NSSE administration respondent counts and response rates for individual institutions?
-
What is the response rate effect for SQD surveys relative to the original longer survey, and does this effect vary by institution?
-
Controlling for student background and institutional context variables, what is the expected change in survey response probability by using SQD surveys for different types of students, such as first-year, full-time, or African-American students, relative to the longer survey?
Methods
Sample
To explore the impact of SQD, we appended our experiment to the standard NSSE 2023 spring administration, inviting 473 U.S. institutions to express interest, ultimately selecting only 20 of the 40 that expressed interest due to budgetary and operational constraints. These institutions varied by enrollment size, public-private control status, proportion of minoritized students, and Carnegie classification (4 Doctoral, 13 Master’s, and 3 Baccalaureate). Furthermore, given the experiment’s primary goal of identifying a new method to improve data quality, we oversampled institutions with lower historical response rates that could potentially benefit the most from participation; those selected had a 26% prior administration average response rate compared to 39% for those not selected. In total, the experiment’s sample included 62,621 college student nonrespondents, including about an equal proportion of first-year and senior students (48% and 52%, respectively) and 56% female. See additional demographic information for the experimental sample (disaggregated by survey completion status) and standard NSSE respondents in the appendix. The standard survey administration delivers five email invitations containing a survey link and institution-specific incentive messaging; the instrument includes 109 questions and typically takes 15 minutes to complete.
Experimental Design
We employed a randomized controlled experimental design to test SQD, whereby we randomly assigned an equal number of standard NSSE nonrespondents to one of six groups for each participating institution:
-
Treatment Groups. Five groups received a shortened version of the NSSE instrument, containing between 14 and 20 survey questions each. These short surveys included distinct sets of questions related to college student behaviors and perceptions about the undergraduate experience as well as a common set of background and demographic questions, such as academic major and parental education. See the appendix for further details regarding survey content.
-
Control Group. The control group received the full-length NSSE instrument with 109 questions.
Approximately two weeks after the final standard NSSE recruitment email delivery date for each institution, we invited nonrespondents to participate in a rebranded survey project, The College Student Report (TCSR). Recruitment emails for treatment groups emphasized survey brevity in both the subject line and body text. In contrast, recruitment emails for the control group avoided reference to survey duration to align with standard NSSE practice. Regardless of group assignment, experimental study participants received up to three recruitment emails.
Analysis
We combined results for the five short surveys and analyzed them together for estimating SQD respondent counts and response rates. Though variation exists between the short surveys in the aggregate and within individual institutions, this simplification best answers our research questions. In addition, we analyzed results by two class levels (first-year and senior) as this stratum is used for participating institution sampling and final report production. Since all sample members have a known eligibility status, we used AAPOR response rate 6. By using data originating from reliable campus Registrar Office sources, institutions provided population contact files that only included eligible first-year and senior students.
Note that calculations for the first and second research questions reflect a partially simulated respondent count assuming the control group had never been used. To calculate total respondent counts and associated response rates for each institution, we multiplied each institution’s control group sample size by its average response rate to the five short surveys (for first-year and senior populations separately) and then added this to the total short survey respondent count.
For the fourth research question, we relied on multilevel logistic regression models and Stata 19’s margins command to estimate the average marginal effect (AME) for various student characteristics, using a wide variety of controls such as student enrollment status, sex, and school size. An AME allows us to estimate the difference in response probability associated with being offered a short survey versus a longer one (Long and Freese 2014).
Results
Overall SQD Response Outcomes (RQ1)
In the aggregate, our SQD experiment yielded 2,170 respondents, representing a 3.5% overall response rate. This count included 943 first-year students and 1,227 seniors for a 3.1% and 3.8% response rate, respectively. Using institutions as the unit of analysis, the experiment yielded, on average, 47 and 61 first-year and senior respondents, and a 3.8 and 4.6 response rate, respectively. In terms of minimum and maximum institution results, we found institutions with respondent counts as low as 4 and as high as 168, corresponding to an institution response rate range of 1% to 9%.
Supplementing Standard NSSE Institution Counts and Response Rates (RQ2)
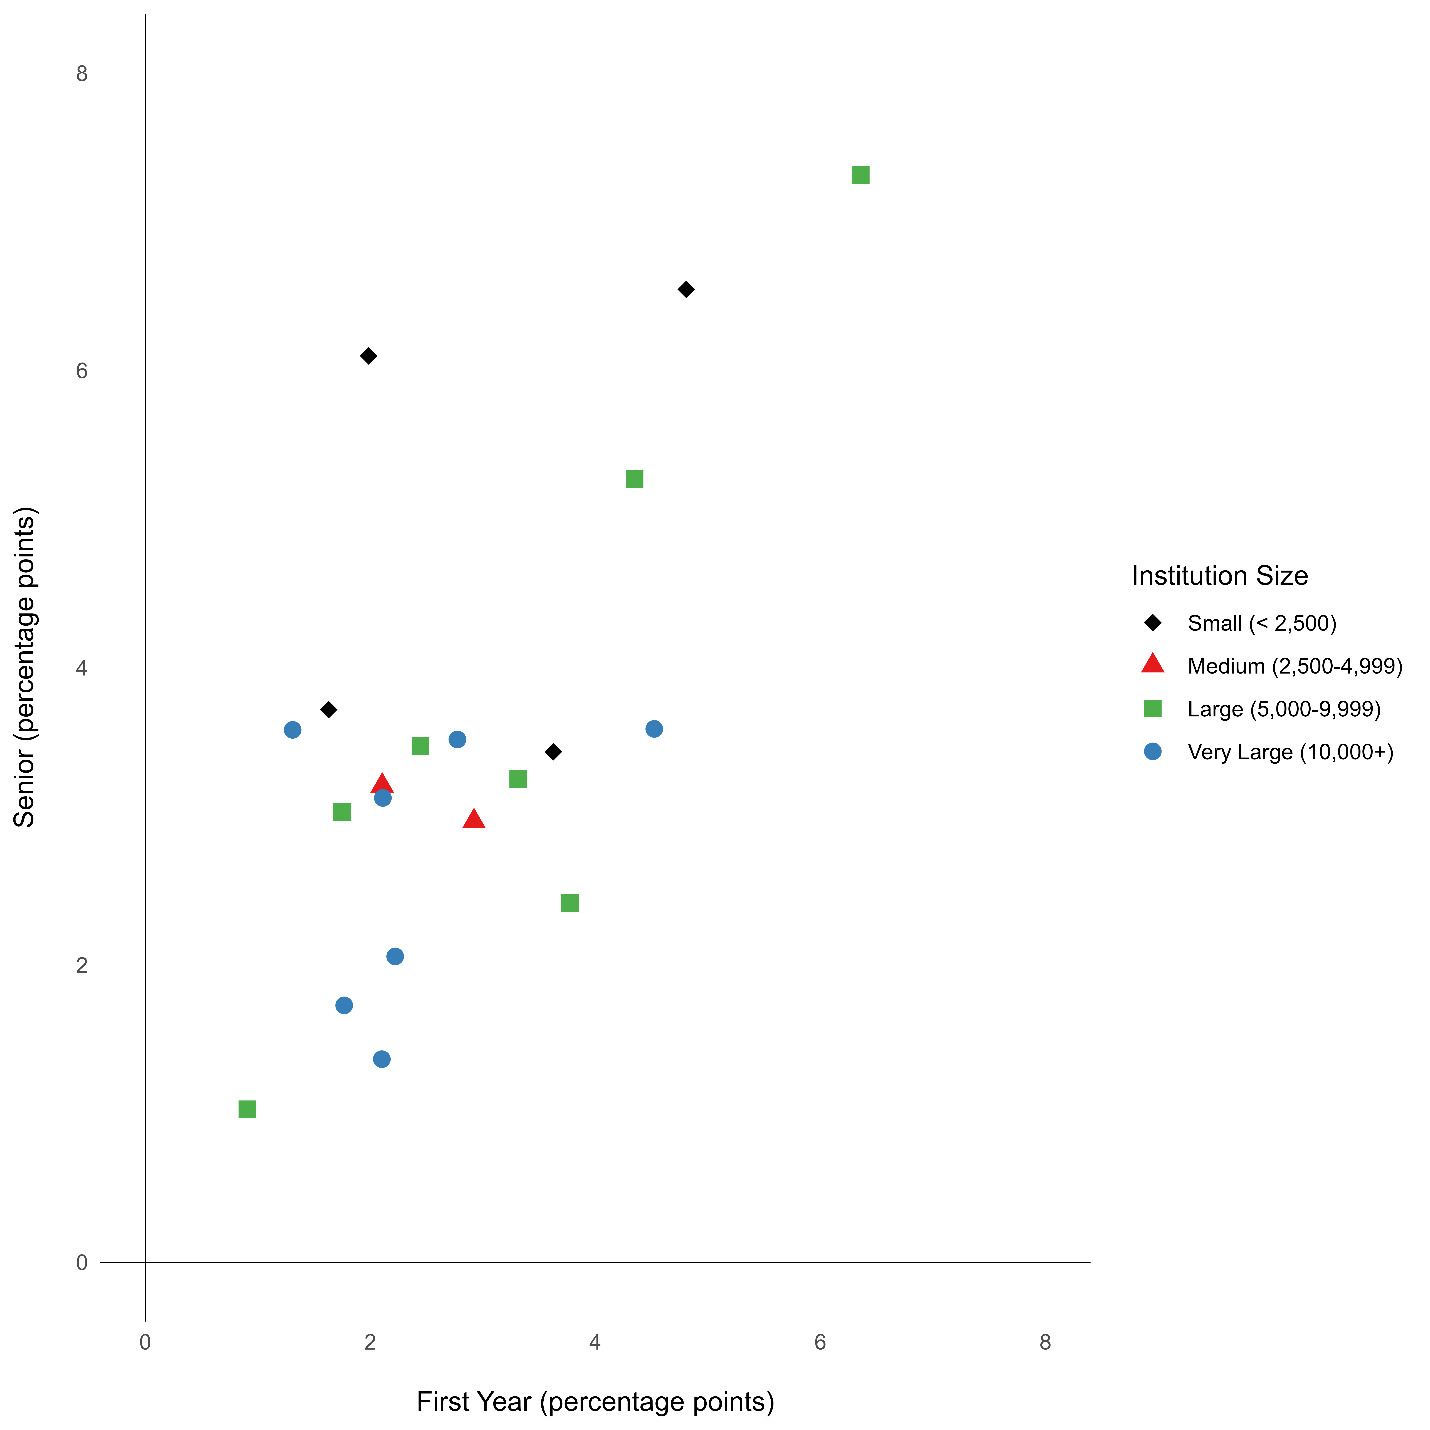
Collecting TCSR responses offered an opportunity for institutions to increase the size of their NSSE dataset. On average, by including additional responses, institutions would increase their first-year and senior raw counts by 15.2% and 19.2%, increasing institutional response rates by 2.8 and 3.5 percentage points, respectively. As with other aspects of this study, institutional variation exists. Institutions increased their first-year and senior counts by as little as 4 or 5 percentage points and as high as 40. Response rate increases ranged from about 1 to 7 percentage points for both class levels (see Figure 1).
.png)
Short Survey Effect on Response (RQ3)
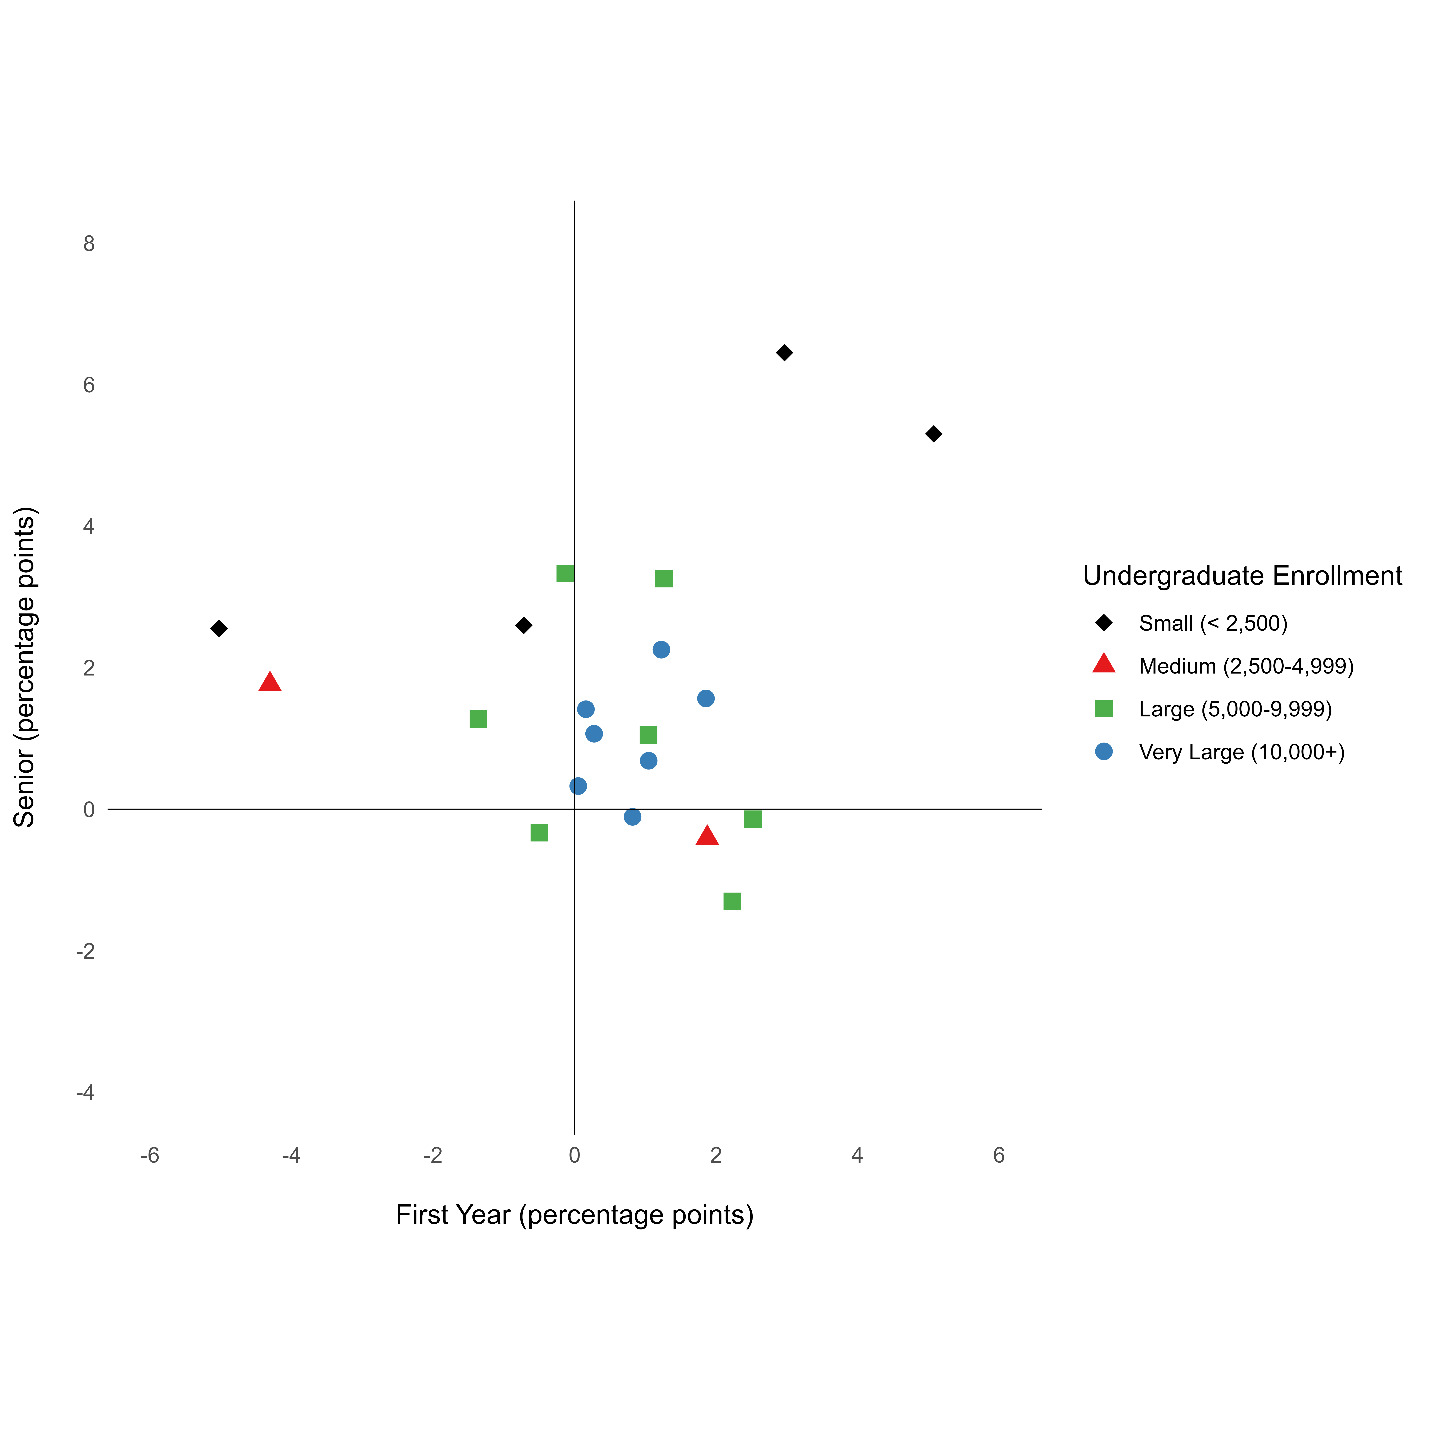
Short surveys demonstrated a modest advantage over the long survey in terms of eliciting response. While the short survey resulted in an institution average response rate of 3.8% and 4.6% for first-year and seniors, the long survey resulted in a 3.3% and 3.0% response rate, respectively. Consequently, the average institutional response rate effect (short minus long survey response rate per institution) is estimated to be 0.5 percentage points for first-year students and 1.6 percentage points for seniors. These effects vary by institution and class level, however, particularly among first-year populations at small and medium sized colleges (see Figure 2). The minimum and maximum effect for institutions’ first-year and senior populations ranged from -5.0 to 5.1 and -1.3 and 6.4 percentage points, respectively.
.png)
Short Survey Effect by Student Characteristics (RQ4)
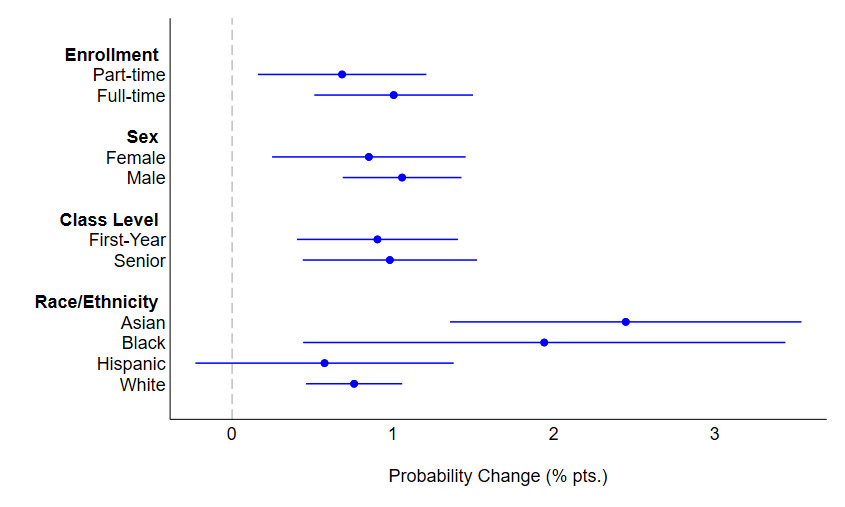
We estimated the short survey’s average marginal effect (AME) for different student characteristics, providing the change in survey response probability associated with using a short survey relative to a long one. These characteristics included enrollment status, sex, class level, and select race/ethnicity categories. As shown in Figure 3, results for all enrollment, sex, and class categories had about a 1 percentage point statistically significant AME (p < 0.05). The AME for Asian (2.4 percentage points), Black (1.9) and White (0.8) respondents varied more and were also found to be statistically significant (p < 0.05). In contrast, we did not find the Hispanic AME to be statistically significant. Additional testing indicated no statistically significant differences between categories within enrollment status, sex, and class level characteristics. For race/ethnicity groups, however, the Asian AME was greater than the one for Hispanic (p < 0.001) and White (p < 0.01) students; we identified no other statistically significant difference between race/ethnicity groups.
Discussion
Using a randomized controlled experiment across a diverse multi-institution sample of college students in the United States, this study found that SQD short surveys produced modest but operationally significant increases in response rates for some participating institutions’ hard-to-reach nonrespondent populations. These findings align with prior research showing that minimizing respondent burden can improve participation (Bansal et al. 2017; Toepoel and Lugtig 2018).
Shortened NSSE survey versions generated higher response rates than the long version, particularly among senior populations. While the average institutional advantage of 0.5 and 1.6 percentage points for first-year and senior students, respectively, may seem modest, they have the potential of yielding hundreds of additional responses at scale for NSSE, potentially enhancing the reliability of subgroup analyses and better informing strategic decision-making by institutional leaders. These benefits were not consistent across all campuses though, with some even seeing more minimal gains, reinforcing the need to tailor SQD strategies to specific contexts and populations (Toepoel and Lugtig 2018). Our modest results are not entirely surprising given the fact that other research shows announced short surveys do not always result in response rate improvements (Lugtig 2021; Mavletova, Deviatko, and Maloshonok 2014).
From the perspective of maximizing student participation in NSSE (albeit under a different project name), SQD offers other practical benefits. By merging The College Student Report respondents with standard NSSE administration respondents, institutions could increase their raw respondent counts by 15% to 19% on average, effectively boosting first-year and senior response rates by 2.8 and 3.5 percentage points. For institutions of any size, these increases can enhance statistical power as well as help to better inform campus policies and accreditation efforts.
Subgroup analyses further highlight SQD’s promise. Despite the absence of an effect for Hispanic students, statistically significant increases in response probability were observed among Asian and Black students, suggesting that shorter surveys may reduce the perceived burden and psychological barriers for some underrepresented groups.
Other preliminary analyses suggest that despite the higher response rates from using a shorter survey with nonrespondents, the longer survey version yields a greater number of individual item completions in the aggregate. Thus, participating institutions must weigh the benefit of broader participation against the cost of reduced aggregate item completion (Peytchev and Peytcheva 2017; Toepoel and Lugtig 2018). To mitigate the loss of information, studies have shown missing data handling techniques such as multiple imputation by chained equations to be effective (Axenfeld et al. 2022). Although we did not evaluate the accuracy of imputed data in this study, doing so remains an important direction for future research.
One notable limitation of our experiment relates to the rebranding of our NSSE outreach efforts as The College Student Report. Although we believed the rebranding would lead to better overall participation among nonrespondents regardless of survey length, we introduced a potential confounding experimental factor that may have independently contributed to overall response rates reported under our first research question, most likely increasing student response. While this rebranding may have influenced overall nonresponder participation in the experiment, it was applied uniformly to both experimental and control conditions. As such, it does not confound our results comparing short- and long-survey versions. Future research might examine the independent role of rebranding a survey on a nonrespondent population’s survey participation, particularly if such changes are integrated into NSSE’s long term communication strategy.
Though its benefits are modest and context-dependent, when thoughtfully implemented, SQD can bolster NSSE aggregate and institution specific data quality. Similar large-scale multi-institution survey projects adopting such a data collection approach should view it as one component within a broader strategy of maximizing college student participation while integrating inclusive outreach, thoughtful modularization, and, potentially, modern missing data handling applications. By demonstrating SQD’s value in a multi-institutional context, this study contributes to a growing body of evidence that modular survey designs can help address the long-standing challenge of declining participation in higher education surveys.
Corresponding author contact information
Shimon Sarraf, Asst. Director for Survey Operations, National Survey of Student Engagement, Indiana University School of Education, 201 N. Rose Ave., Bloomington, IN 47405
Email: ssarraf@iu.edu