
Introduction
Several Census Bureau household surveys, such as the Current Population Survey (CPS), Annual Social and Economic Supplement (ASEC) of the CPS, and Survey of Income and Program Participation (SIPP) are introducing web-based data collections to complement their existing interviewer-administered modes (Bennett and Fields 2024; Cheok and Shin 2024; Linse 2024). As practitioners develop the new web questionnaires, decisions must be made concerning respondent burden, specifically, whether combining certain CAPI questions to reduce the number of screens results in quicker survey completion times in web. As time spent answering a single survey question varies by the question’s complexity and hence, the cognitive burden placed on the respondent (Bassili and Scott 1996), time may not be saved in some circumstances. Qualitative testing can help identify questions that require more thought or elicit confusion, but a controlled experiment could help quantify the effect. The test below was designed to determine if the completion time of a condensed question is significantly faster than a comparable, but less cognitively burdensome, decomposed question with two parts.
Background
The literature on question decomposition is sparse with nothing specifically on response times. The little available focuses on decomposing a global question, asking for a summed frequency, into a series of questions providing more specific prompts to address underreporting (e.g., Belli et al. 2000; Mooney and Gramling 1991). Schaeffer and Dykema (2011) explain that decomposition encompasses a wide array of formats, beyond this common format. One of these involves issuing a filter question to determine eligibility before asking a frequency question. The research below aligns with this classification.
The literature on decomposition was produced at a time when interviewer-administration was the norm. With interviewers present, concerns of respondent engagement, speed of completion, and reduction of burden are not prioritized. However, with the increased use of self-administered web questionnaires and ubiquity of online panels, these features have been brought to the forefront to mitigate item missing data and breakoff (e.g., Engstrom and Sinibaldi 2024; Crawford et al. 2001; Galesic 2006; Leipold et al. 2024). Literature on response times in web surveys supports the common wisdom that questions with higher cognitive burden take longer (Callegaro et al. 2009; Yan and Tourangeau 2008). Applying this to decomposed questions is not straightforward though, in terms of how the speed of more but easier questions would compare to a single more complicated question. The research below aims to answer that question and strengthen the literature on the qualities of decomposed questions.
In the experiment, the “condensed” survey question captures response(s) in a single grid and asks for data that could reasonably be collected by two separate survey questions. Its comparable “decomposed” version has two simpler questions that must be combined during analysis to determine the same information. The experiment captures the time per question, with the time summed across the two questions for the decomposed version. The comparison of the question times and multivariate analyses exploring what factors contributed to longer or shorter times, evaluate whether more screens take more time, even when the questions are simpler to answer.
Data
The experiment was hosted on a web survey of Census Bureau Research Panel members. These 30,000 panel members were respondents to Phase 4.2 of the Census Household Pulse survey (HPS), administered from July to September 2024, who agreed to be contacted about future research opportunities. The web survey was open from 3-15 December 2024 and available in English only. The survey asked about demographics, household composition, carrying and spending cash, preferences for incentive payment method, cost for utilities, and the questions in this experiment. It took approximately 15 minutes. No incentive was offered. Two reminders were sent, beyond the initial email invitation, resulting in approximately 10,000 responses and 500 bounce backs (assumed eligible), for an AAPOR RR2 of 33%.
Respondents had to report having children under 18 years old living with them to be eligible for the experiment. This resulted in an analytic sample of 2,000 cases, randomly assigned to one of the two versions of the experimental question.
Questions in the experiment
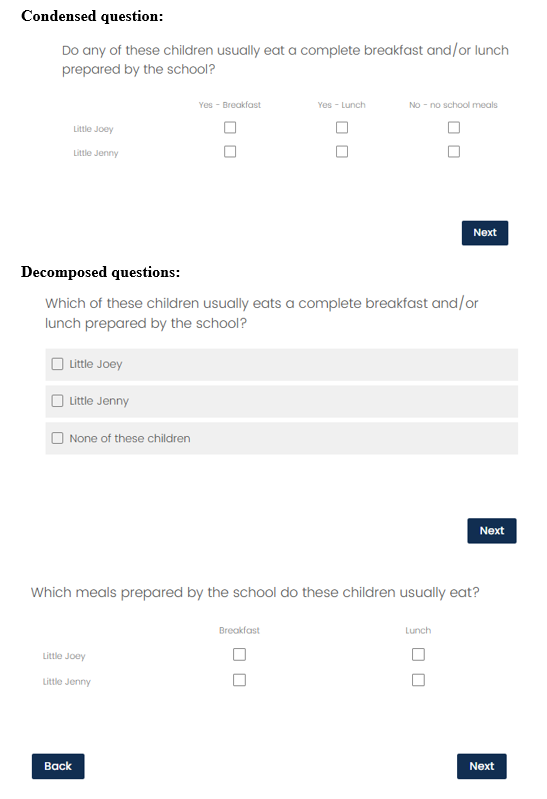
The questions in the experiment asked which school-provided meals the children in the household routinely ate. Respondents were randomly assigned to only one version—condensed (Group C) or decomposed (Group D). The condensed question asked this as a grid listing all children in the household and checkboxes for each meal (breakfast and lunch) and no meals (see Figure 1). This question mirrored the format of a condensed question tested in the first round of cognitive testing of the ASEC web-based questionnaire. The decomposed version of the question asked which children usually ate school-provided meals, with an option for “none”, and then followed up with a simpler grid including only the relevant children and the two meals (see Figure 1). If no children ate school-provided meals, the second question was not shown. The grids for both questions appeared the same on computers and mobile phones, and hence, were not reformatted for smaller screens.
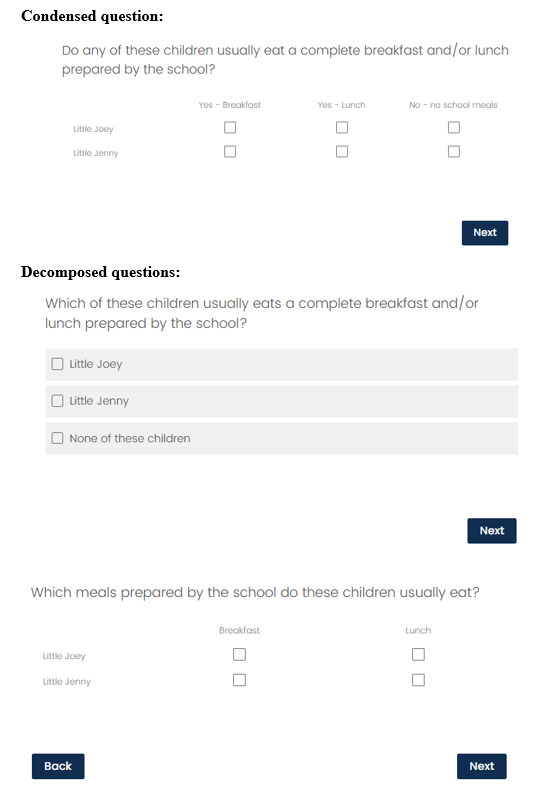
For respondents with only one child, the question wording was slightly different for both the condensed and decomposed versions. Both versions read: “Does [child’s name] usually eat a complete breakfast and /or lunch prepared by the school?” The condensed version was followed by the same four-column grid as for multiple children (but with one row only). The decomposed version of the question was followed by radio buttons for Yes and No (instead of the multiple response list of all the children). The follow-up question showed the grid with checkboxes for breakfast and lunch in a single row.
While the questionnaire did not collect a household roster, parents were asked how many children under 18 lived in the household and then asked to provide initials or nicknames for up to five children. These abbreviations were used as fills in the grids and response options for the questions about school-provided meals.
Dependent variable
Of the 1,000 cases who received the condensed question, 0.2% broke off or skipped the question. These were all households with more than one child, and therefore were presented with a grid with multiple rows. Of the 1,000 cases who received the decomposed version, 1.4% broke off or skipped one of the two questions. Less than half of these (0.6%) resulted on the first question in the series. The missing data for either the condensed or decomposed version of the question is very small (less than 15 cases). With a less engaged sample (these were respondents to a previous data collection), there could be higher rates of breakoff and item missing data.
To compare response times for the two versions of the question, “page submit” times were recorded from the Qualtrics instrument. “Page submit” measures the total amount of time, in seconds, the respondent spent on a page or screen. The instrument displayed one question per screen. All time estimates were trimmed at the 95th percentile to omit the influence of extremely high values. Short times were considered valid and not trimmed. Trimmed times were summed to generate a total time for the decomposed question. Respondents who broke off or skipped the experimental questions were omitted from the analysis. The model included an indicator for the cases that were trimmed.
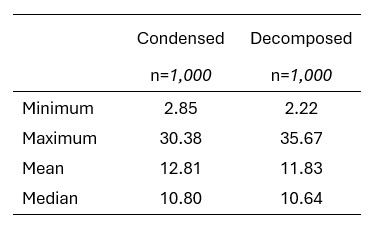
The distributions of the response times for each question version, after trimming large values, are shown in Table 1. In Group C, 4.9% of cases were trimmed. Of these, 73% had times under 60 seconds and 94% had times below two minutes. Times were trimmed to a maximum of 30.38 seconds. Across the two questions in the decomposed version (Group D), 6.2% of the cases were trimmed. Of the 50 cases trimmed for the first question, 82% had times under 60 seconds and 92% were under two minutes. Times were trimmed to a maximum of 19.73 seconds. For the second question in the decomposed version, 20 cases were trimmed (10 of these cases also had long response times for the first question and were trimmed). Of these, 87% had times under 60 seconds and 96% were under two minutes. Times were trimmed to 15.94 seconds.
_for_each_version_of_the_question_after_trimming.png)
Covariates
Other survey questions in the multivariate analysis included the sex, education, device used to answer the survey, and number of children in the household. Respondents’ highest level of education was recoded into an indicator for having graduated college or not. Device type was self-reported as “phone”, “laptop or desktop computer”, or “tablet”. Missing data for device type were imputed using paradata that captured the operating system, indicating phones, tablets, and computers.
The analysis controlled for the number of children who could have eaten school meals. Respondents reported having up to nine children under 18 in the household but the school meals question asked about no more than five children, using the up to five nicknames provided in an earlier question. Therefore, the <15 cases with more than five children (approximately evenly split across the two question versions) were recoded as “5”, and the variable is interpreted as the number of children asked about in the school meals questions. For the condensed question, this number corresponds to the number of rows shown in the grid. For the decomposed question, it corresponds to the number of response options in the first survey question in the series. The number of children was also recoded into an indicator for one-child households.
Supplementary analysis examined the effect of reporting no school-provided meals for any children versus at least one child eating at least one meal. This variable was recoded from the responses to the condensed question and the first decomposed question only.
Methods
Chi square tests of independence were used to evaluate differences in demographics between the two question versions, and independent samples t-tests were used to compare the mean response times overall and for subgroups. Differences in the response times were modeled first with a reduced regression model and then four multiple regression models. In the reduced model, question type was the only covariate used to predict response time. The full models incorporated controls for the respondents’ level of education, sex, device type, number of children included in the question, and an indicator of trimmed timing data. There are two versions of the full model that vary how the number of children is treated—as a continuous count or a dichotomous variable for one-child households. The model with the indicator for one child is used to explore interaction effects between: the experimental group and the indicator for one child in the household, and the experimental group and the indicator for no children eating any school-provided meals.
Results
There were 2,000 respondents who had children and answered all of the questions in the version of the question to which they were assigned. The cases were evenly split between the condensed (49.1%) and decomposed (50.9%) versions. Within each version, a similar proportion of respondents reported having only one child in the household (44.8% in Group C; 41.4% in Group D). In addition, there were no significant differences between the groups in the distribution of sex, college graduates, and device used.
Evaluating the mean times, the decomposed version of the school meals question took significantly less time to complete than the condensed version: 11.83 vs. 12.81 seconds (t(2,000) = 3.32; p < 0.001). Despite the decomposed question containing two parts, respondents completed this question, on average, one second faster than the condensed, single question.
The speed of the decomposed question was also evident in the regression analyses of the reduced and full models showing only main effects. Before introducing the indicator for no meals selected (see Table 2, Models 1-3), respondents to the decomposed version were roughly one second faster to respond compared to those who answered the condensed question (e.g., β = -1.29; p < 0.001 for the full model with an indicator for only one child under 18 (Model 3)), on average, even after controlling for other characteristics.

Models 2 and 3 also show that having more children to answer for lengthened the time to answer, with each child taking, on average, 1.8 seconds longer (see Table 2, Model 2), controlling for other factors. College graduates, those completing the survey on a computer or tablet, and respondents reporting for only one child all had significantly faster response times. An interaction between the experimental group and the indicator for one child was not significant (not shown).
Half (50.6%) of the respondents who answered the decomposed version had children who did not eat a school-provided meal, and therefore, did not receive the second question in the series. These respondents were still included in the analysis since they did not break off or skip questions, and they are comparable to the Group C respondents who also had children who did not eat any school-provided meals (40.3%). With only one non-grid question to answer, a short response time is expected for these cases and that may be driving the shorter overall response times for the decomposition version. To explore this, supplemental analyses were conducted to see how much more quickly respondents answered the decomposed version when no children ate school meals.
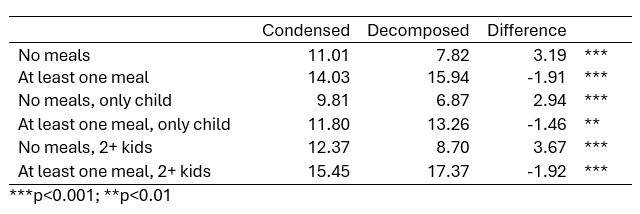
Table 3 shows mean response times for households with single or multiple children, by whether at least one child ate at least one school meal or no children at any school meals. Consistently, the decomposed version is significantly faster when no children ate any school meals, and significantly slower when at least one child eats one meal. However, the time saved when no meals are eaten is greater than the extra time needed to answer the second question in the decomposed version. E.g., in households with at least two children, the decomposed version is 3.7 seconds faster, on average, if no children eat school meals, compared to being 1.9 seconds slower if at least one child eats a school meal.
_for_different_household_sizes_and_whether_a_school-pr.png)
When a variable indicating that none of the children ate any school-provided meals was added to the model, it was strongly significant (see Table 2, Model 4). The coefficient indicates that, on average and controlling for other factors, respondents with no children who ate school-provided meals answered the question nearly five seconds faster (β = -4.69; p <0.001). Overall, the decomposed version is still faster than the condensed, controlling for other factors, but the difference is reduced to -0.8 seconds. So, answering only the first decomposed question explains some of the efficiency of the decomposed version but not all. Other notable results of Model 4 are the increased adjusted R2 and the significance of sex, showing that males take more time to answer than females, on average, controlling for other factors.
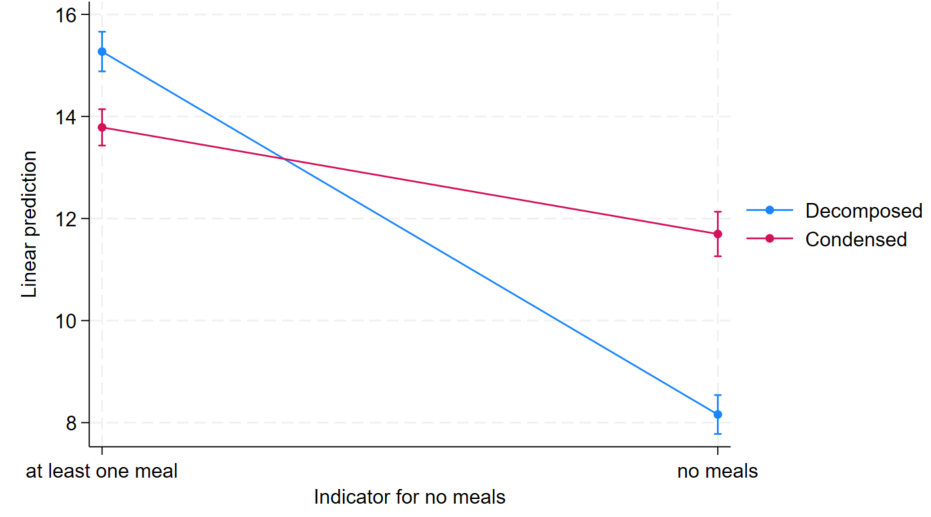
Model 5 (see Table 2) introduces a significant interaction effect between the version of the question and the indicator for no meals selected. This model and the corresponding plot of the interaction (see Figure 2) show that, when at least one meal is selected, the decomposed version takes 1.5 seconds longer, on average. However, if no meals are selected, the decomposed version is 3.5 seconds faster to complete, more than accounting for the time lost if at least one meal is selected. The difference in these times seems to drive the overall faster completion time of the decomposed version and illustrates that the simpler questions can be answered quickly.

Conclusions
Several factors seem to influence how quickly a respondent completed the factual questions about school meals. Being on a computer, having a college degree, having only one child for whom to answer, and reporting that no children ate school-provided meals all significantly decreased the time to answer either version. Taken together, the decomposed version had faster response times but that seemed to be moderated by the number of respondents who reported that no children ate school-provided meals. In this situation (where no children ate school meals), the decomposed version, with its single radio button question, was significantly faster than the condensed version, with the grid.
The grid used in the condensed version takes time to comprehend and is more cognitively burdensome than the first question in the decomposed version. In addition to navigating the format, simplification of the wording of the question stem and grid’s column headings could make the condensed question easier to comprehend and faster to complete. Given these features, even when no child eats any school meals, there is a minimum time investment to understand both the question and the grid. The interaction effect allows for a rough quantitative measure of this extra time to comprehend the grid over a non-grid question: 3.5 seconds. That is, if a respondent receives only the first question in the decomposed version (a non-grid question), their response times are 3.5 seconds faster, on average, than a respondent reporting no meals in the condensed question (a grid), controlling for other factors.
This saved time is larger than the time difference between the two versions when at least one child eats at least one school meal; the condensed version is 1.5 seconds faster, on average, which is only half the time savings observed for the decomposed question (3.5 seconds). The success of the decomposed question is an artifact of the distribution in the data. If most of the children in both groups had eaten school meals, the decomposed version may not be significantly faster overall.
In addition to the results of the timing analysis, the decomposed question is more respectful to the respondent’s burden in other ways. Not only is the grid in the follow-up question easier to comprehend, the respondent also spends less time on each page compared to the single page of the condensed version. Being able to advance to the next question quickly contributes to a perceived sense of moving quickly through the questionnaire; that is, perceived time to complete the questions may feel faster than the actual seconds. For self-administered surveys, this keeps respondents engaged and prevents breakoffs. Prioritizing perceived time in question design may be more important than the actual time.
The decomposed version of the lunch question is still a grid, and it could have been decomposed even further, resulting in three (or more) questions in total. Given the time to read the additional question(s) and advance to the next screen(s), a more decomposed lunch question would probably not be more efficient than the condensed version. In addition, given the simplicity of the topic (school meals) and the limited number of response options (essentially a Yes/No for two meals), it seems unnecessary to decompose the question further. Depending on how different respondents prefer to recall this information (i.e., focusing on the child or the meal), they either need to see both meals on the screen for the child they are thinking about, or all children listed for a particular meal. The format tested provides the desired cross-section for both preferences. Separating either the children or the meals into additional questions would cause additional cognitive burden, undermining the goal of decomposing the question. Furthermore, separately asking about breakfast and lunch may introduce a confusing repetitiveness which could lead to measurement error or breakoff. While this experiment did not test this type of further decomposed question, even without empirical evidence, I caution against excessive question decomposition.
The value of this analysis is not the outcome for this single decomposed question—saving one second on one question is fairly insignificant compared to the overall time to complete the survey. However, design decisions throughout a self-administered survey, balancing burden and timing, are additive, thereby potentially resulting in significant time savings. In addition, decisions about a single question must be considered in the context of the whole questionnaire. E.g., if the same type of question is asked repeatedly, a series of condensed questions may be more efficient, with the respondent exerting extra time to learn the format on the first question and then moving more quickly through the similar questions. Overall, the goal is to provide questions respondents can answer easily on their own and keep burden, both in terms of time and cognition, to a minimum.
Corresponding author contact information
Jennifer Sinibaldi
US Census Bureau
4600 Silver Hill Road
Washington, DC 20233
Jennifer.sinibaldi@census.gov
Disclaimer
Any views expressed on the methodological issues are those of the authors and not necessarily those of the U.S. Census Bureau. The paper has been reviewed for disclosure avoidance and approved under CBDRB-FY25-CBSM003-011. Sample sizes and counts in both the text and tables are rounded, per Census Bureau disclosure rules. Rounded values are italicized.