.tiff)
Introduction
Over the past two decades, digital data collection has become one of the most popular approaches in the health sciences, with widespread adoption throughout public health and clinical care (Forkus et al. 2023; Naumova 2025; Wazny 2018). Online surveys allow researchers to assess individual health outcomes and generate population-level insights through structured data collection. The use of pay-for data collection or crowdsourcing platforms, has surged in recent years, with the COVID-19 pandemic acting as a catalyst (Hensen et al. 2021; Hlatshwako et al. 2021; Torrejón-Guirado et al. 2024). This rapid expansion, reflected in a 2024 market valuation exceeding $3.9 billion (The Business Research Company 2026), highlights the growing demand and distinct advantages these platforms offer including efficient, large-scale data collection and improved access to specific and hard-to-reach sub-populations (Ball 2019; Dupuis et al. 2022; Walker et al. 2023).
A valuable application of crowdsourcing platforms in health science research is the collection of patient-reported outcomes (Khan et al. 2022), standardized measures that reflect individuals’ experiences across the continuum of care (Davidson et al. 2020; Martin et al. 2005). These platforms offer an efficient way to gather patient-reported outcomes data from diverse, global populations, especially when other sampling methods are impractical. However, concerns remain about the quality of data collected through these services and the integrity of the conclusions drawn from the data (Douglas et al. 2023; Newman et al. 2021; Peer et al. 2022; Torrejón-Guirado et al. 2024).
While crowdsourcing platforms have made data collection more accessible, new challenges necessitate stronger data quality control and assessment standards. The growing presence of malicious programs, such as survey “bots” and automated form-fillers, poses a significant threat to data integrity (Guy et al. 2024; Marshall et al. 2023; Storozuk et al. 2020). The prevalence of fraudulent and inattentive respondents, whose low-quality input often evades standard screening, raises concern that, in some cases, the drawbacks of crowdsourcing platforms may outweigh the benefits (Dupuis et al. 2022; Lebrun et al. 2024). Recent federal indictments exposed large-scale fraud schemes in which individuals were paid to impersonate legitimate survey takers, using virtual private networks and coordinated deception to fabricate survey data for market research firms (U.S. Attorney’s Office, District of New Hampshire 2025). Although these threats are increasingly acknowledged, clarity is lacking on how data quality varies across platforms, which differ in user interface, recruitment strategies, and built-in quality control mechanisms. Systematic evaluations are needed to compare platforms and guide selection of tools best suited for high-quality survey data in health research, where reliable data are critical for evaluating treatment outcomes and informing clinical decisions. The purpose of this study was to systematically assess data quality across the three leading pay-for data collection platforms using a variety of rigorous data quality checks embedded within a health survey focused on physical function and activity level.
Methods
Data Collection
A custom online survey was developed and administered using three pay-for data collection crowdsourcing platforms, including SurveyMonkey, Qualtrics, and Amazon Mechanical Turk (MTurk), to collect responses from individuals in the United States (U.S.) general population. The applied purpose of this work was to document psychometric properties and establish normative values for a recently developed orthopaedic outcomes instrument, the Foot and Ankle Activity Level Scale (FAALS; Matheny et al. 2025). Although the survey content focused on physical function and activity level for that applied component, the study reported here is the embedded methodological portion. In this methodological study, we used a consistent survey across platforms to evaluate and compare data quality through systematic quality control checks. Data were collected using demographic quotas, including age, race, sex, educational level, income, and geographic location to improve external validity by improving representation of the U.S. population, according to the U.S. Census Bureau (2020). This study was approved by an institutional review board, and all respondents provided informed consent to participate in the study and complete the survey.
Recruitment
Recruitment and data collection procedures varied by platform. SurveyMonkey and Qualtrics managed participant recruitment, survey distribution, and compensation through their proprietary systems. In contrast, MTurk provided access to participant panels but required researchers to independently deploy the survey, monitor response progress, and issue compensation. A full-length questionnaire was designed separately within both Qualtrics and SurveyMonkey platforms and distributed through each platform’s recruitment system. For MTurk participants, the same Qualtrics questionnaire was shared with the MTurk sampling panel, and respondents were required to record a randomized code upon survey completion to ensure accurate linkage and delivery of incentive payments. The goal was to collect 1,500 survey responses (500 per crowdsourcing platform) deemed “good-quality”.
Survey Instrument
The survey included 80 questions for SurveyMonkey and 95 questions for Qualtrics and MTurk. For SurveyMonkey, an 80-question limit required combining race and ethnicity items and removing several open-ended and demographic questions. The 80-item version included a consent question; four demographic items; seven questions on anthropometric characteristics and prior knee or ankle injuries or surgeries; four randomly placed attention verification questions (AVQs), the 22-item Foot and Ankle Activity Level Scale (FAALS) (Matheny 2021; Matheny et al. 2025), and four widely used patient-reported outcome measures: the 21-item Foot and Ankle Ability Measure (FAAM) Activities of Daily Living (ADL) and 8-item FAAM-Sport subscales (Martin et al. 2005), the single-item Tegner Activity Level Scale (Tegner and Lysholm 1985; Tegner et al. 1986; 1988), and the 12-item Short Form (SF-12) Health Survey (Ware et al. 1996). The use of AVQs as a quality control measure is well documented and has been previously shown to identify poor-quality responses (Agans et al. 2023; Douglas et al. 2023; Liu and Wronski 2018; Newman et al. 2021). All questions, except for the final open-ended question, which asked participants for any further comments, were required for survey progression. The 95-item version (Qualtrics and MTurk) included three additional demographic questions, five supplemental questions on anthropometric and injury history, and seven questions on honesty and demographic verification. A “think aloud” protocol was implemented during survey development to ensure item clarity and interpretability among members of the target population (Fonteyn et al. 1993). As suggested by Eysenbach (2004), a table documenting all aspects of our online data collection was included (Appendix 2).
Data Quality Assessment
To evaluate accuracy and honesty in responses, data from each platform were analyzed using 20 quality assessments (i.e. checks) (**Appendix 1**). Not all checks were applied on every platform: 19 were used in SurveyMonkey, 20 in Qualtrics, and 20 in MTurk. The checks fell into five categories: (1) Attention Verification Question Checks requiring a specific response (e.g., “please select Moderate Difficulty”); (2) Demographic Checks to ensure consistency within or against platform-collected internal data (e.g., state and zip code match); (3) Logic Checks to flag illogical answers across items (e.g., rating a half marathon as easier than walking on uneven ground); (4) Honesty-Reliability Checks to detect fraudulent or implausible data, including unrealistic body mass index (BMI) values under 8.5 (Suszko et al. 2022) or over 205 (Public Health Nigeria 2022) and survey speeders (completion time less than half the platform-specific median, per Qualtrics guidance); and (5) Open-Ended Question Checks to screen open-ended responses for irrelevant or duplicate content (only available in Qualtrics and MTurk). Responses failing any quality checks were rejected and classified as “poor-quality data.”
Survey Pilot Testing
During the pilot survey, issues were identified with duplicate responses, unrealistic height and weight values, and participation by non-U.S. residents, which contributed to differences between the 80- and 95-question versions since SurveyMonkey had an 80-item limit. To address these problems, we added open-ended items to detect duplicates, a BMI check for plausible values, a country-of-residence item, and two demographic verification questions, while also enabling built-in fraud and bot detection in Qualtrics and MTurk. Because MTurk offers minimal concrete guidance on appropriate incentive structures (Amazon Mechanical Turk, n.d.), compensation decisions were informed by limited guidance in the literature and aimed to meet or exceed U.S. minimum wage ($7.25/hour), with a target of approximately $10/hour based on median completion time estimates (Saravanos et al. 2021). Pilot studies were used to estimate completion times and refine incentives. Initial testing started with a $0.10 payment for screening completion and a $1.20 payment for completion of the full survey. Based on pilot results, incentives were adjusted to a $0.05 payment for screening completion and a $1.45 payment for attentive completion of the full survey, for a total possible payment of $1.50. This structure was intended to provide reasonable compensation while discouraging low-effort responding.
Statistical Methods
Descriptive statistics, including means, medians, ranges, and percentages were calculated. Interrater reliability was calculated to assess researcher agreement for manual open-ended question rejections, which were also compared to the automated rejection method using a minimum 80% similarity threshold between open-ended question responses (McHugh 2012). A contingency table was created of good- versus poor-quality responses from the three different platforms, and a chi-square test was used to compare the proportion of good-quality data across service platforms. Pairwise post hoc tests were adjusted for multiple comparisons. Statistical analyses were performed in R version 4.2.2 (R Core Team 2022) and in SAS version 9.4 (SAS Institute Inc. 2023).
Results
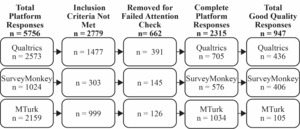
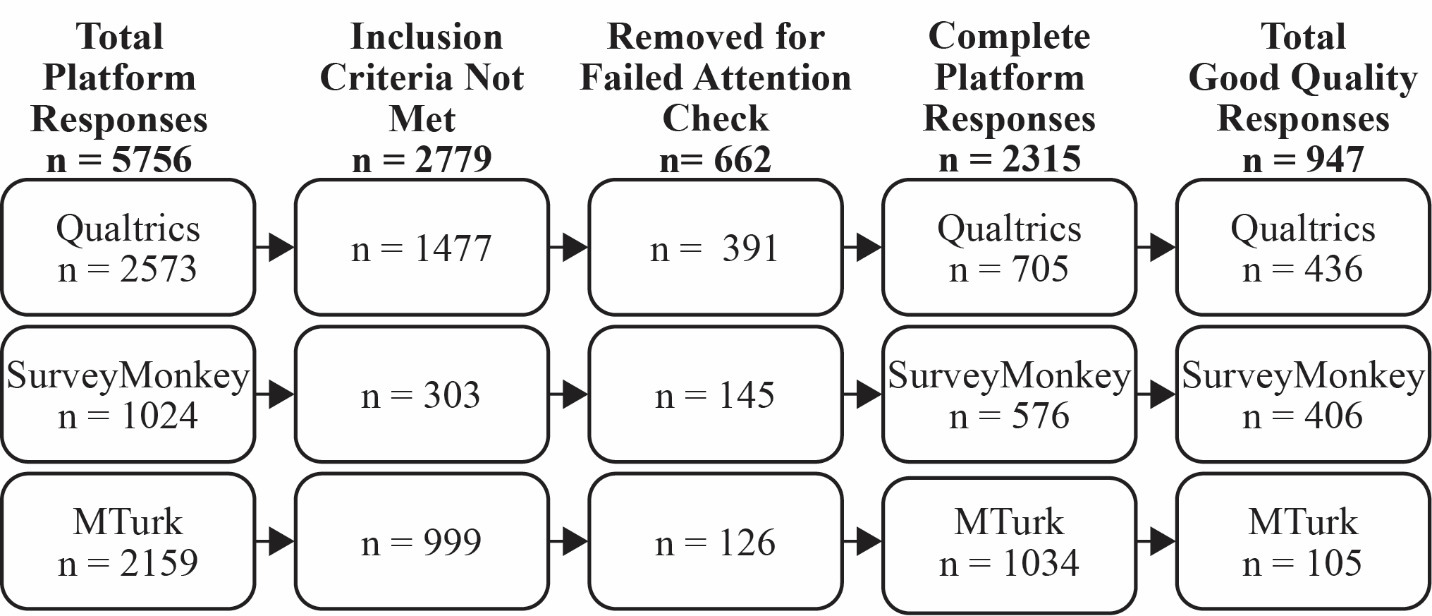
Across all three platforms, a total of 5,756 responses were recorded. Of these, 2,977 respondents met the inclusion criteria and initiated the survey. Of the 2,977, 662 cases were removed for failing attention verification question checks: 391 from Qualtrics (35.7% of 1,096), 145 from SurveyMonkey (20.1% of 721), and 126 from MTurk (10.9% of 1,160), ensuring consistency in AVQ-related exclusion across platforms. This left 2,315 individuals who completed the survey and were included in the final analysis (Figure 1). To ensure methodological consistency across platforms, responses that failed AVQ checks were removed prior to analysis. Qualtrics automatically terminated survey sessions when an attention check was failed, so equivalent handling was applied across all datasets for comparability.
Data Quality Assessment
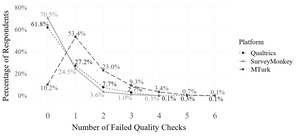
Data quality was assessed by data collection platform (Figure 2). Of the 2,315 total completed responses, 947 (40.9%) passed all quality checks and were classified as good-quality data. A significant difference in data quality was observed across platforms (χ² = 740.8, p < 0.001), with post hoc comparisons confirming differences between all three: SurveyMonkey vs. MTurk (χ² = 618.7, p < 0.001), Qualtrics vs. MTurk (χ² = 520.2, p < 0.001), and SurveyMonkey vs. Qualtrics (χ² = 10.13, p = 0.001). SurveyMonkey yielded the highest percentage of good-quality responses (70.5%), followed by Qualtrics (61.8%) and MTurk (10.2%; Figure 2).
.tiff)
For all completed surveys across platforms (n = 2,315), the median survey completion time was 9 minutes and 29 seconds. The average respondent age was 43.4 ± 16.4 years, and the sex distribution was 52.7% female and 47.3% male. Demographics by data collection platform and for both good- and poor-quality responses can be seen in Table 1.
Across platforms, U.S. demographic alignment was generally stronger among good-quality responses, whereas poor-quality responses demonstrated marked distortion in sex, race, and income, with some platform-specific variation. Relative to U.S. Census benchmarks, several demographic deviations were evident among poor-quality responses across platforms. In Qualtrics, poor-quality responses overrepresented men (61.7% vs. 49.5%), individuals aged 35–54 (41.6% vs. 32%) and those earning $100,000 or more (47.9% vs. 35.8%), while underrepresenting adults aged 55 and older (28.3% vs. 38%). In SurveyMonkey, poor-quality responses overrepresented White respondents (84.1% vs. 74.8%), underrepresented Black respondents (4.7% vs. 13.7%), and substantially underrepresented households earning $100,000 and above (14.1% vs. 35.8%). Income distributions also diverged in MTurk, where poor-quality responses were disproportionately concentrated in the $50,000– $99,999 category (59.6% vs. 28.1%) and markedly underrepresented in the $100,000 and above category (5.8% vs. 35.8%). Removing poor-quality responses changed the quota distributions and, in some cases, made the original quota targets unattainable. Overall, these comparisons indicate that poor-quality responses contributed meaningfully to departures from U.S. demographic benchmarks, with the magnitude and direction of deviation varying by platform and characteristic.
Individual Data Quality Checks
Of the 2,315 survey responses, 1,358 (58.7%) failed at least one quality check and were classified as providing poor-quality data. The performance of these quality checks varied substantially across service platforms (Table 2).

Across service platforms, it was common for respondents classified as providing poor-quality data to fail more than one quality check. Among these respondents, the average number of failed checks (out of 20 possible) was 1.52 ± 0.84, with a range of 1 to 6. Platform-specific averages were as follows: Qualtrics, 1.40 ± 0.75; SurveyMonkey, 1.23 ± 0.57; and MTurk, 1.61 ± 0.89. Three types of open-ended question responses led to rejection: (1) suspected use of AI (artificial intelligence)-generated content (including large language models (LLM)), (2) copied-and-pasted text from the survey or other sources, and (3) nonsensical responses. Interrater reliability for manual open-ended question rejection was high (κ = 0.87 – 0.88; McHugh 2012). Open-ended responses unanimously flagged by all three raters or those failing the automated similarity check were classified as poor-quality. However, agreement between manual and automated rejection methods was low (κ = 0.05), likely due to differences in criteria assessed. Verbatim examples of rejected responses, including original grammar and punctuation, are seen in Tables 3a, 3b, and 3c.
Discussion
This study offers new insights into data quality across three widely used pay-for data collection crowdsourcing platforms by applying a comprehensive set of 20 quality checks within a single, standardized health-focused survey. Evaluation of attention, demographic, logic, honesty-reliability, and open-ended question-based indicators revealed substantial variation in data quality across platforms, with good-quality response rates ranging from 10.2% for MTurk to 61.8% for Qualtrics and 70.5% for SurveyMonkey. Indicator effectiveness also varied considerably across platforms, and the exclusion of poor-quality data altered sample composition and the ability to meet pre-defined quotas. One of the most novel findings was the detection of suspected AI generated responses (including LLMs), specifically for MTurk, bringing to light an emerging threat to the validity of crowdsourced survey research. The use of both manual and automated data quality checks enabled the identification of nuanced forms of low-quality or fraudulent data not detected by traditional methods, demonstrating the need for more rigorous data quality procedures to become standard practice.
Quality control measures differed in their effectiveness across platforms. For MTurk, honesty-reliability checks were the most effective, identifying 40% of poor-quality responses. These checks included indicators such as unrealistically fast completion times and inconsistencies in self-reported demographic information. In contrast, attention verification was the most effective quality check for respondents from Qualtrics and SurveyMonkey, identifying 35.7% and 20.1% respectively, of poor-quality responses across those platforms. However, full analysis of attention check failures in Qualtrics was limited, as these responses were automatically removed by the platform before data were provided to the research team. Most poor-quality respondents only failed one of the remaining twenty checks, and no respondent failed more than six. This pattern suggests that quality indicators do not consistently flag the same respondents and may operate differently across platforms, which demonstrates the importance of tailoring quality control strategies to the survey context and platform. Accordingly, no single method is sufficient, reinforcing the need for a multifaceted and platform-specific approach to online data quality control.
Platform-specific differences in data quality also shaped the demographic composition of the resulting analytic sample. Because poor-quality responses were disproportionately concentrated within certain demographic categories, such as overrepresentation of men or higher-income respondents in some platforms and racial imbalances in others, their exclusion inherently shifted the composition of the remaining sample. Although demographic characteristics alone were not reliable indicators of response quality, removing poor-quality responses often resulted in demographic distributions of good-quality responses that more closely approximated U.S. Census benchmarks. However, the removal process also altered quota distributions and, in some cases, prevented predefined quota targets from being met.
Of the various indicators evaluated, open-ended questions provided some of the clearest signals of response quality. Open-ended questions, including comment boxes, were highly effective for detecting poor-quality responses in Qualtrics and MTurk, and the inclusion of at least one such item is recommended in survey-based studies. These included a context-specific prompt and a question about personal honesty, which revealed copied content from the consent form, survey questions, or web sources related to ankle function. Many of the poor-quality MTurk responses appeared to come from careless participants or simple scripts rather than sophisticated bots. Other studies have also noted repeated, irrelevant, or incoherent open-text responses (Samulise 2020; Guy et al. 2024; Kapitány and Kavanagh 2023; Webster 2023). In our study, multiple identical responses of copied consent form text were found, especially among MTurk participants. With deception tactics circulating online (Nazfull 2022), experienced survey takers evade checks, creating a continual game of “cat and mouse” in developing novel methods that expose deception. Overall, open-ended question responses offered critical insight into response quality and revealed consistent patterns of low-effort or fraudulent responses.
Following the pilot study, two responses with suspected generative AI infiltration were found in the data. These alarming responses forced us to question the overall trustworthiness of data from MTurk. These responses emphasize the increased need for innovative data quality measures, specifically measures related to identifying non-human responses. The growing use of generative AI and specifically, large language models, poses serious risk to many fields of research (De Angelis et al. 2023; Martherus et al. 2025; Veselovsky et al. 2023). Argyle et al. (2023) found that LLMs like Chat GPT-3 can be conditioned to closely emulate human responses, even for specific demographics. Likewise, Lebrun et al. (2024) found that differences between human and AI generated open-ended responses are often hard to detect. Future steps involve examining the extent to which generative AI (including LLMs) can mimic human responses in online surveys and develop innovative ways to identify these fraudulent responses. With these new advancements, researchers should carefully inspect survey responses, specifically open-ended responses and survey-taking behavior, and implement strategies to detect AI generated content, thereby maintaining data quality and preserving the integrity of study findings.
Limitations
During the study, participants who failed attention verification questions in Qualtrics were automatically removed from the dataset, despite instructions to retain responses for analysis. To ensure comparability across platforms, all respondents who failed attention verification questions were subsequently excluded from the analytic sample. SurveyMonkey’s 80-question limit prevented the inclusion of open-ended questions, which likely reduced the ability to identify low-quality respondents, and may have inflated the proportion of good-quality responses. Although efforts were made to coordinate data collection simultaneously across all three platforms, differences in piloting timelines resulted in staggered data collection and minor adjustments to the instrument following initial piloting.
Conclusion
Integrating quality control checks into survey procedures revealed substantial poor-quality data across all platforms; reinforcing that paid participation does not guarantee data integrity. As the use of generative AI and deceptive tactics grows, creative and study-specific quality checks are essential. While no single strategy can eliminate low-quality responses, thoughtful, proactive design and a priori planning can greatly enhance data reliability, reducing the burden on researchers. This study demonstrates the critical importance of implementing rigorous data quality checks in online data collection to maintain the accuracy of conclusions and preserve the integrity of research outcomes.
Corresponding author contact information
Lauren M. Matheny, PhD, MPH
School of Data Science and Analytics
Kennesaw State University