Introduction
The U.S. Census Bureau’s Household Pulse Survey (HPS) began in April of 2020 and collected information from the general population on how the COVID-19 pandemic affected everyday life. The survey was offered in both English and Spanish. In the first week of data collection, the uptake of the Spanish version of the online instrument was lower than expected (as detailed below). This finding motivated the experiment described in this paper, which was fielded during the next two waves of HPS data collection taking place from May 8–May 20, 2020. The goal of this experiment was to improve instrument accessibility and increase participation by Spanish speakers.
Importance of Enabling Participation by Spanish speakers
Roughly 5% of the U.S. population ages five and over are monolingual Spanish speakers (American Community Survey [ACS] 2019). Ensuring participation by monolingual Spanish speakers and by Hispanic respondents more broadly is important for coverage in web surveys like the HPS. One method of enabling participation in online surveys by monolingual speakers of languages other than English is the implementation of language toggles in the online questionnaire. A toggle is a dropdown menu or button that allows the respondent to switch between available languages in an online instrument. The language toggle allows respondents to access translations in their preferred language, thereby reducing response bias (Sha and Gabel 2020). Implementing language toggles for translations should ensure that survey content is accessible to disparate linguistic groups, which ultimately enhances the quality of collected data (Sha and Gabel 2020).
While providing a translation for monolingual Spanish-speaking respondents in web surveys can improve coverage, there are many challenges to ensuring adequate representation of this population (García Trejo and Schoua-Glusberg 2017). For example, Sha et al. found that language toggle designs that are not very noticeable or are buried behind English text constituted a “hidden barrier” to non-English speakers accessing translated materials and sometimes resulted in break offs (Sha et al. 2018).
Evaluating Uptake of Spanish Instrument
One metric for measuring the accessibility of a translated survey instrument is evaluating the “uptake,” or rate at which respondents access the translated version of the instrument. For example, in the 2019 American Community Survey (ACS) the Spanish uptake rate for the online instrument was 0.4% (U.S. Census Bureau 2020).
The HPS offered an enhancement not available in the ACS: the survey platform by default displayed in the respondent’s preferred language based on browser setting if the translation was available. As a result, the respondent did not have to locate the language toggle or select their preferred language manually. In contrast, ACS respondents needed to manually change the language display if they wanted to respond in a language other than English. For this reason, along with other methodological differences between the HPS and ACS, we expected a higher uptake rate of the Spanish translation in the HPS than in the ACS.
Initial results from the HPS were not quite in line with expectations. In the first week of data collection, uptake of the Spanish version of the Household Pulse instrument was 0.47%. This rate was roughly consistent with the ACS but lower than the rate the HPS team hoped to achieve.
Evaluating Break Offs by Ethnicity
Given the relatively lower-than-expected uptake in Spanish, we suspected that many monolingual Spanish-speaking respondents broke off after being unable to locate the language toggle. However, we were unable to directly identify how many of the respondents that broke off were Spanish speakers. Instead, we used self-reported Hispanic ethnicity, which was collected in the third survey question, as a rough proxy for estimating the prevalence of this issue. A limitation of this approach is that not all Hispanic respondents are Spanish speakers. For example, according to data from the American Community Survey, only 68% of Hispanics in the U.S. speak Spanish at home, which includes both monolingual Spanish speakers and bilingual speakers for whom the English version would be accessible (U.S. Census Bureau 2023).
Preliminary analysis of the data collected on the HPS before any language experiment was implemented indicated that Hispanic respondents were slightly more likely to break off from the survey than respondents who did not identify as Hispanic. Initial analysis of the results from week 1 of data collection found a 17.8% break off rate for non-Hispanics vs. 23.1% for Hispanics (t = 9.07, p < .001). In certain respects, this break off rate for Hispanic respondents could be considered a lower bound since the ethnicity question appears on the third screen of the survey, and we can only measure break off rate by ethnicity after collecting respondent’s ethnicity. Overall, the statistically significant difference signaled challenges faced by Hispanic respondents that, for some, could be related to low uptake of the Spanish translation. In light of this preliminary evidence, the Census Bureau worked to ensure access for Spanish-speaking respondents to the Household Pulse Survey by experimenting with a method to potentially increase uptake.
Data and Experimental Design
At the time of data collection, the HPS consisted of a 20-minute online survey available in English and Spanish studying how the COVID-19 pandemic impacted households from a social and economic perspective. This national survey asked questions about topics such as childcare, education, employment, food security, health, and housing.
During the phase of the HPS data collection that was included in these analyses, a cross-sectional sample of approximately one million U.S. households was invited each week via digital communication methods to respond to the survey. The data collection period lasted 1 week, and nonresponding households were contacted multiple times throughout the week in the hopes of obtaining a completed response. Each “Week” as referenced throughout this paper represented a separate wave of data collection. The language experiment was included in the second and third waves of HPS data collection (Week 2 and Week 3) after disappointing uptake of the Spanish instrument in Week 1. Although HPS methodology at that time included a longitudinal follow-up component, the present study focuses only on respondents who were completing the survey for the first time in each week’s data collection.
During Week 2 of data collection, sampled households were invited to respond via email only, but during Week 3 of data collection text message contacts were added in addition to email. Emails included both English and Spanish text, while text messages were in English only. The overall response rate for the HPS varied across weeks, but remained in the single digits, typically ranging from 4-6%. (For more details about the HPS methodology during the initial phase of data collection, please see Fields et al. 2020).
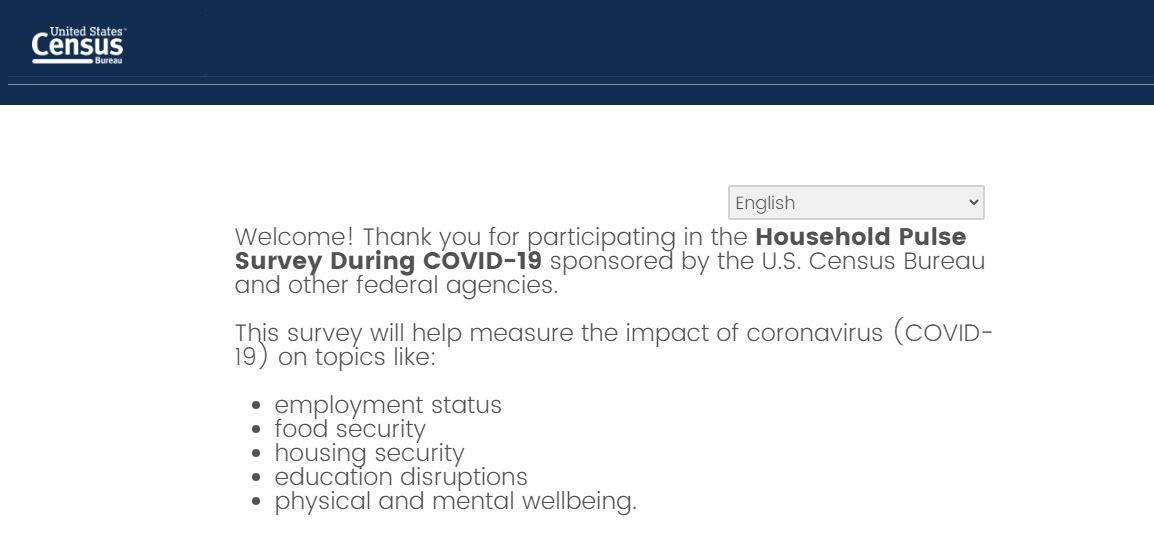
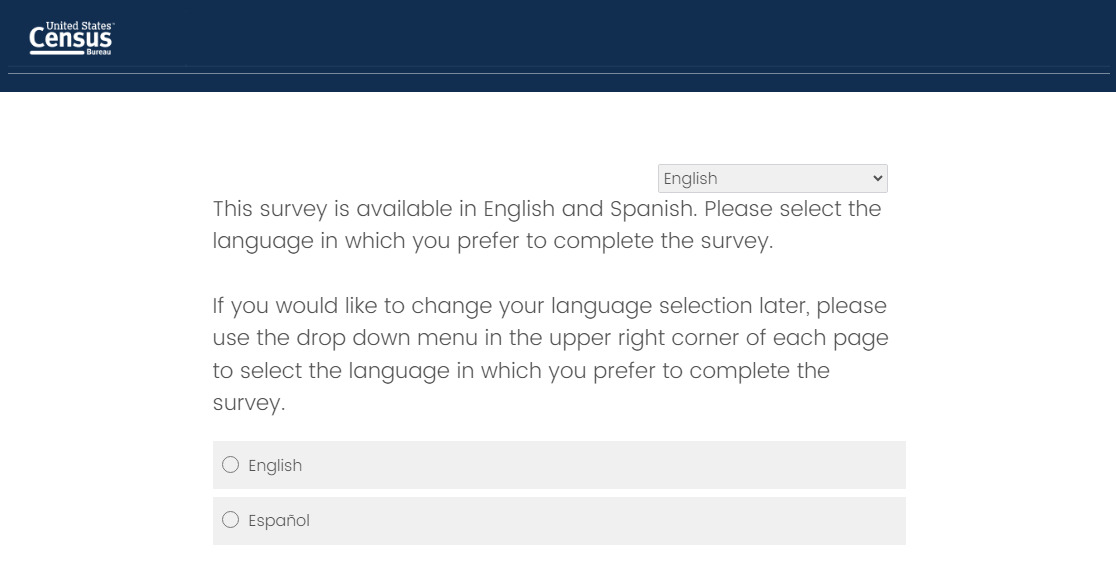
Respondents were randomly assigned to either a control instrument or a treatment instrument with a new forced choice language question. In the treatment questionnaire, an explicit question appeared on the second instrument screen asking respondents to choose their preferred language for completing the survey (either English or Spanish), while in the control condition respondents were not given an explicit choice of language. In both instruments, respondents could toggle or switch the version of the instrument using a dropdown in the upper right corner of the page on each screen (see Figures 1 and 2 below). While it would have been preferable to present the forced choice item on the first screen, we were unable to do so due to introductory and legal text that needed to appear on the first screen. In both the treatment and control instruments, the survey platform selected the initial display language based on the respondent’s browser settings. As a result, those who had set their browser preferences to Spanish would see the Spanish instrument by default, while everyone else would see English by default.
.png)

Roughly half of respondents were assigned to each condition, with 49.9% (12,500 participants) of all first-time respondents being assigned to the treatment condition in Week 2 and 50.1% (67,000 participants) in Week 3.[1] The substantially larger number of responses in Week 3, compared to Week 2, can be attributed to the addition of the text message recruitment mode beginning in Week 3.
In addition to the language experiment, other methodological changes to the HPS may have impacted our results. Between Week 2 and Week 3 of HPS data collection, the contact strategy changed from an email only recruitment method to an email and text message recruitment method, with many sampled households receiving both email and text invitations. The expanded contact strategy increased the overall reach of the survey, likely introducing respondents with different characteristics than those reached under the original protocol. As the sample changed, the relevance and visibility of the explicit language item may also have changed. This methodological change boosted overall response rates to the survey and may also have impacted the proportion of Hispanic individuals or monolingual Spanish speakers who responded.
Results
Results of the experiment evaluating the impact of a forced-choice language selection question on survey completion rates are documented in the following section. Analysis of the results of this experiment were conducted on raw (unweighted) data.
Uptake of Spanish Instrument
In comparison to Week 1 (with a 0.47% Spanish uptake rate), overall uptake of the Spanish instrument remained low in Week 2 of data collection despite implementation of the forced choice language selection experiment. As seen in Table 1, out of 25,000 complete and partial first-time responses, only 200 were recorded in Spanish (0.81%) in Week 2. Of those, slightly more than half were recorded as complete cases, representing a 45% break off rate among those using the Spanish-language instrument. There did not appear to be a substantial difference in uptake of the Spanish instrument between experimental conditions in Week 2. Among all completes and partials, 0.83% of those assigned to the treatment condition provided a response in Spanish while 0.80% of those assigned to the control condition responded in Spanish (t = -.23, ns).
During Week 3, HPS rolled out a new respondent contact strategy that added text messaging as a recruitment method in addition to the email invitations used in Weeks 1 and 2. Response rates and the rate of uptake of the Spanish instrument were both notably higher compared to Week 2. A greater number of responses offers a better chance of detecting an effect of the experiment, given the small number of cases completed in Spanish overall. Out of 133,000 complete and partial first-time responses, 1,800 were recorded in Spanish (1.35%). Of those, less than half were recorded as complete cases, demonstrating a 55.5% break off rate among those using the Spanish-language instrument. There was also evidence of a slightly greater uptake of the Spanish instrument in the treatment condition compared to the control condition in Week 3. Among all first-time completes and partials, 1.43% of those assigned to the treatment condition provided a response in Spanish while 1.26% of those in the control condition responded in Spanish. Although numerically small, the difference is statistically significant (t = -2.74, p < .01).
These results suggest that (1) implementation of text messaging appears to have boosted the proportion of respondents completing the instrument in Spanish regardless of experimental condition and (2) in Week 3 when Spanish uptake was higher overall, the experimental condition experienced a slightly higher uptake of the Spanish instrument compared to the control. As outreach expanded and the survey reached a broader set of households, the role of the explicit language item may have shifted. That is, the usefulness of prominently signaling Spanish language availability may depend in part on who is reached by the contact strategy.
Completion Rate by Experimental Condition
Overall, respondents who started the survey were just as likely to finish the survey regardless of the language treatment they received across both weeks of data collection. Among those who started the survey, the completion rate across both languages for the treatment condition in Week 2 was 76.5% compared to 75.9% in the control condition (t = -1.05, ns). For Week 3, the completion rate was lower across both conditions compared to Week 2. Although the reason for the differential breakoff rate across these waves of data collection is unknown, it could be due to the inclusion of cell phone numbers in the sample and the use of text messaging to contact respondents. These methods would be expected to increase the number of respondents completing the survey on a mobile device, which has often been associated with increased breakoff in web surveys (e.g., Mavletova 2013).
However, there was no evidence of an adverse effect of the treatment condition. In fact, as shown in Table 2, there was a small but significant boost in terms of the proportion of respondents completing the survey for all respondents (including those completing the survey in English), with 66.1% completes in the control condition finishing the survey compared to 66.8% in the treatment condition (t = -2.72, p < .01). This suggests that there was no increase in break offs because of the experimental presentation of a language selection question, and possibly a small advantage in terms of completion rates (as seen in Week 3). Additional analysis did not reveal a significant interaction between response language and experimental condition on completion rates (Week 2: Wald χ²(1) = 3.65, ns; Week 3: Wald χ²(1) = 0.02, ns). This indicates that the impact of the experiment on completion rates was not meaningfully different by response language.
Discussion and Conclusion
Preliminary analysis before conducting this experiment indicated a low uptake of the Spanish instrument and higher break off rates among Hispanics compared to non-Hispanic respondents in the HPS, prompting the implementation of an experiment to increase awareness of the Spanish instrument. Although Week 2 data did not show a clear effect of the treatment condition, after implementing text messaging as part of the contact strategy in Week 3, uptake of the Spanish instrument was slightly higher for the treatment group than the control group. Break off rates were also slightly lower for respondents identifying as Hispanic in the treatment group than the control group in Week 3, although this result was not statistically significant.
We may have seen an even larger difference between conditions if the questionnaire had not included automatic language selection based on browser settings, since this default best practice setting likely pushed some respondents to their preferred language even in the control condition. Additionally, it should be noted that the forced choice question appeared on the second screen for reasons outside of our control, and some Spanish-speaking respondents may have broken off at the first screen before reaching this item.
Given the lack of any apparent adverse effect on response for non-Hispanics and the possible benefits for Spanish-speaking respondents, we recommend that online surveys for which translations are available should implement a forced choice language question at the beginning of the questionnaire to maximize uptake of the translated versions and reduce break offs for non-English speakers.
We recommend further research to investigate whether the inclusion of the forced choice language question has any discernible effects on the measured characteristics of respondents (including self-reported ethnicity, education, age, income, etc.). We also recommend further research in which a forced choice language question is presented on the first screen rather than a later screen, and without language optimization based on respondents’ browser settings, to disentangle those effects on uptake of translated survey instruments.
Future research could also examine whether language accessibility interventions affect indicators of data quality such as item nonresponse or response consistency. While this study focuses on break off rates and participation behavior, accessibility may also influence the quality of data collected. Prominent placement of alternate language options may not only improve completion among respondents with limited English proficiency but also enhance measurement validity by ensuring that respondents are engaging with survey questions in their preferred language.
Corresponding author contact information
Casey M. Eggleston
4600 Silver Hill Road, Suitland, MD 20746
Disclaimer
Any opinions and conclusions expressed herein are those of the author and do not represent the views of the U.S. Census Bureau. The Census Bureau has ensured appropriate access and use of confidential data and has reviewed these results for disclosure avoidance protection (CBDRB‑FY25‑0450).
Due to Census Bureau disclosure avoidance rules, exact numbers of participants are rounded throughout the paper.