
INTRODUCTION
Public opinion surveys serve as an integral part in understanding societal sentiments and informing policy decisions (Burstein 2003). Visual aids such as charts, graphs, and infographics serve as effective tools for enhancing comprehension and maintaining engagement in survey responses, particularly when addressing complex or spatial information, such as infrastructure design (Brooker and Schaefer 2015). Visual aids have been commonly utilized in both mail and online surveys; nonetheless, their use in telephone surveys has been limited due to the inability of interviewers to present visuals directly (Nathan 2001; Oldendick 2002).
Prior research suggests that visual aids reduce cognitive load and improve information retention, thereby enhancing the accuracy and reliability of survey responses (Mayer and Moreno 2003; Paivio 1991; Tourangeau et al. 2000). In contrast, telephone surveys rely solely on auditory processing, which may increase cognitive burden and introduce measurement error (Dillman and Christian 2005; Kreuter et al. 2008). Mixed-mode survey designs offer a potential solution by combining different data collection methods; however, they may also introduce mode effects arising from differences in how respondents interpret and process information (de Leeuw 2005; Vannieuwenhuyze and Loosveldt 2013).
Despite advances in survey methodology, limited attention has been given to whether providing telephone respondents with access to the same visual materials as those in self-administered modes can reduce such differences. This research note addresses that gap by presenting a proof-of-concept case study of the City of Aspen’s 2024 community survey. In this study, respondents across all modes were provided with identical visual materials, creating a standardized informational environment. While the study does not aim to establish statistical equivalence across modes due to the limited telephone subsample (n = 29), it demonstrates the feasibility of integrating visual aids into telephone surveys and provides a foundation for future research.
METHODOLOGY
The data for this research note are drawn from the City of Aspen 2024 Community Survey, conducted by Probolsky Research between October 22 and November 13, 2024. The survey targeted registered voters in Aspen, Colorado, and employed a mixed-mode design incorporating both telephone and online data collection.
Prior to data collection, a postcard was mailed to every registered voter. The postcard included a corridor map, visual renderings of the bridge alternatives, a survey URL, a QR code, and a toll-free phone number. At the beginning of each telephone interview, respondents were asked whether they had the postcard available. If not, interviewers directed them to a publicly accessible webpage containing the same visual materials used in the online survey. Standardized prompts were used throughout the interview to guide respondents in referencing the visuals when answering relevant questions. This multi-step process ensured that telephone respondents had real-time access to the same visual information as online participants.
The sampling frame consisted of the full population of registered voters in Aspen, Colorado, as obtained from the official county voter file. As part of the survey design, every registered voter was directly contacted using a comprehensive outreach strategy. Each individual voter—rather than each household—received a mailed postcard, ensuring complete population coverage. Additional outreach methods included telephone calls, text messages, and email invitations where contact information was available.
Although all registered voters were contacted, participation required respondents to complete the survey via telephone or online platforms. As with most survey research, this introduces the possibility of nonresponse bias. However, the use of multiple outreach modes increases the likelihood that the responding sample reflects the broader voter population.
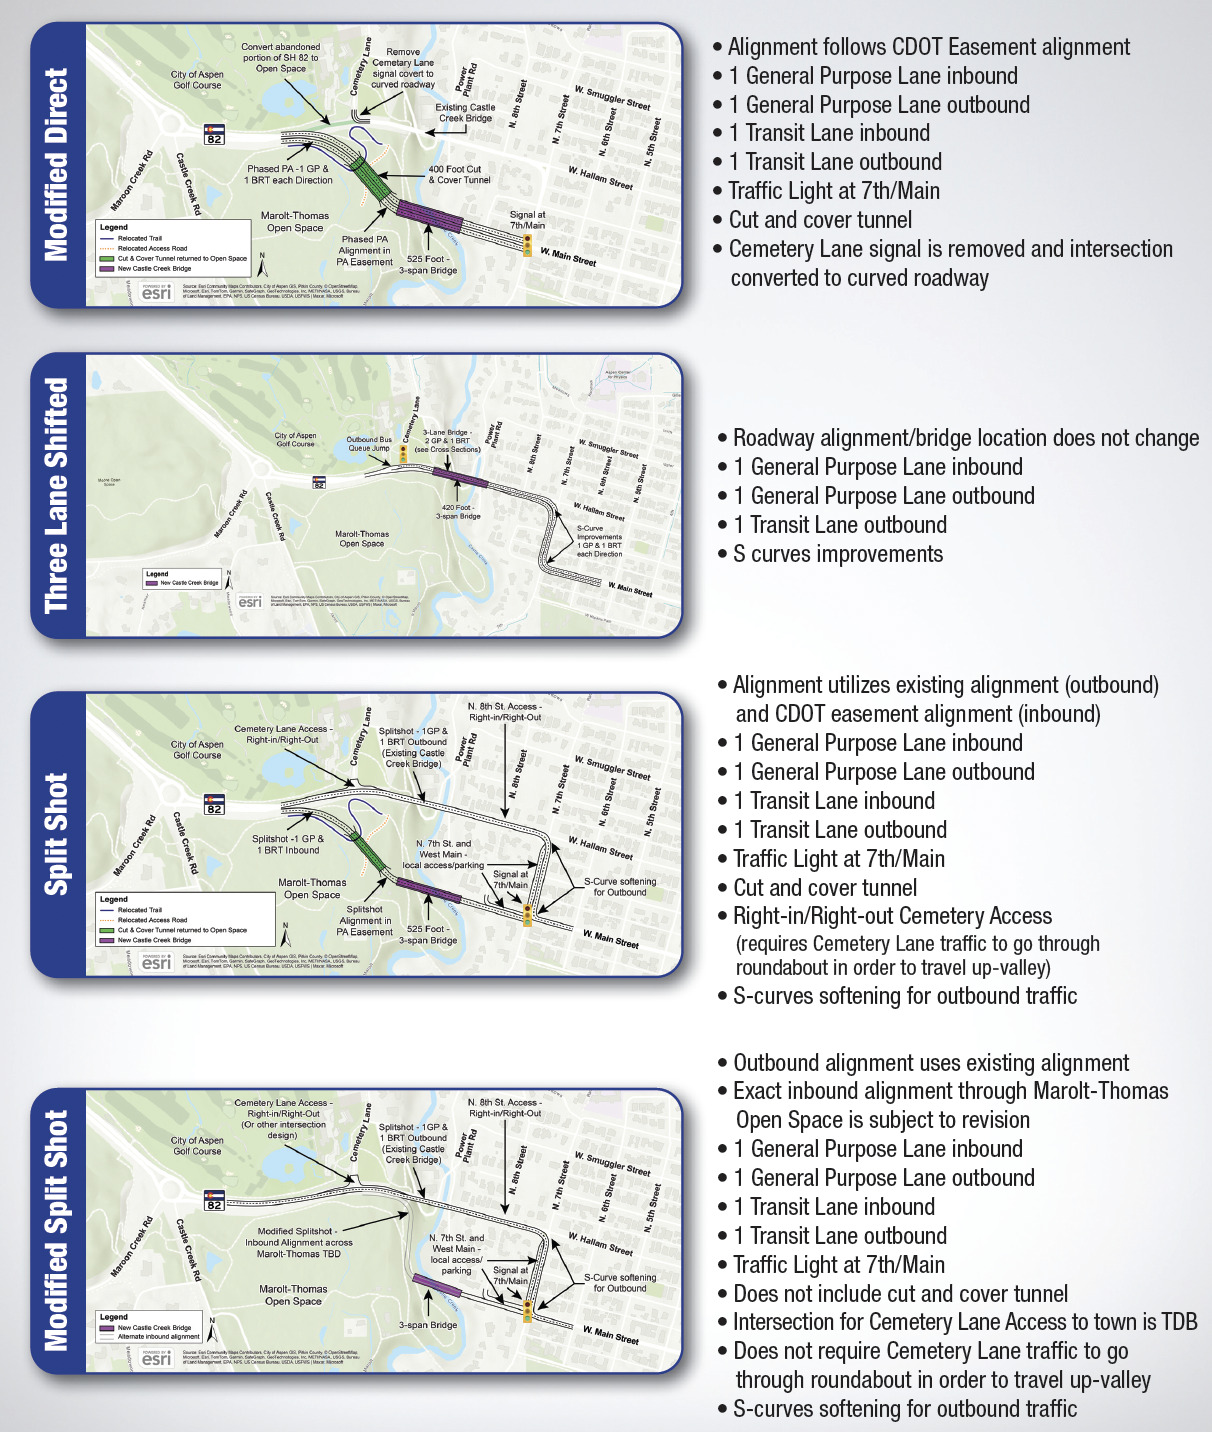
The questionnaire included both open-ended and closed-ended items addressing community priorities and perceptions related to the Castle Creek Bridge and Entrance to Aspen Corridor project. Respondents were also asked to evaluate four alternative bridge designs.
The survey was administered in English and Spanish.
Case Study Context
The Castle Creek Bridge is a critical transportation link providing primary western access to the City of Aspen, Colorado. The structure has been the subject of ongoing public discussion due to infrastructure maintenance needs, design alternatives, and land-use constraints associated with the surrounding Marolt Open Space.
Given the technical nature of the bridge alignment alternatives and their associated environmental and transportation implications, the survey incorporated visual materials to support respondent evaluation of the proposed options. The survey design therefore prioritized consistent visual exposure across modes to reduce potential differences in interpretation between online and telephone respondents.
Figure 1 presents the visual stimuli used in the survey, including the corridor map and bridge design alternatives provided to respondents across all modes.
RESULTS
Table 1 shows the differences in demographics between the modes. The telephone subsample (n=29) is significantly younger and more ethnically diverse compared to the internet sample. Because of this limited size, all comparisons between modes in this study are only descriptive. These data are intended to illustrate the feasibility of the methodology rather than to provide statistically generalizable conclusions regarding mode-based behavior.
In addition, the sampling framework was designed using a stratified random approach based on the official voter file to reflect the demographic composition of the registered voter population. While detailed population benchmarks are not presented in this research note, the design ensured alignment across key demographic variables, supporting the overall representativeness of the achieved sample.
Despite the demographic diversity and limited telephone sample size, the rank-order of bridge preferences exhibited consistency across modes (refer to Table 2). The mean absolute difference in mode-based choice rankings was 3.4 percentage points, indicating that the common visual context likely contributed to anchoring the responses.
In addition to the primary ranking of bridge preferences, further policy-related elements were examined to assess consistency across different modes. The data presented in Table 3 illustrates the distribution of responses concerning four particular issues identified in the survey, including perceptions of actions by the Colorado Department of Transportation (CDOT).
DISCUSSION
This case study functions as an operational proof-of-concept aimed at equalizing the informational environment within the context of mixed-mode research. The Aspen 2024 Community Survey illustrates that, despite the historical limitations of telephone surveys to auditory stimuli, a coordinated multi-channel methodology can effectively address the visual-aural divide. The alignment of rank-order preferences across various modes, even in the presence of notable demographic disparities, indicates that offering a common visual context could enhance the consistency of measurement in different response settings.
Interestingly, the telephone subsample skewed younger and more ethnically diverse than expected, contrary to traditional assumptions that older respondents are more likely to participate via telephone surveys. This may reflect changing communication preferences or differences in responsiveness to outreach strategies, and warrants further investigation.
While these findings support the feasibility of the approach, several limitations should be considered.
LIMITATIONS AND FUTURE RESEARCH
This study serves as a feasibility demonstration and is therefore subject to several limitations that inform directions for future research.
First, the relatively small size of the telephone subsample (n = 29) limits the statistical power of the analysis and constrains the ability to conduct inferential comparisons across survey modes. While the observed consistency in bridge preference rankings is encouraging, the findings should be interpreted as indicative rather than conclusive.
Second, although the survey employed a full-population outreach strategy in which all registered voters were contacted through multiple communication channels, participation ultimately depended on respondent engagement. As with most survey research, this introduces the potential for nonresponse bias, as individuals who choose to participate may differ systematically from those who do not.
Third, the methodology relies on the successful delivery and utilization of mailed materials. While each registered voter received an individual postcard containing the visual aids, the approach assumes that respondents retained and accessed these materials at the time of participation. Any disruption in delivery, failure to retain the postcard, or inability to access the alternative web-based visuals during telephone interviews may affect the consistency of visual exposure across respondents.
Fourth, engagement with the visual materials during telephone interviews cannot be independently verified. Although interviewers provided standardized prompts, it is not possible to confirm the extent to which respondents actively viewed or relied on the visuals when answering survey questions.
Finally, the study did not include a randomized control condition comparing telephone respondents with and without access to visual aids. As a result, while the findings suggest that visual integration may contribute to consistency across modes, the causal impact of visual materials cannot be definitively established.
Future research should extend this approach by implementing the methodology on larger samples to enable more rigorous statistical testing of mode effects. Experimental designs incorporating control groups would allow for clearer evaluation of the causal impact of visual aids. In addition, future studies may explore strategies for assessing respondent engagement with visual materials during telephone interviews, such as incorporating validation questions or interactive prompts.
CONCLUSION
The implications for practitioners and government agencies are clear: when public policy surveys tackle spatially or technically intricate subjects, the inclusion of visual aids for telephone respondents is both operationally viable and methodologically sound. This study outlines a practical framework for ensuring that respondents, regardless of communication mode or digital access, can engage in public opinion research with access to a consistent informational foundation.
DISCLOSURE OF INTEREST
The author is the President of Probolsky Research, the firm contracted to conduct the community survey of the City of Aspen.
CORRESPONDING AUTHOR CONTACT INFORMATION
Adam Probolsky
Adam.Probolsky@cgu.edu
Claremont Graduate University
Author Biography
Adam Probolsky is a Senior Research Fellow with the Peter F. Drucker School of Management at Claremont Graduate University and President of Probolsky Research.