1. Introduction
The COVID-19 pandemic laid bare multiple intersections of inequality and the cumulative impact across the lifecourse (Bécares et al. 2025; Wallace et al. 2016). The pandemic did not disrupt the entrenchment of inequalities — it amplified it; structural and interpersonal racism accelerated.[1] While governments focused on delivering evidence-based policy and action, they were faced with an equally taxing methodological concern: the research infrastructures on which much of the UK depended were not designed for the pressing needs of the time. Evidence was largely obtained via field adapted questionnaires of existing samples (Gummer et al. 2024; Kastberg and Siegler 2022). This was problematic for understanding ethnic and religious minorities (henceforth minoritized populations) because established infrastructures are not designed for granular analyses of or comparisons between them, and use instruments designed for general populations rather than minoritized populations. The implications of this are important – underrepresented populations are at risk of exclusion not only in their daily lives, but also in their statistical lives.
The Evidence for Equality National Survey (EVENS), as part of the Centre on the Dynamics of Ethnicity (CoDE), sought to address this data deficit, joining a limited number of studies utilizing nonprobability methods to achieve large samples of underrepresented groups. Such approaches have the potential to generate large samples of minoritized populations to support between-group comparisons, particularly where sampling frames exhibit significant coverage issues or are non-existent (Turban et al. 2023; Brown 2023). The study also builds on current evidence on recruitment methods for nonprobability methods (Wallace et al. 2016) – notably, evidence on collaborations with Voluntary, Community and Social Enterprise organizations (VCSEs) to achieve high quality, large-N samples of underrepresented groups, given extensive advocacy for such co-production, but without widely agreed standards of procedure (Grant et al. 2020; Liu et al. 2020; Suen and Chan 2020; Ta Park et al. 2022; United Nations Development Programme 2016; United States Census Bureau 2019).[2]
This paper examines the effectiveness of VCSE partnerships for survey recruitment of minoritized populations. It examines self-reported recruitment pathways in EVENS for the open-web sample that was generated through partnership with VCSEs to address two research questions:
-
What is the prevalence of recruitment pathways into the open-web, nonprobability sample of the Evidence for Equality National Survey (EVENS)?
-
Is there patterning by ethnic group in the (combination of) reported recruitment pathways?
From this analysis we derive three recommendations for survey practitioners recruiting minoritized populations, which we develop in Section 5: plan for differential mode responsiveness across communities, treat word-of-mouth as a core (not auxiliary) recruitment route, and build mode flexibility — with monitoring — into the design from the outset.
1.1. Evidence for Equality National Survey (EVENS) study
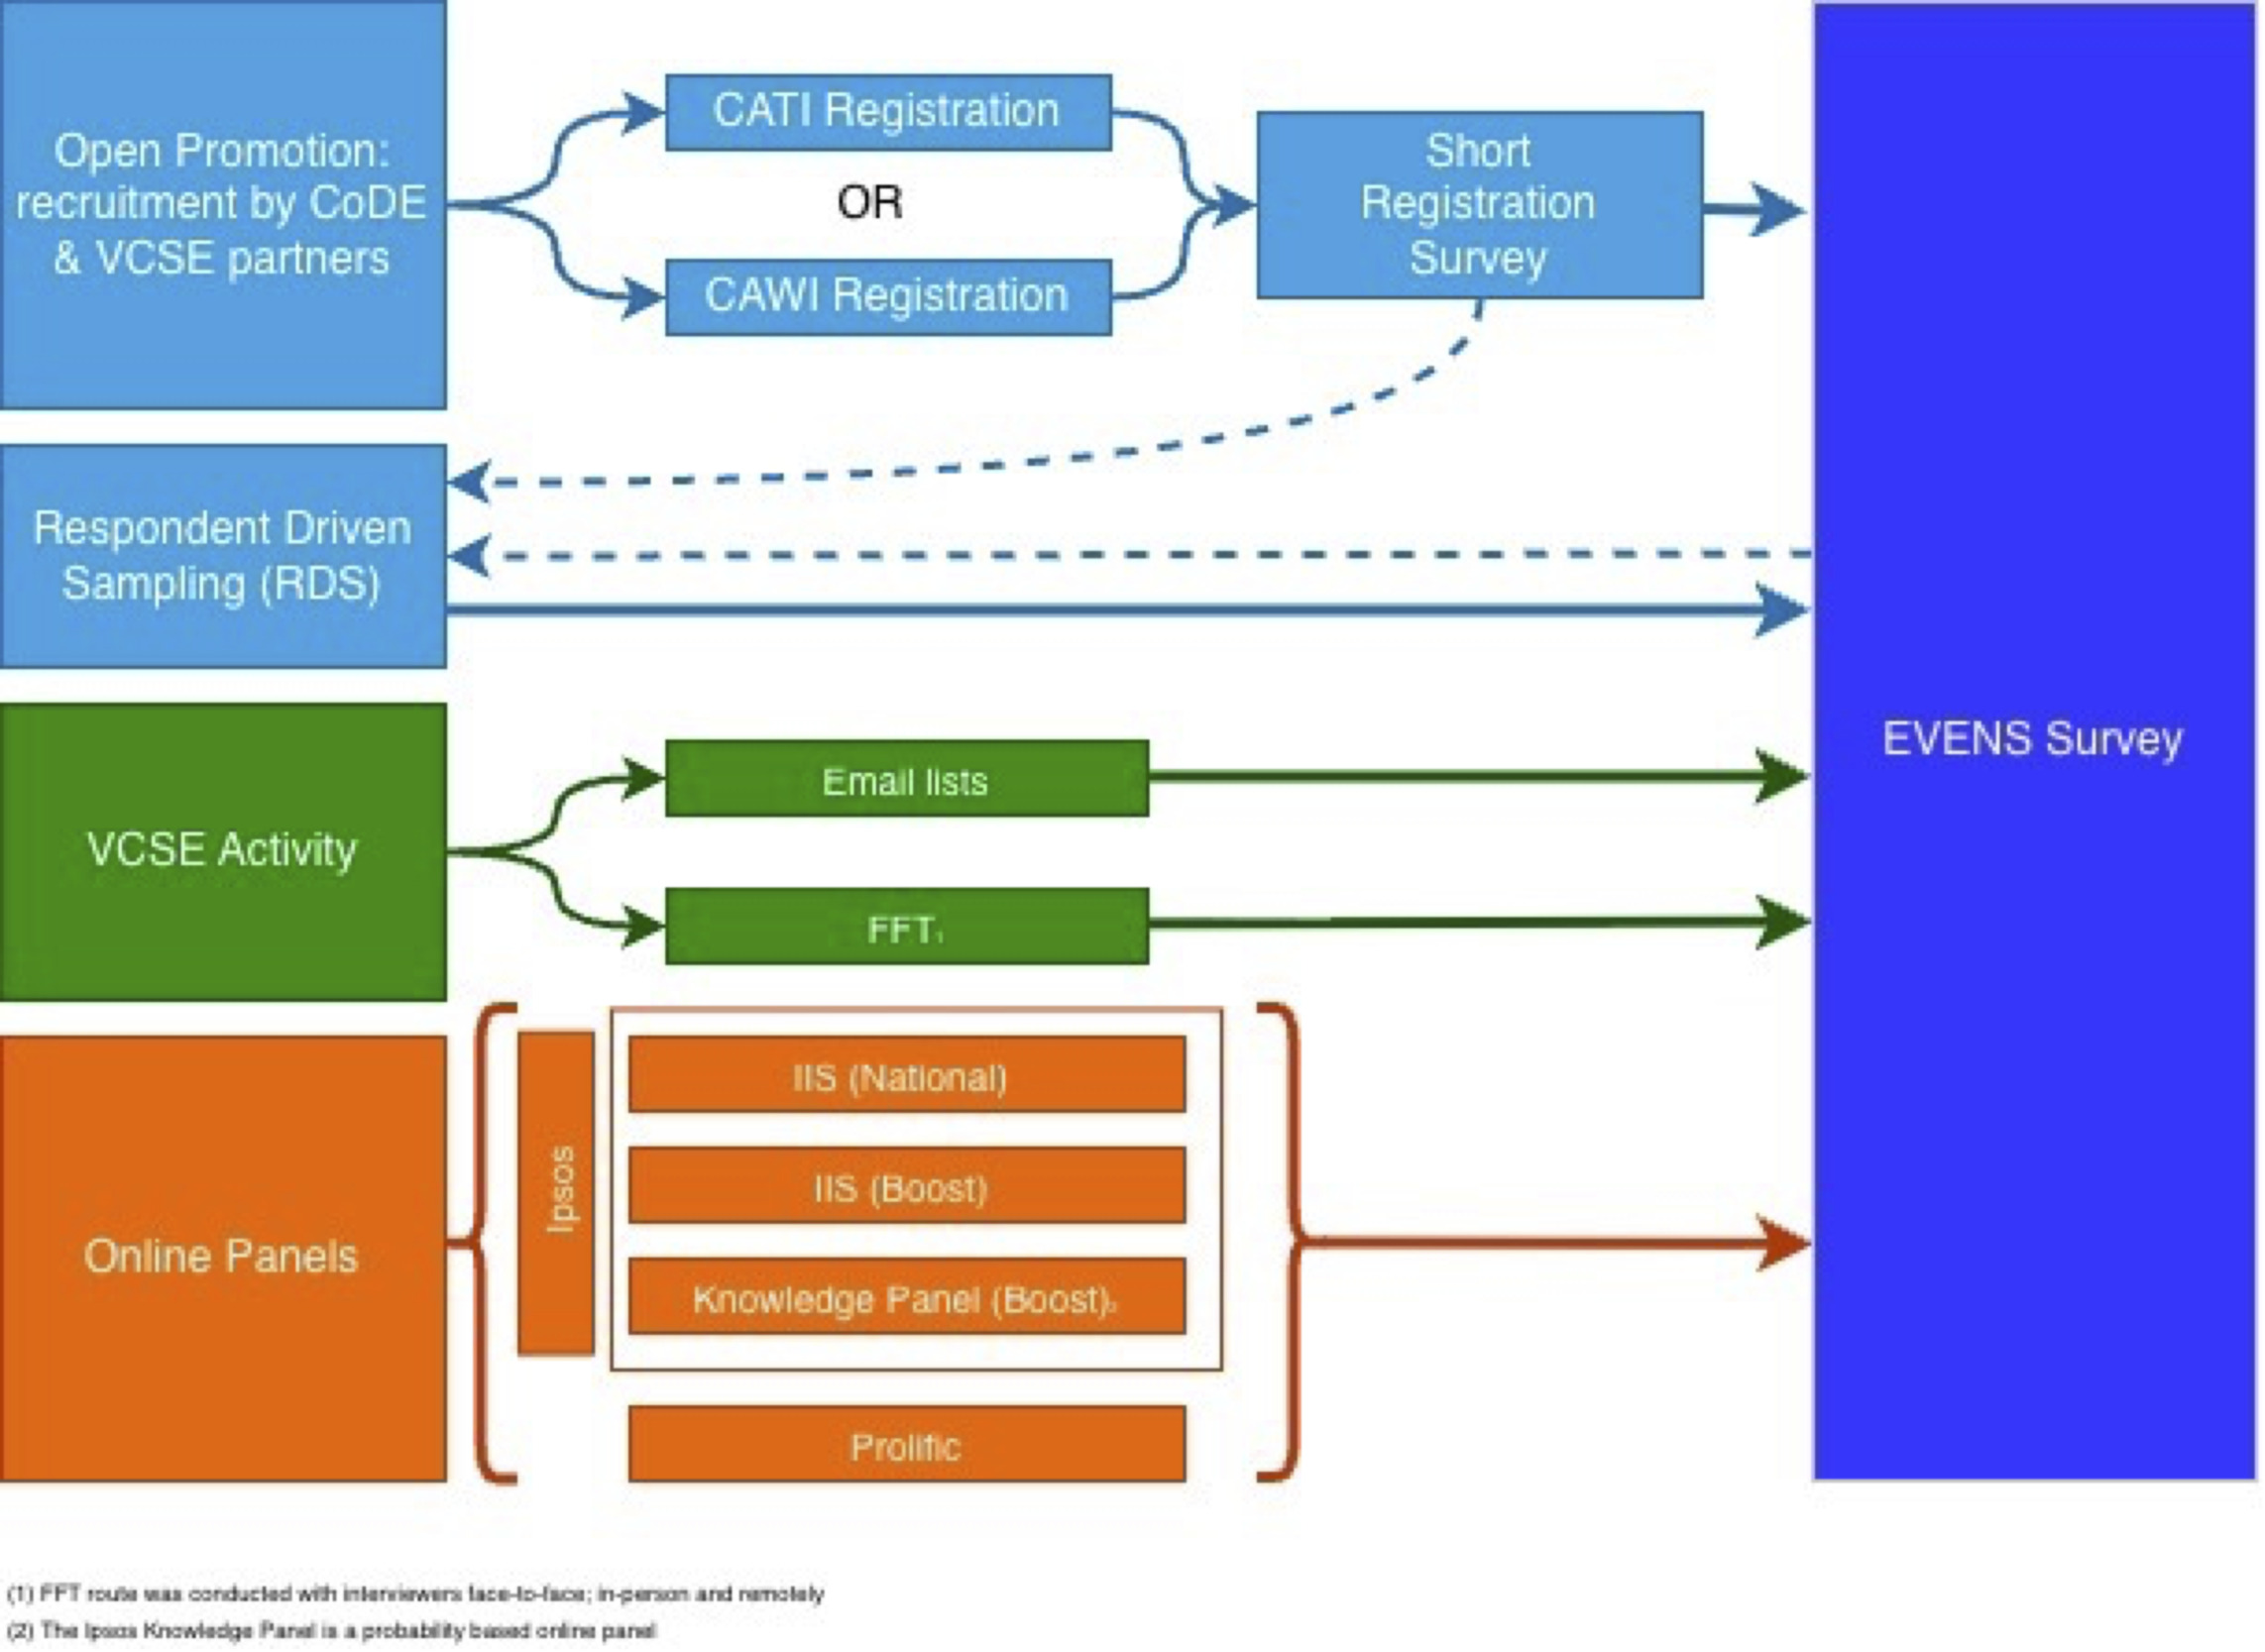
The EVENS study was fielded in 2021 to document the experiences of ethnic and religious minorities in Britain during the COVID-19 pandemic.[3] Using nonprobability methods and multiple recruitment channels, the study achieved a sample of more than 14,000 respondents, including more than 9,000 ethnic and religious minority participants. The final sample comprises respondents entering via panels (Ipsos and Prolific) and non-panel, open-web recruitment (Figure 1).[4] Such multi-channel approaches are not uncommon in studies of ‘hard-to-reach’ populations (Brown 2023), with notable studies incorporating VCSE collaborations (FRA 2019; 2025; James et al. 2016; Ta Park et al. 2022), though less widely reported on in detail for methodological inquiry and comparison, with exceptions (e.g., Pötzschke et al. (2023)).
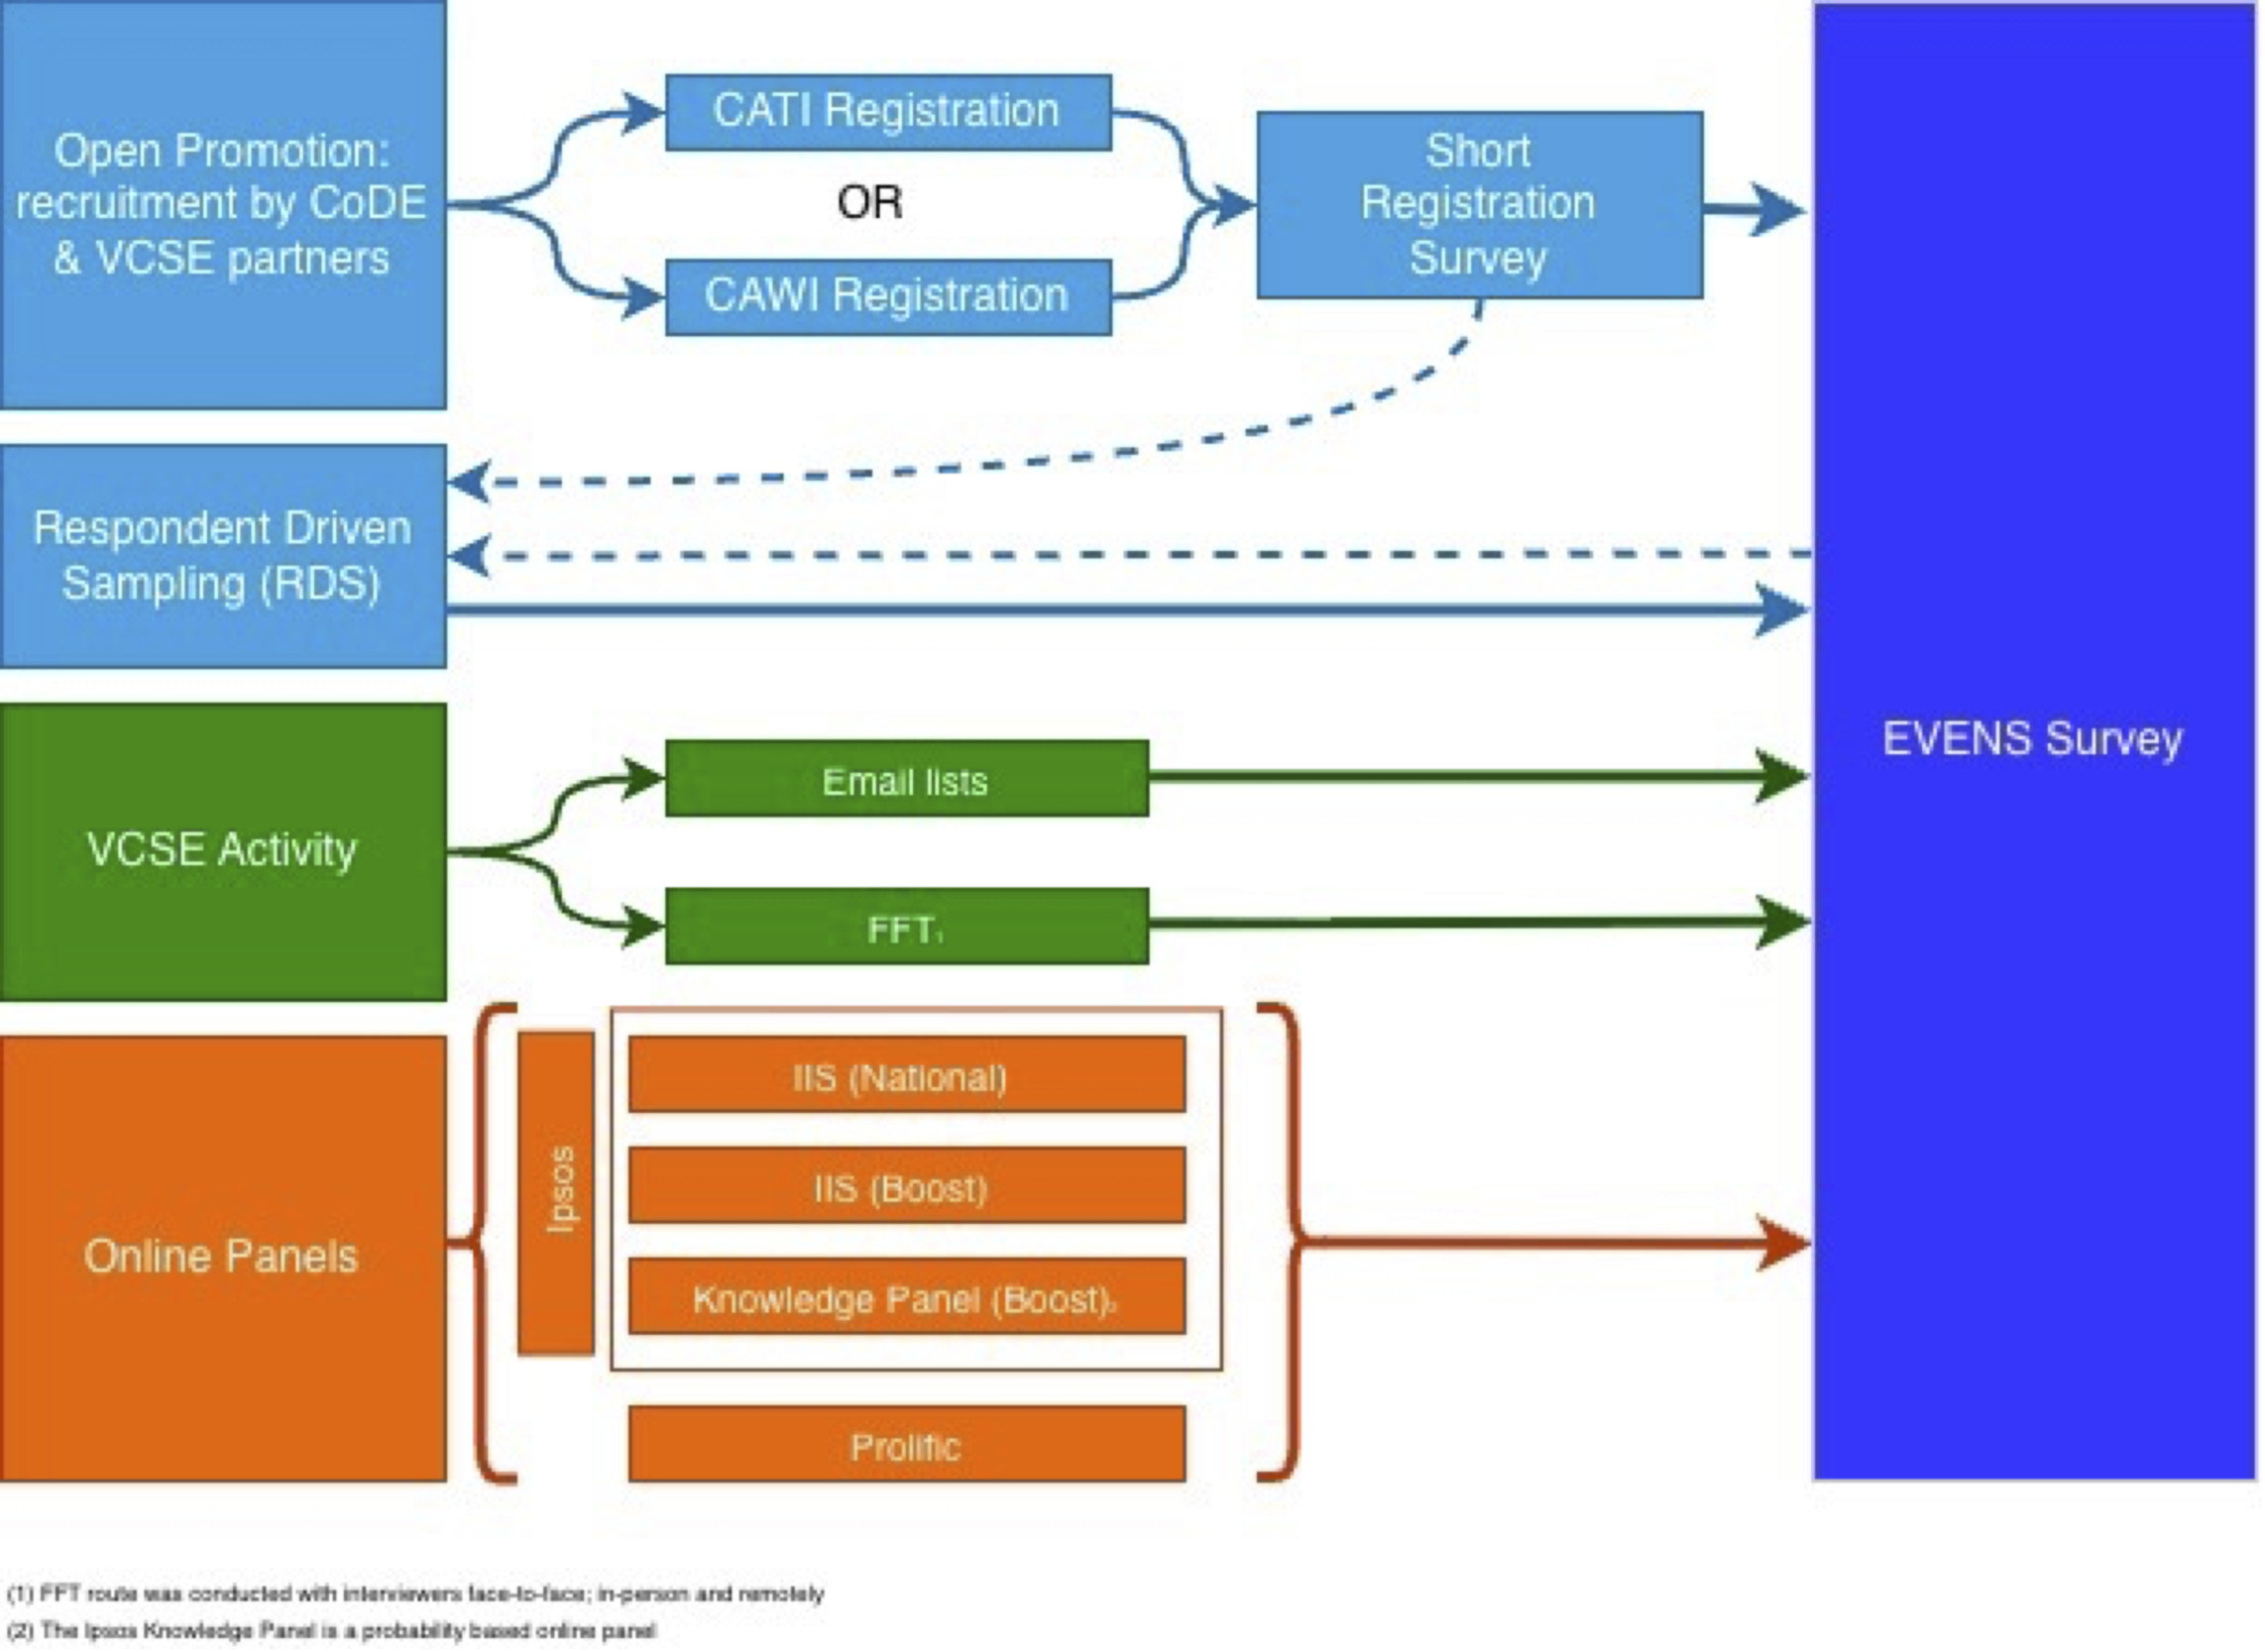
Twelve VCSE partnerships were established to represent key ethnic and religious communities across Britain, focusing on instrument development and sample acquisition.[6] We examine the latter.
1.2. Co-production and collaboration
Co-production within large studies is well established for developing instruments (e.g., pretesting, expert review, cognitive testing) and anticipating sampling and recruitment barriers (e.g., access, trust, receptivity). For EVENS, this co-production framework resulted in substantive alterations to the base instrument: incorporation of a denomination question for Jewish respondents, adaptation of accommodation questions for respondents with non-standard housing (e.g., Roma and Gypsy/Traveler communities), and repositioning of sensitive socio-demographic questions. These adaptations exemplify the benefits of qualitative development strategies and the importance of building-in representation (Han et al. 2021; Harrison et al. 2021; Garnett and Northwood 2022; Bonevski et al. 2014)
Our VCSE engagement covered minoritized groups, with quota monitoring, aiming for representative samples based on age, sex, and UK region. VCSE partners were given maximum latitude to recruit from their respective communities according to their individual assessment of best approaches. Given the variety of strategies that VCSEs have at their disposal, the fluidity of recruitment opportunities, and the context of the pandemic-era social life, monitoring all instances of communication and engagement proved untenable.[7]
The research team did not prescribe, standardize, or actively monitor VCSE recruitment activities. Each partner was briefed on the survey’s aims and was then free to deploy whatever combination of channels, events, intermediaries, or interpersonal outreach they judged most likely to reach their constituent community. This choice was made under the consideration that standardizing recruitment across organizations working with substantively different communities might undercut the very expertise the partnerships were established to leverage. The trade-off is the “black box” we describe — it is also what makes the analysis that follows interpretable. Because partners were unconstrained, the recruitment patterns we observe across ethnic groups reflect each community’s organic engagement profile, not a uniform protocol imposed from above. The clustering of ethnic groups by recruitment pathway, in other words, is a finding made possible by the absence of top-down monitoring, not despite it.
The open-web component was heterogenous in its recruitment methods compared to the direct and panel recruitment arms. Respondents to the open-web survey originated from multiple recruitment pathways – e.g., social media, broadcast media, word-of-mouth, or direct VCSE engagement (e.g., interpersonal communication, events). Pathways were determined based on assessments of community saliency – however, this generates a ‘black box’ of recruitment routes stemming from intermediary recruitment processes (i.e., VCSEs).[8] As with many studies, EVENS’ main online questionnaire included a self-report item on source of information about the survey.[9] We take this item to interrogate patterns of recruitment within the ‘black box’ of engagement.
2. Approach
2.1. Sample
Our sample is derived from the EVENS controlled-access dataset (14,221 respondents across all arms), of which 3,333 originated from the open-web arm. 2,783 respondents remained for analysis across 21 ethnic groupings. The UpSet plot is restricted to Online Main respondents with usable recruitment-source profiles, which excludes known ‘direct-to-individual’ recruitment (n = 2058).[10]
2.2. Variables
Our analysis involves two core items – (1) source of recruitment, and (2) self-reported ethnicity.[11]
2.3. Analytical approach
To evaluate our first question, we utilize an UpSet plot to visualize the overlap of recruitment sources among respondents, given its ability to analyze sets and their intersections across multiple recruitment channels.[12] We collapse responses to the select-all-that-apply recruitment source item into seven categories (tags), concatenated to form ‘profiles’.
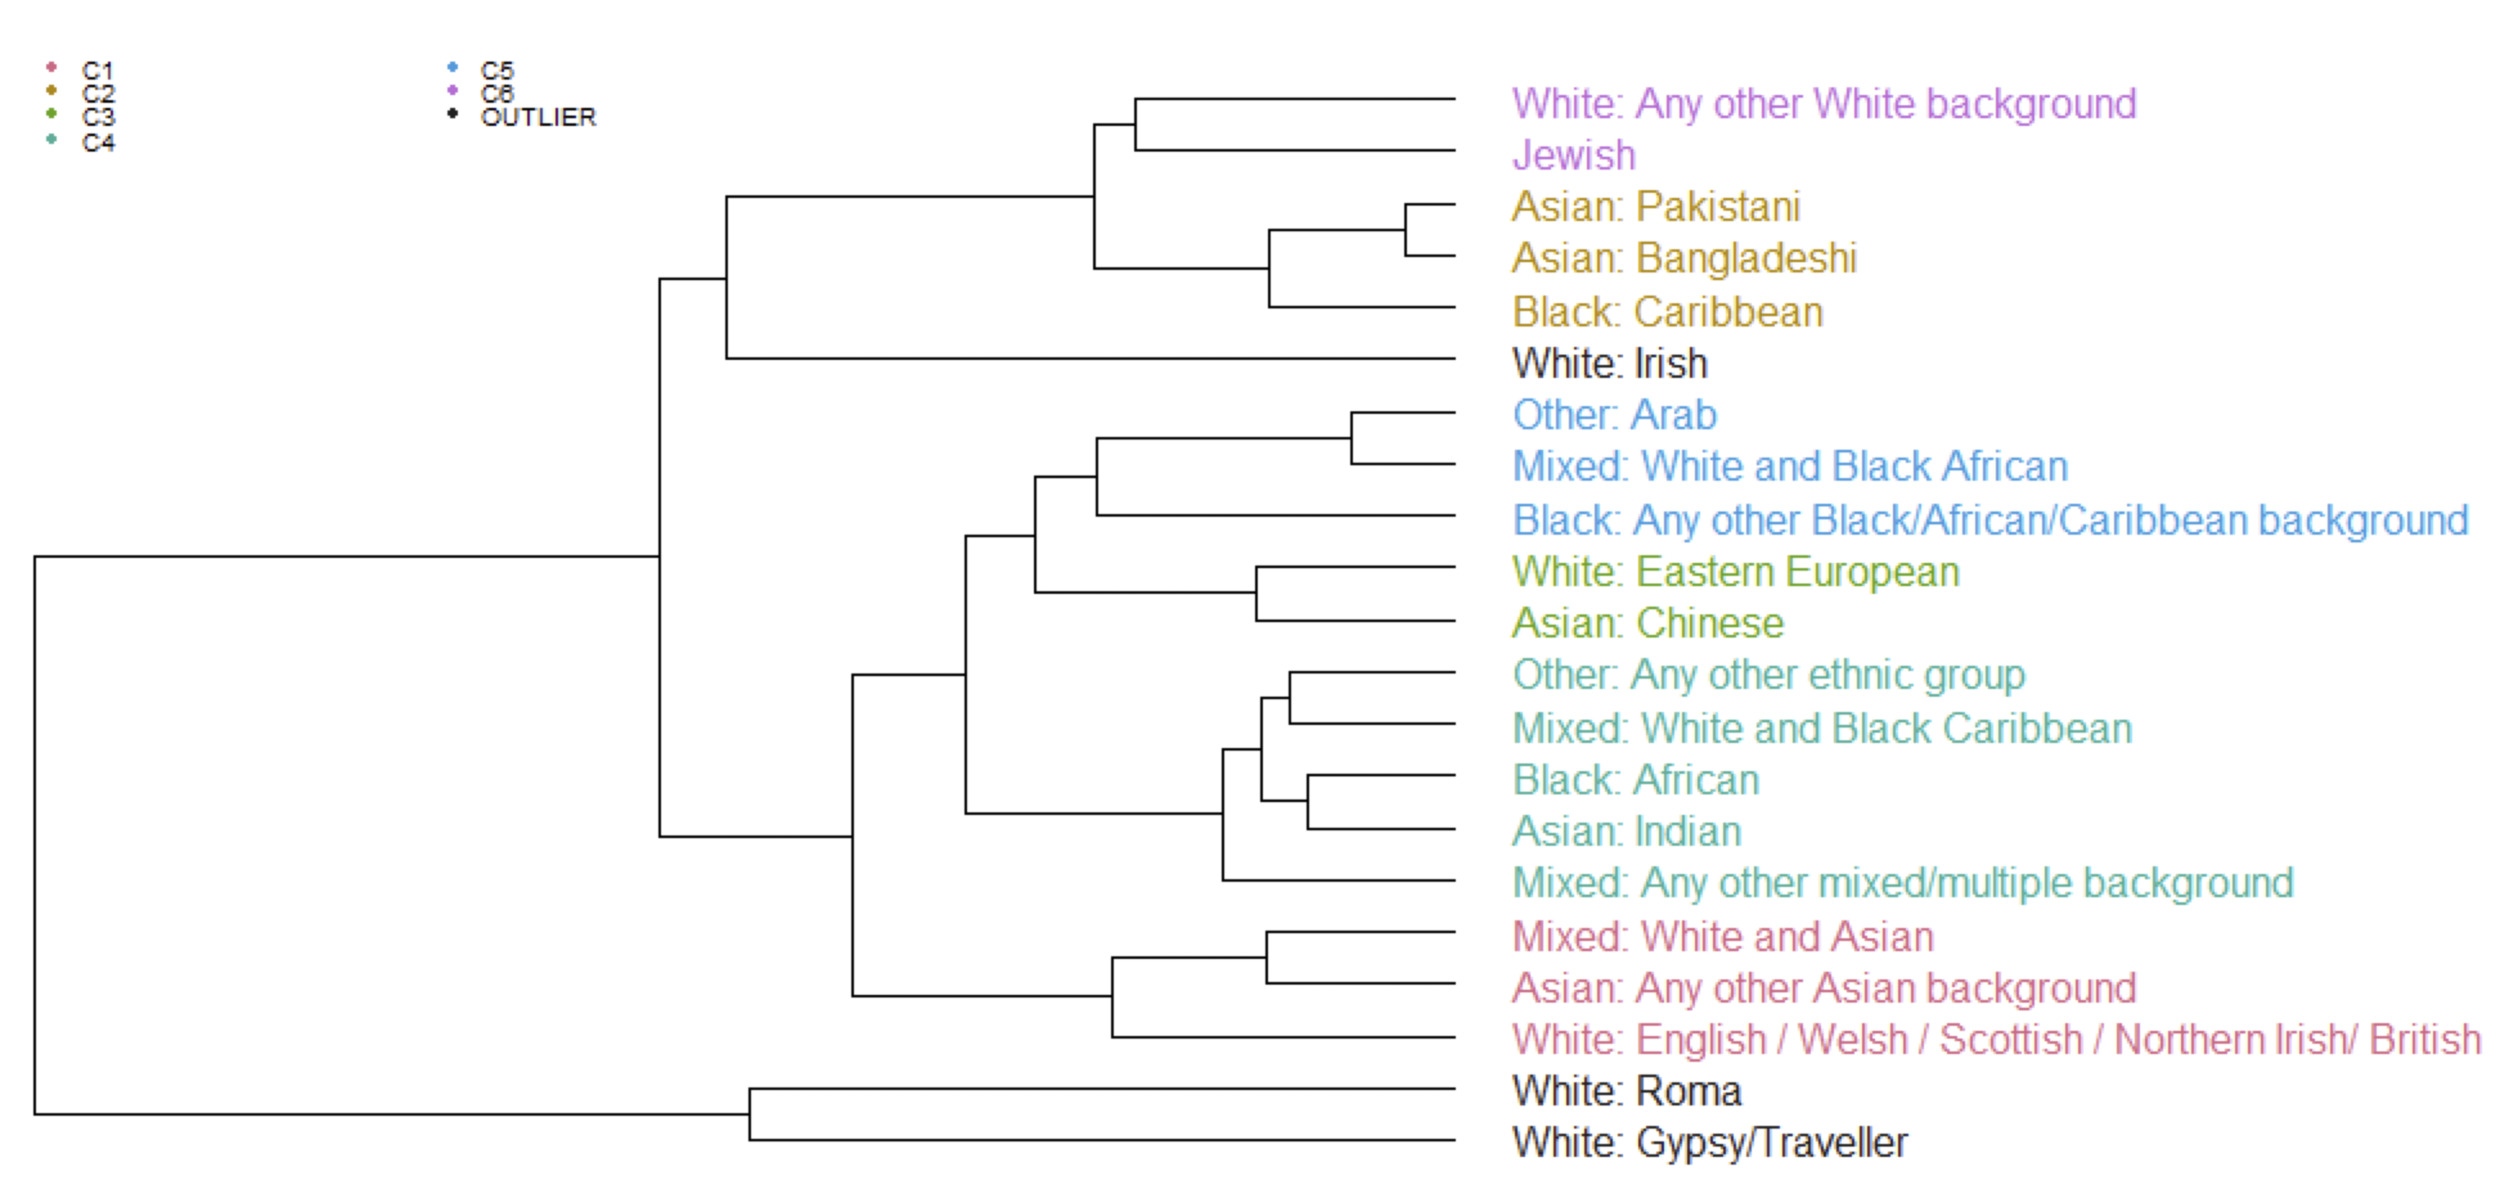
To evaluate our second question, we cluster ethnic communities based on similarity of reported recruitment sources. We compute tag prevalence as the proportion of respondents in each ethnicity reporting each tag, producing an ethnicity x tag prevalence matrix. We apply a Hellinger transformation and compute pairwise Euclidean distances in this transformed space. For each ethnicity, we compute the median distance to its k nearest neighbors and flag outliers using a robust MAD-based threshold (IQR fallback if MAD is zero).[13] Hierarchical clustering is then fit excluding outliers, using Ward.D2 linkage on Euclidean distances in Hellinger space, and visualized via an exploratory dendrogram to assess maximum cluster size. We select the number of clusters by searching over feasible cuts enforcing a maximum cluster size of 5 and minimum of 2, choosing the solution with the best mean silhouette satisfying these constraints.
3. Results
3.1. Prevalence of recruitment pathways in EVENS
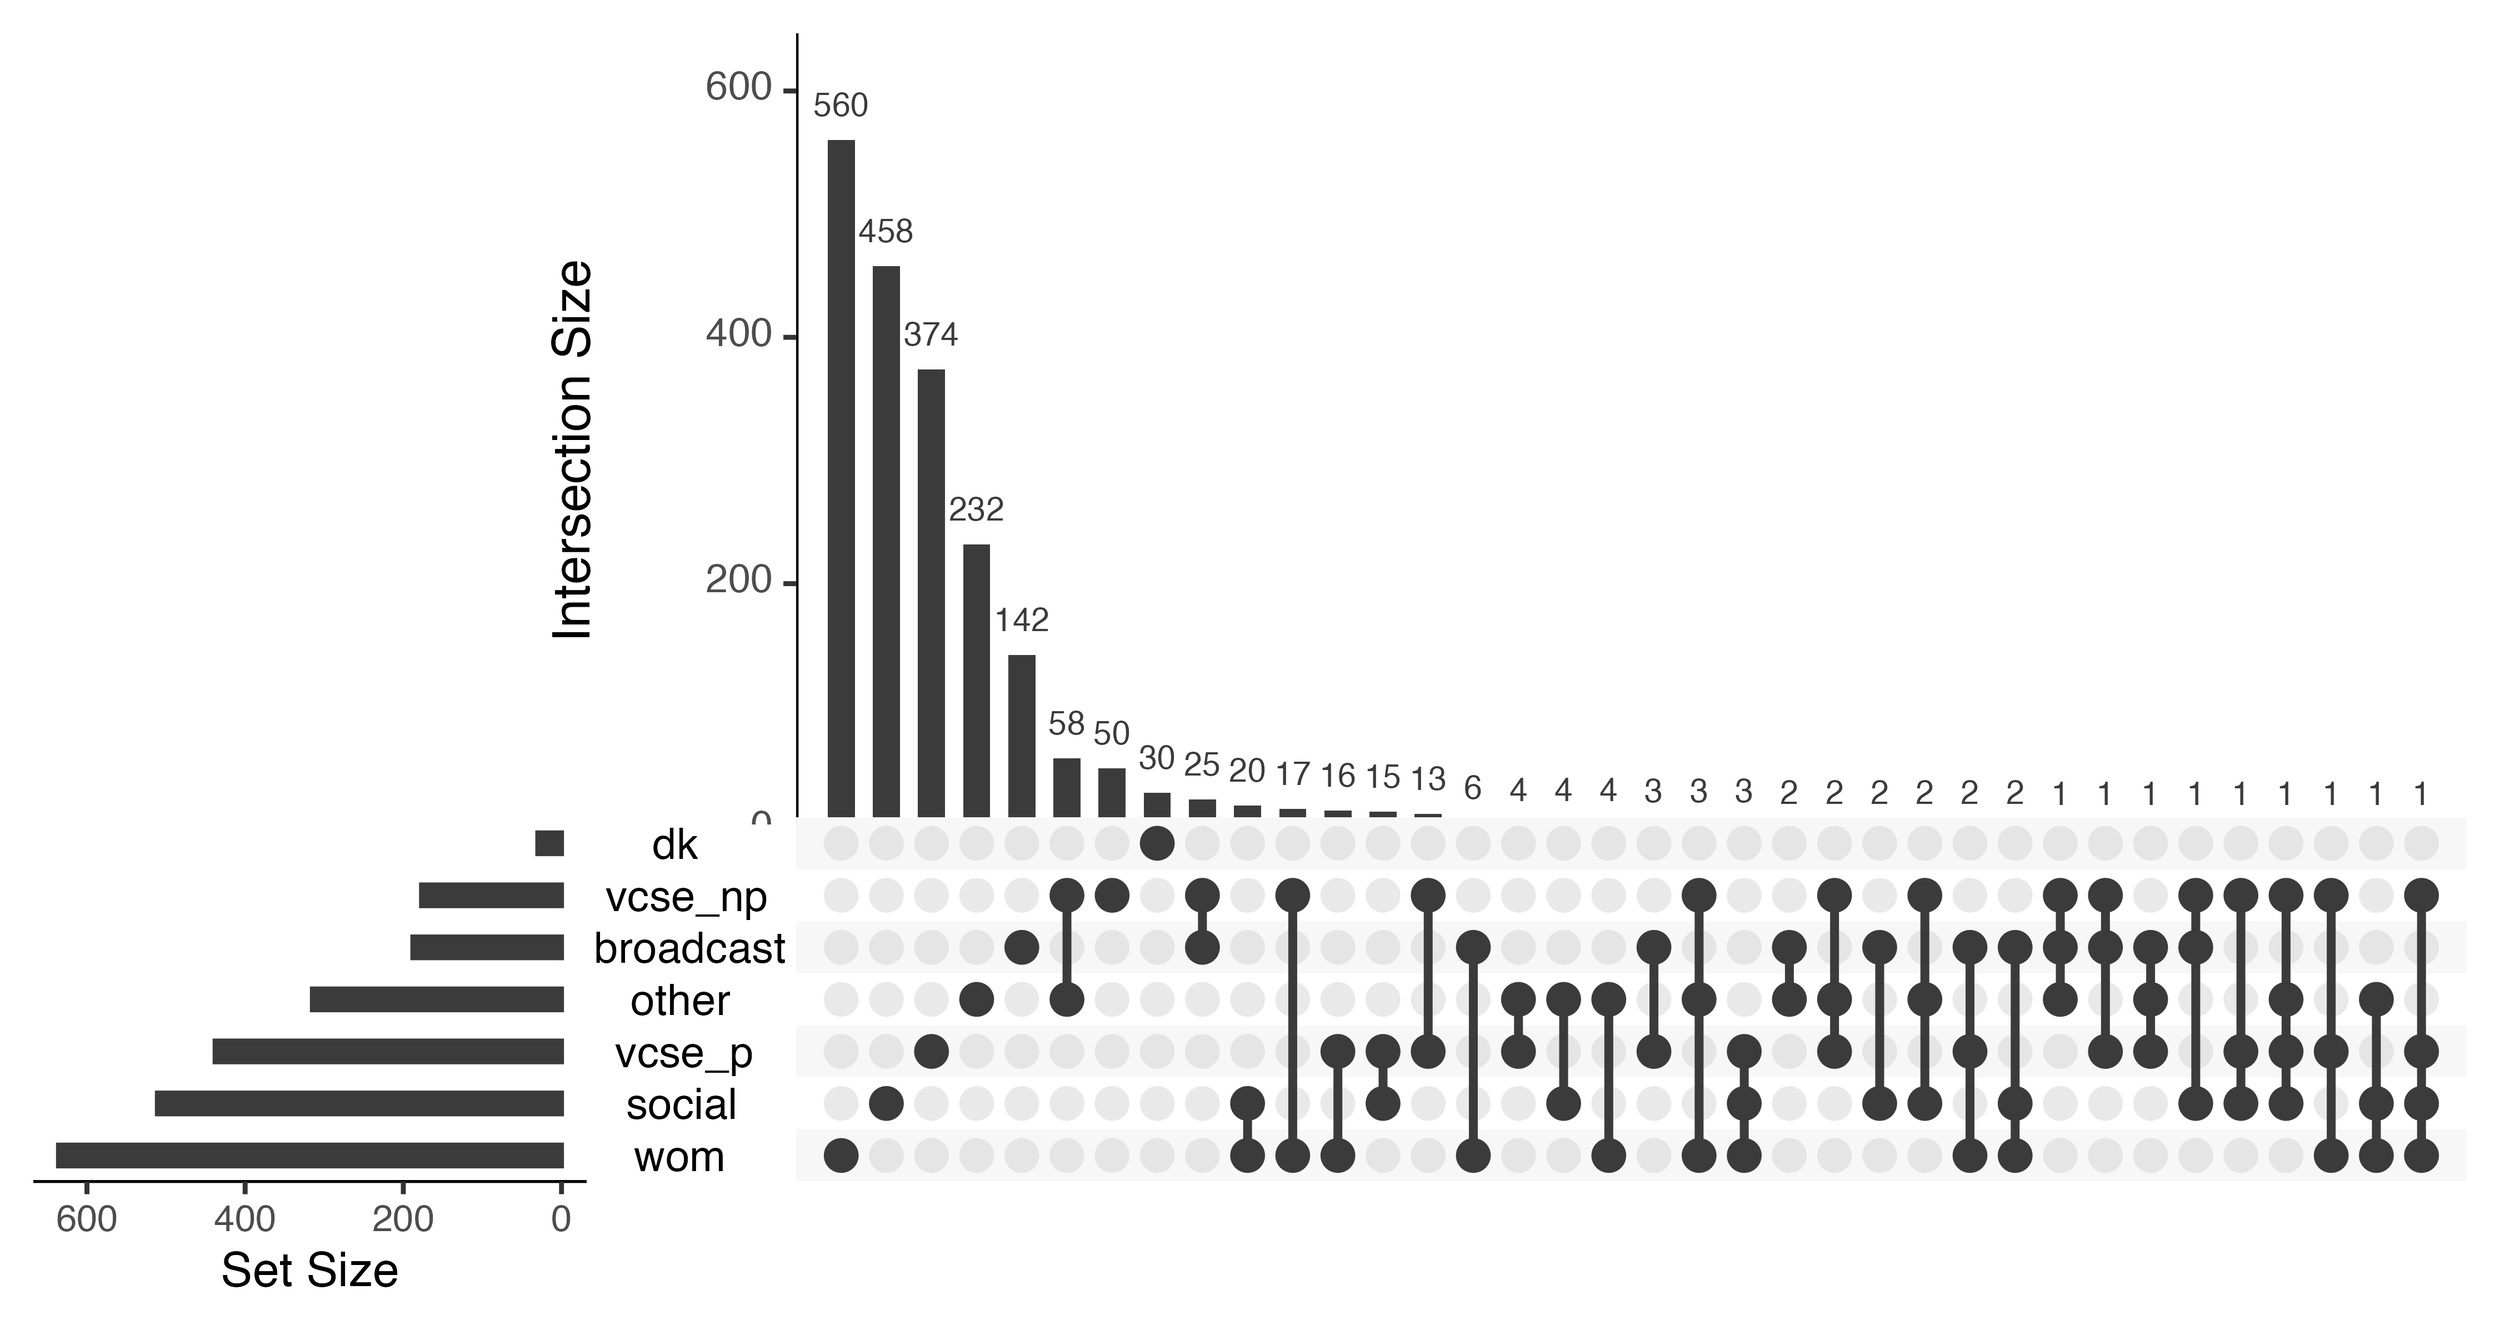
Figure 2 shows self-reported sources of survey recruitment. Each vertical bar represents a specific combination of recruitment pathways (e.g., respondents reporting both social media and word-of-mouth). The taller the bar, the more often that particular route (or mix of routes) was mentioned. The connected dots underneath show which pathways are included in each combination. Some participants were reached through multiple channels at once, while others reported recruitment through a single, distinct source. Horizontal bars indicate the overall prevalence of specific recruitment pathways.
_in_evens_open_web_sample.jpg)
Our analysis of recruitment pathways indicates, first, that respondents identify survey recruitment primarily from single sources, especially word-of-mouth. However, VCSEs (cumulatively across partner and non-partner organizations) marginally surpass word-of-mouth as single reported sources (975 vs. 964 total responses respectively). We consider these results conservative of the impact that VCSE collaboration had, as the VCSE partner recruitment activity incorporated approaches across the questionnaire item response options (including word-of-mouth). Given data constraints, we cannot accurately determine the extent of sample recruitment directly attributable to partner versus non-partner organizations. The true prevalence is likely substantially higher than reported.
While multiple sources of recruitment are reported, their absolute frequency is low — of the respondents included, only 9 percent reported multiple recruitment pathways. However, ethnic group analysis indicates this is not ubiquitous across ethnicities – we find, for instance, that those identifying as Jewish reported a broader mix of sources.[14] This supports similar results indicating that following direct emails from partner organizations, multiple self-reported recruitment routes were the most likely source of recruitment (FRA 2019). From this analysis two conclusions can be drawn: first, that VCSE recruitment activity drove the generation of EVENS’s open-web sample of minoritized populations, surpassing the success of social and other media activity; second, that allowing VCSEs to operate bespoke and dynamic recruitment approaches was crucial to this success but poses a challenge for survey researchers in terms of how to record and monitor recruitment activities and their effects.
3.2. Patterning of recruitment pathways by ethnic group
Turning to our analysis of whether the use of (combinations of) recruitment pathways was similar across ethnic groups, Figure 3 shows a discernible clustering of minoritized subgroups into combinations that share similar recruitment patterns.
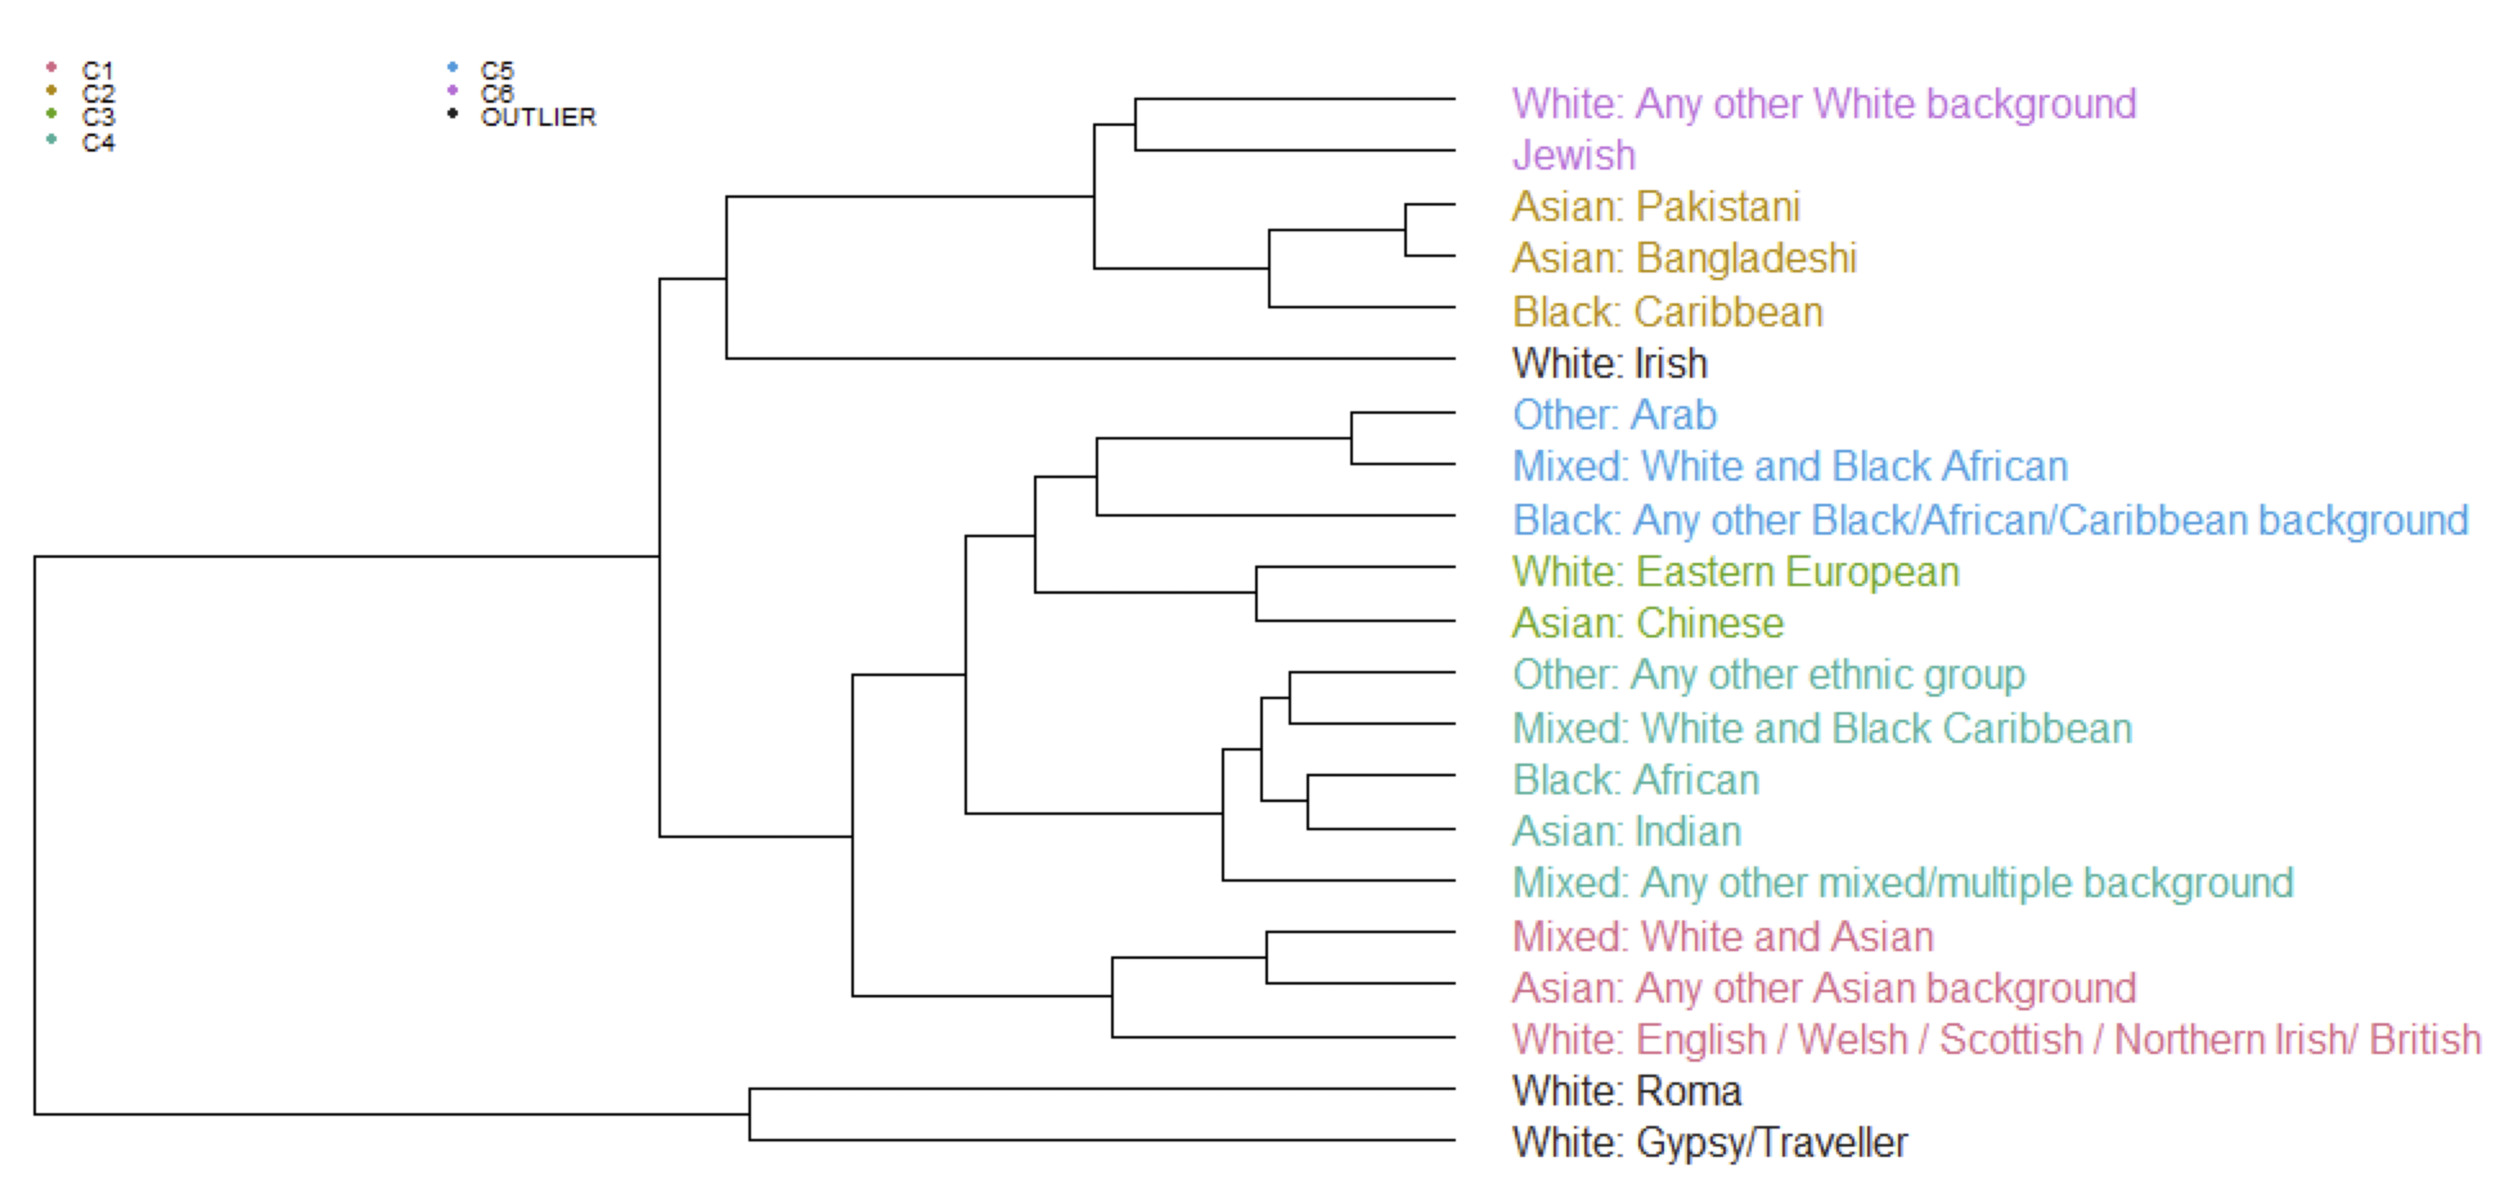
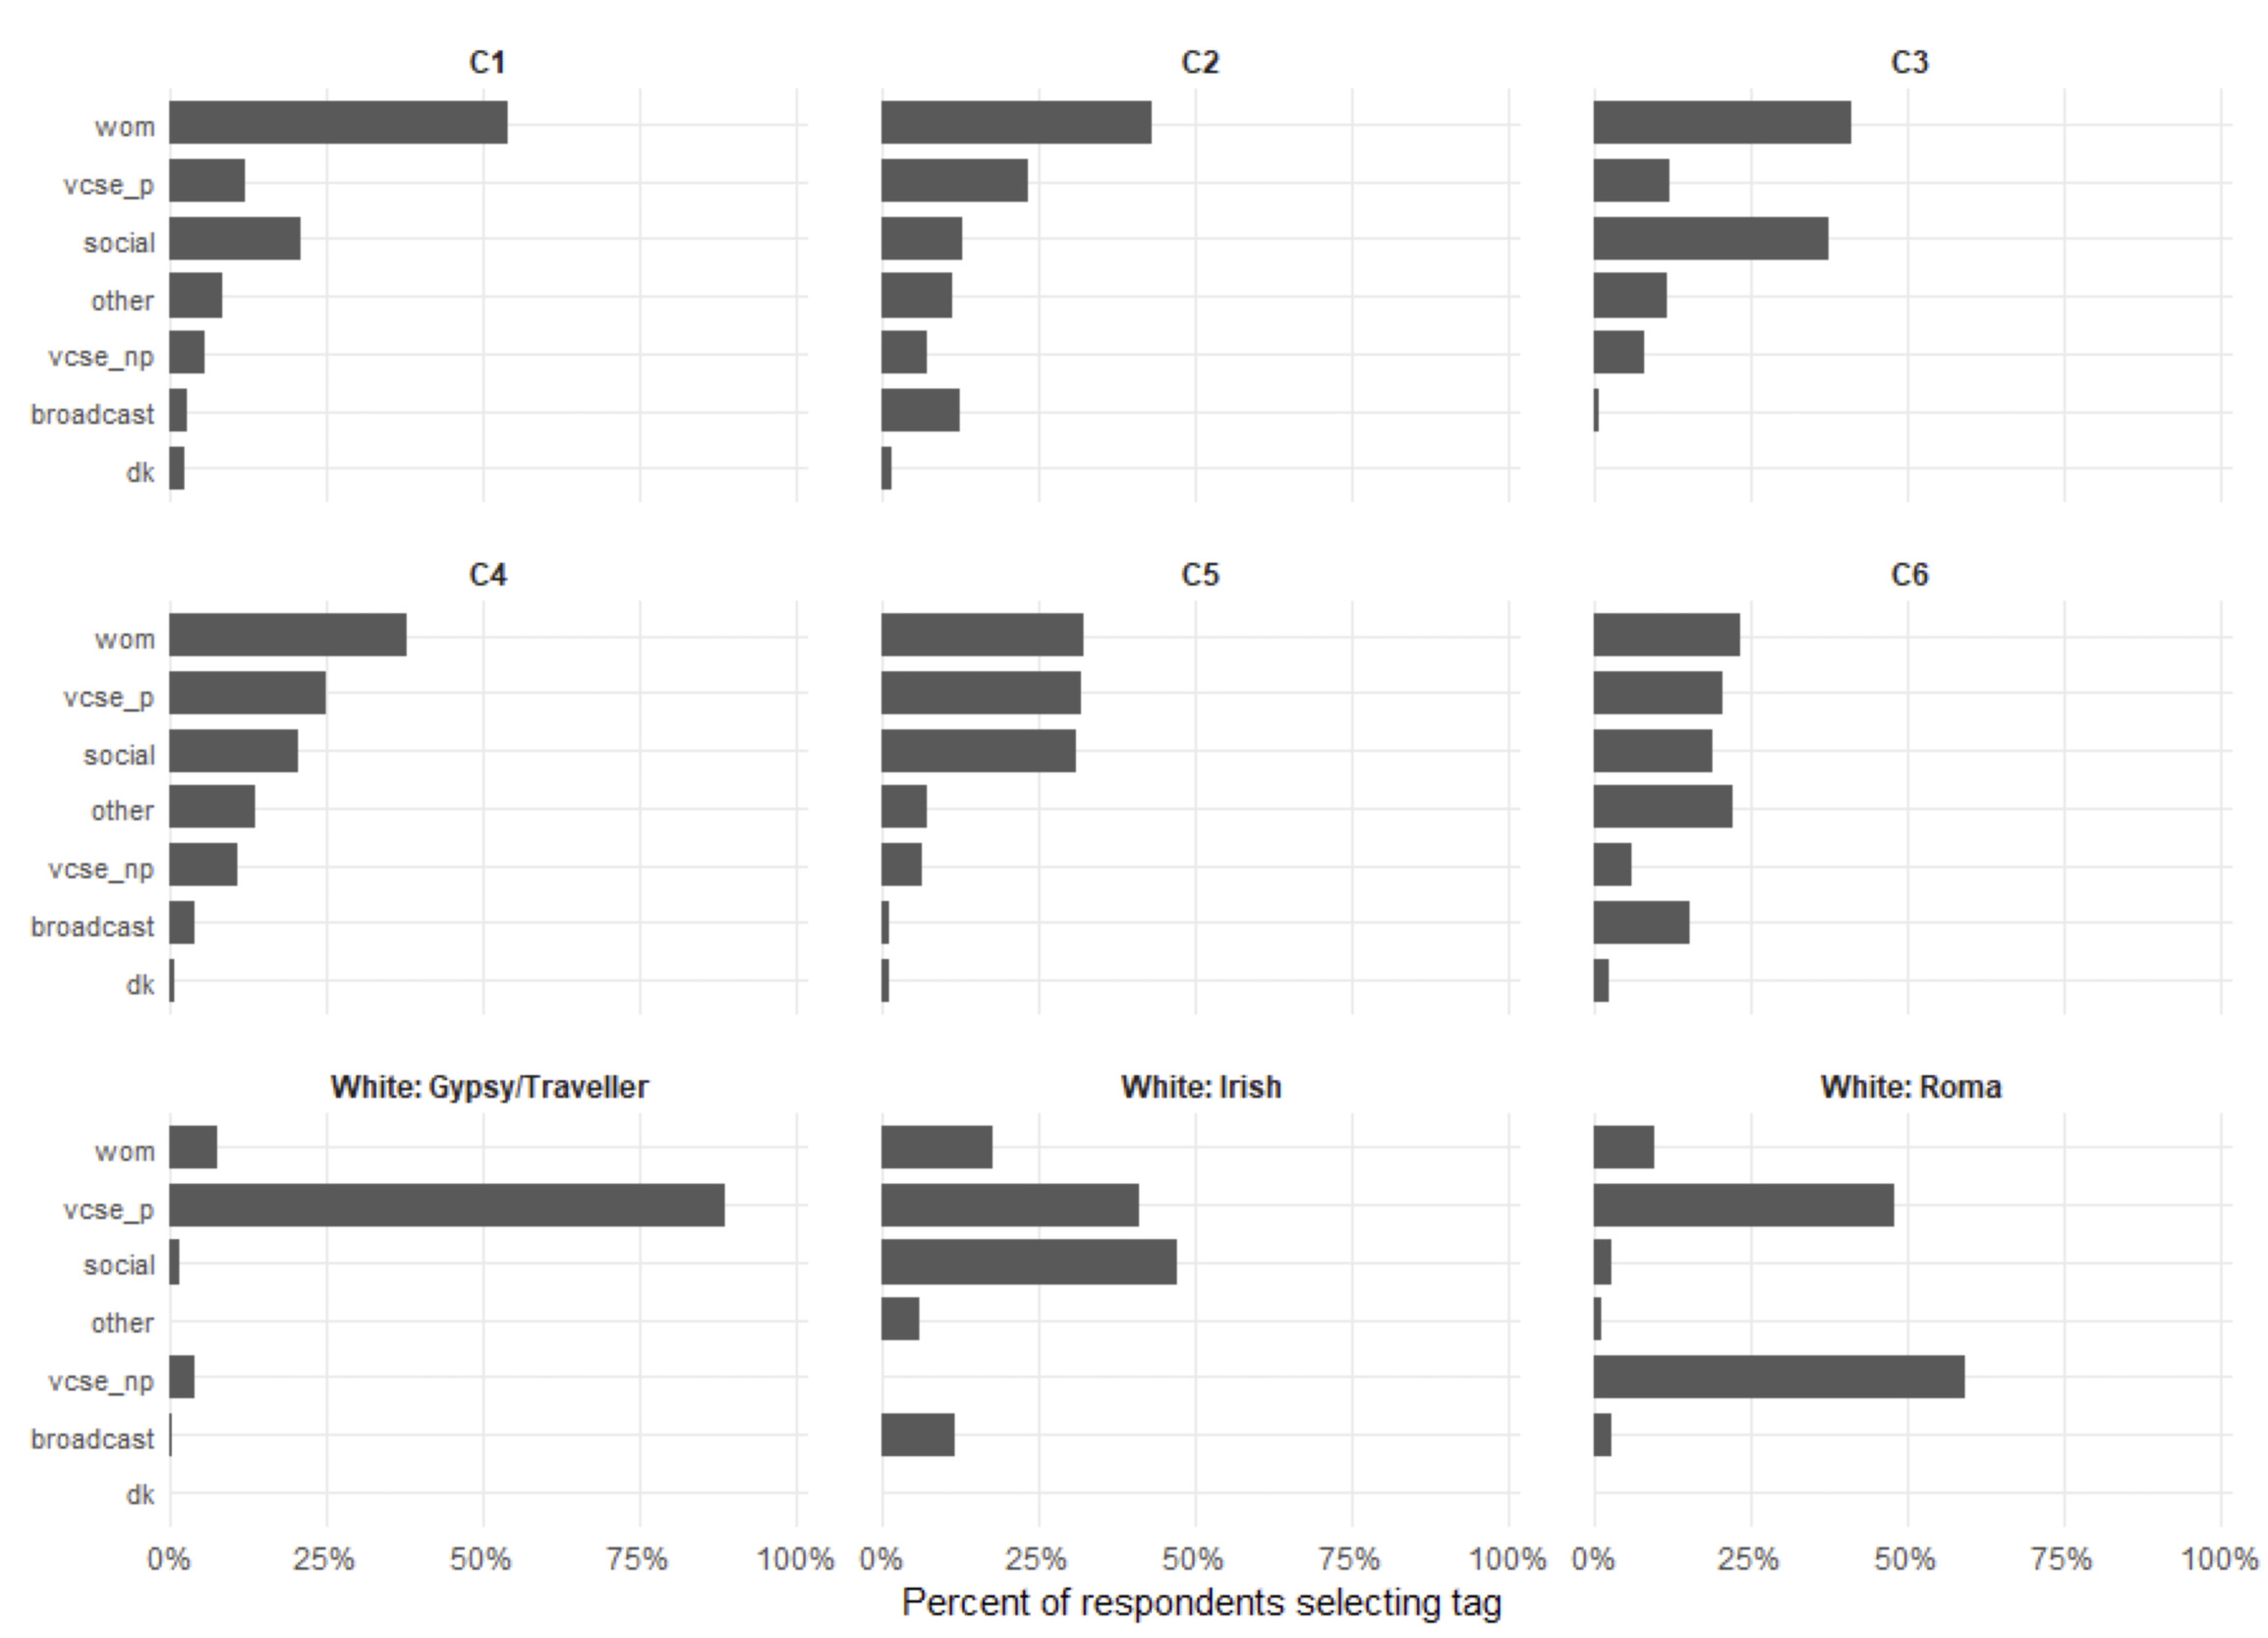
Figure 4 details dominant recruitment pathways in each ethnic cluster. Bars indicate categorized recruitment pathways within each cluster—e.g., social media, VCSEs; percentages indicate within-group route contributions. Larger values indicate which recruitment method was more influential per cluster.
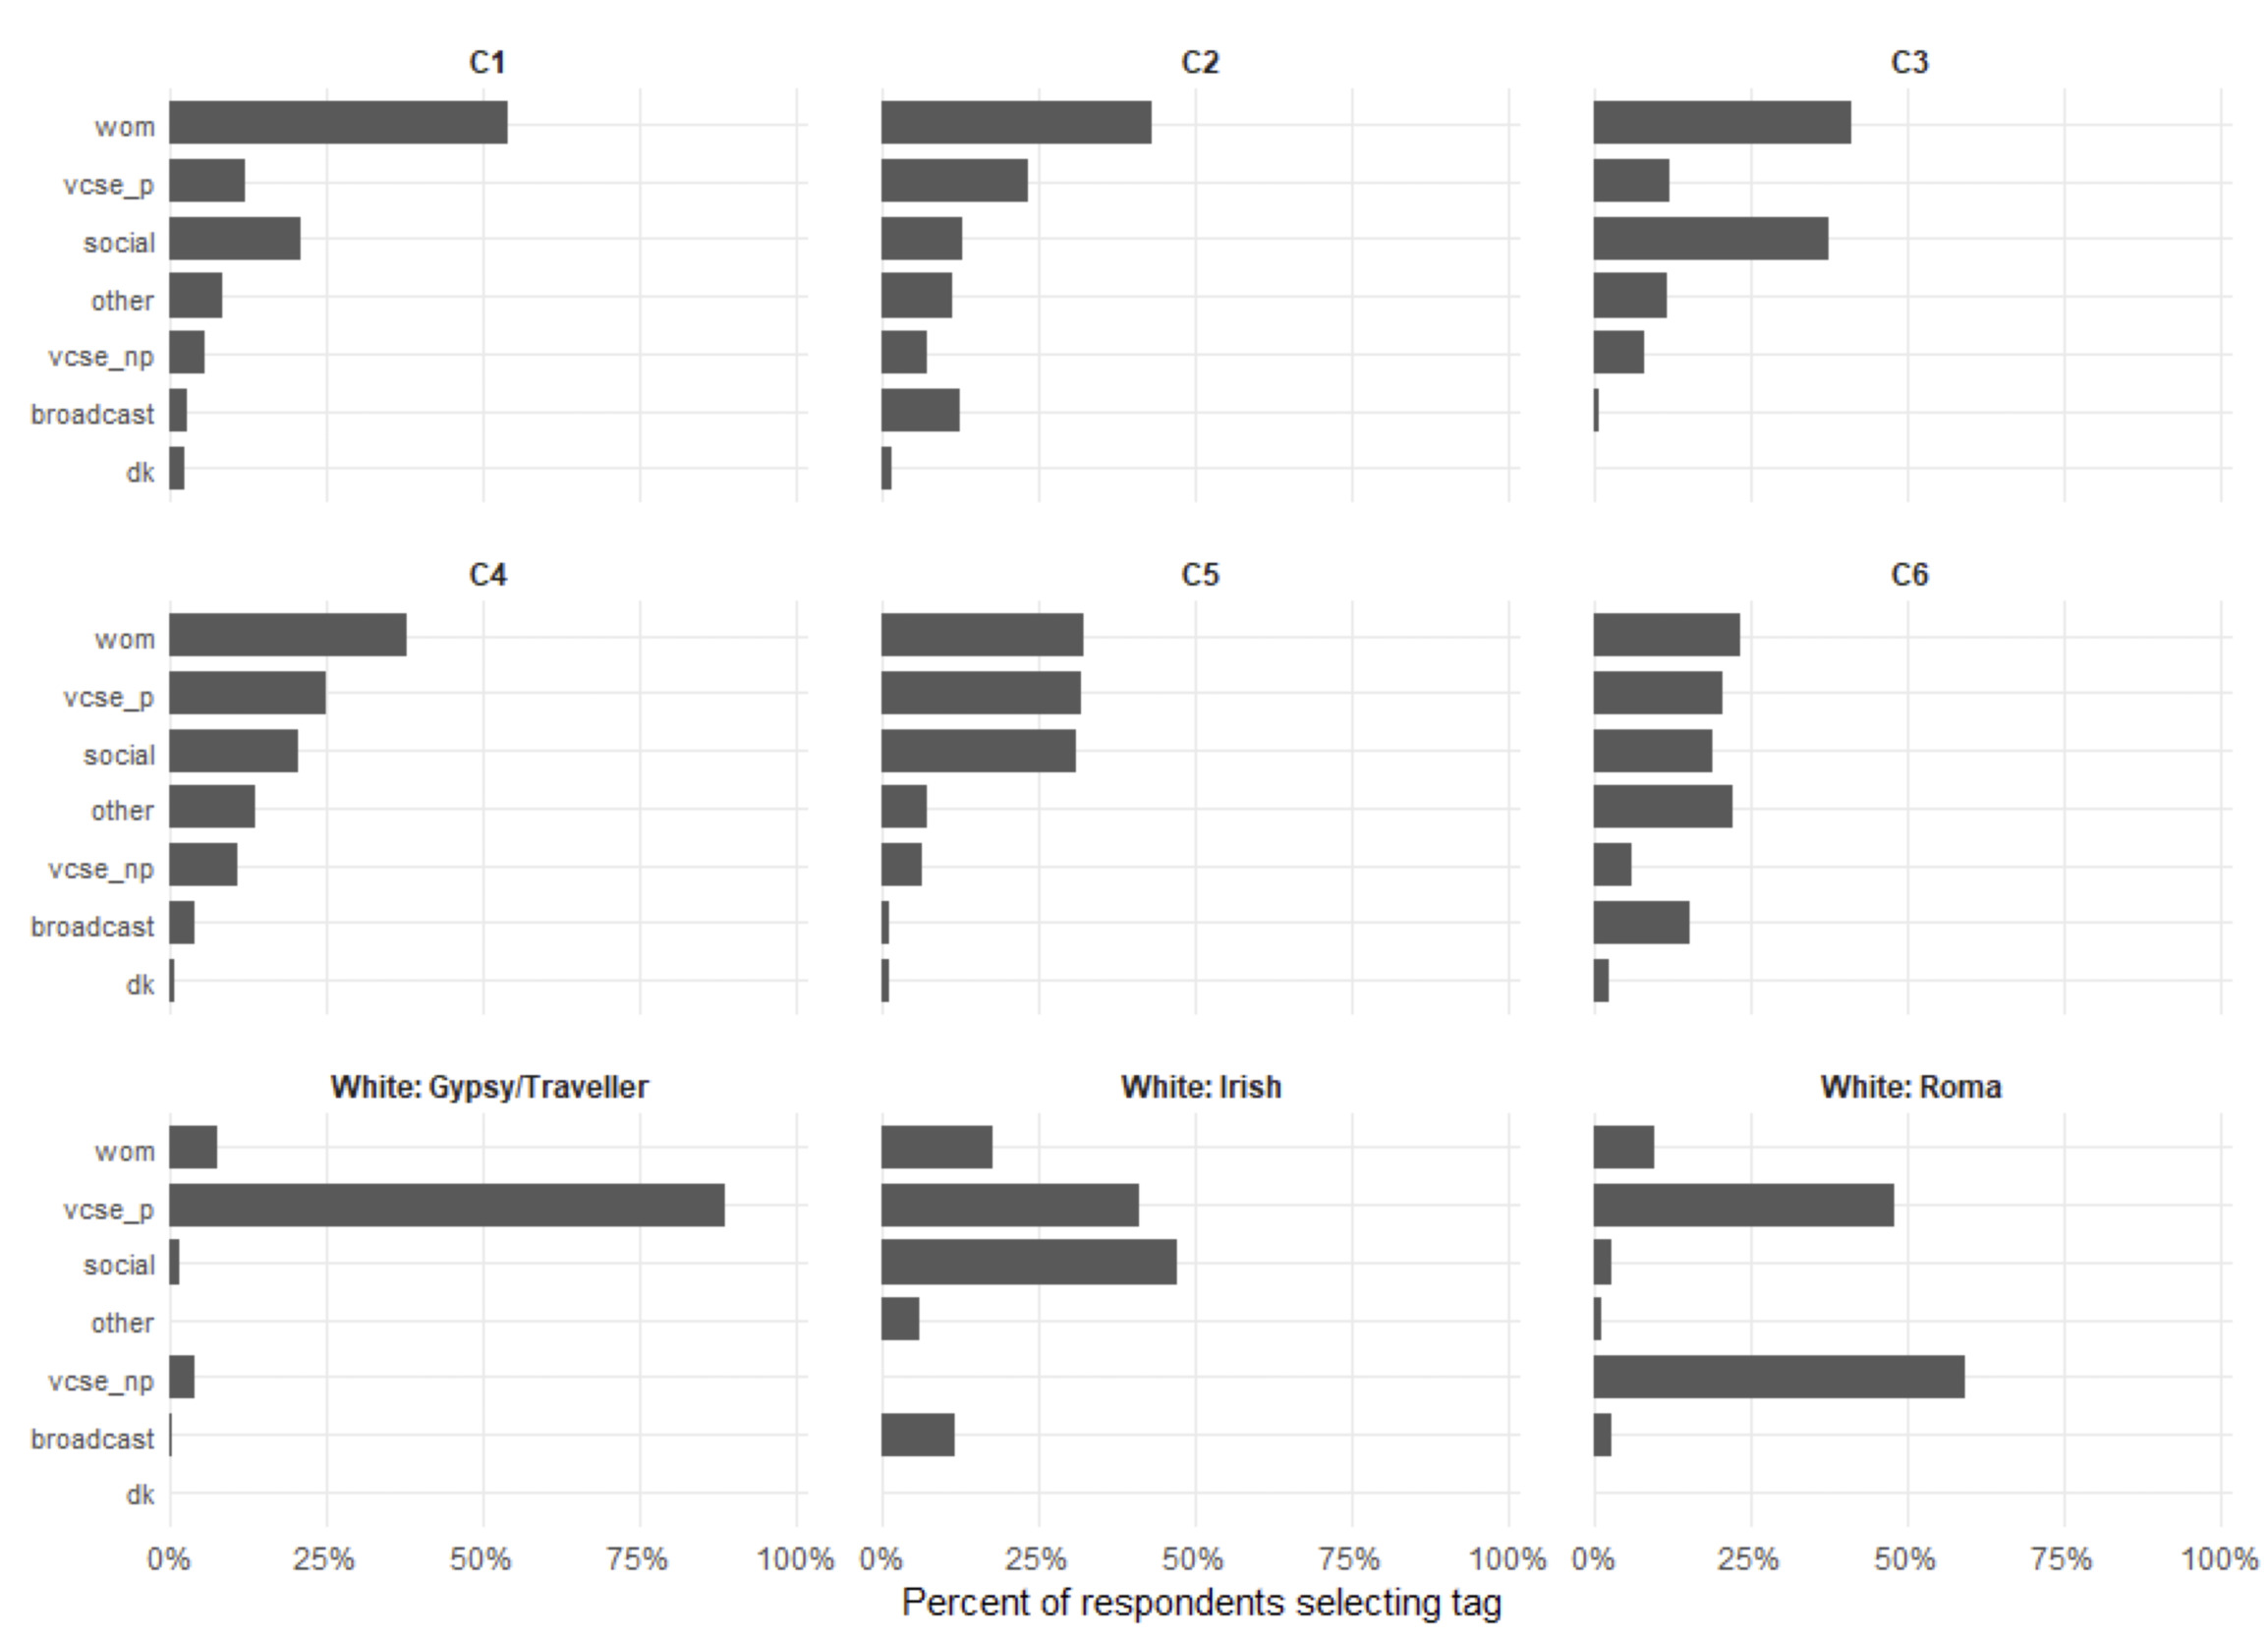
Across ethnic group clusters, word-of-mouth was the dominant recruitment pathway. The high reliance on word-of-mouth for cluster 1 is notable. Social media as a pathway to survey recruitment is particularly prominent for cluster 3 and the ethnicity group White: Irish. Cluster 6 is distinctive in reporting a relatively balanced mix of recruitment sources, with a comparably higher proportion reporting use of broadcast media and other information. Clusters representing Gypsy, Traveler and Roma participants (outlier clusters) are characterized by the dominance of VCSE activities for recruitment – reflecting recruitment to adaptations for this group.
Our subgroup analyses of recruitment pathways indicate that certain recruitment approaches were favored, or successful, differentially across ethnic groups. This may reflect community predisposition towards certain engagement methods and/or VCSE partner emphasis on specific recruitment approaches for particular minoritized communities. However, allowing for variation in recruitment methods across communities enabled EVENS to achieve a diverse and large sample of ethnic and religious minorities via its open-web channel.
4. Discussion
Our findings leave us with recommendations and questions. For studies of minoritized populations, at any scale, flexibility in recruitment is essential to reflect the unique positionalities of target populations. The recruitment stage (and methods thereof) deserves determined interrogation in both design and reporting – particularly for minoritized/hard-to-reach populations using nonprobability approaches, as it is the critical component of sample achievement.
Exploring recruitment outcomes when community organizations representing underrepresented groups lead sample recruitment within their respective communities demonstrates the centrality of VCSE activity and (associated) word-of-mouth. This supports the potential of community partnership for diverse, large-N recruitment of minoritized populations. Moreover, allowing community partners flexibility in their methods of recruitment (e.g., in-person events) proved vital to engaging minority communities. We also found that particular recruitment pathways were dominant with certain ethnic groups, supporting the argument for the need for community-specific recruitment methods.
We take away from our analyses that the role of recruitment monitoring and analysis should be foregrounded in design and reporting. This provides diagnostic evidence to determine the relative contribution of recruitment efforts, contributes to the development of recruitment methods tailored to hard-to-reach and minoritized groups, and supports existing recommendations on nonprobability reporting. Far more effort appears to have been made in validating stakeholder involvement in instrument development compared to recruitment. Ultimately, we propose that to strengthen the evidence base for community-led recruitment, there is a need for (a) operations (e.g. monitoring) and/or questionnaire items to provide the measurement options for analyses; (b) studies to analyze and report those measures; and (c) (ideally) a controlled environment to allow examination of whether recruitment profiles are a function of recruiter preferences and capacities, or the preference for / receptivity to, and availability of, recruitment routes amongst minoritized groups themselves – and quite possibly a combination.
Our clustering analysis reveals a distinctive pattern to recruitment routes, with ethnicity categories roughly embedded in their macro-level categories (e.g., Asian or Asian British).[15] While recruitment routes did work in tandem for some respondents, singleton routes predominate. While the size of the achieved sample for the EVENS study attests to the benefit of collaborating with VCSEs, our analyses suggest more work should be incorporated into these partnerships to explore effective mechanisms – e.g. how and for whom different recruitment pathways achieve large and useful samples in VCSE-led recruitment.[16] In lieu of bespoke research agendas, intentional inclusion and reporting of select all that apply recruitment sources would greatly assist in building our understanding.
5. Conclusion
Against the backdrop of diminishing financial resources and rising expectations of online self-complete modes, nonprobability approaches are increasingly being used as cost-effective alternatives to ‘expensive’ probability-based approaches. This is especially prevalent for studies of minoritized populations. Given that these approaches lack the ‘safety net’ of error estimation available for probability-based approaches, researchers must maximize the available sample information. Understanding the mechanism of recruitment underlying achieved samples constitutes a core element of reporting. However, we argue that this remains insufficiently addressed.
While probability studies have benefited from a wealth of statistical research towards overcoming the errors introduced throughout the survey pipeline, abundant room exists for nonprobability approaches to develop parallel tools and approaches. Additionally, we note the usefulness of this study and others which explicitly focus on reporting recruitment outcomes by detailed pathways (e.g., Bartholmae et al. 2022; Pérez-Muñoz et al. 2022, and Vu et al. 2021 for small population/clinical studies; Alhassan et al. 2026; FRA 2019; 2025 for larger populations).
On this basis we offer three recommendations for survey researchers working with minoritized populations. First, remain aware of differential mode responsiveness. Recruitment channels that work for one community may underperform for another; our clustering shows this variation is patterned, not noise, and budgets, timelines, and ethics protocols should anticipate it. Second, treat word-of-mouth as core infrastructure, not a backup. This remained the dominant or co-dominant route, suggesting early investment in trusted intermediaries, rather than reliance on broadcast or panel channels alone, is a driver of successful recruitment. Third, design recruitment for flexibility, and document — even if not centrally controlling — the channels partners use. The productive mix of recruitment modes is unknowable a priori, and rigidly standardized single-mode strategies risk systematic exclusion of the populations such studies aim to reach. Light-touch documentation (e.g., select-all-that-apply recruitment-source items at the respondent level) preserves partner autonomy while enabling the kind of post-hoc diagnostic analysis presented here. Together, these point toward a recruitment-stage analogue to the diagnostic standards already expected at the instrument-design stage.
Corresponding author contact information
Daniel Horn, dmh23@st-andrews.ac.uk
Funder acknowledgement
This research was funded by UK Research and Innovation via the Economic and Social Research Council project *Inclusive Survey Futures: building on EVENS to improve representation, robustness and feasibility of web-based social surveys (*Grant APP38722).
Bécares et al. (2025) find that approximately 9 percent of Chinese respondents reported an increase in unfair treatment during the pandemic, the highest of any group—likely due to COVID-19-related scapegoating; 32 percent of Roma respondents, and 23–27 percent of Black Caribbean and “Black Other” respondents, reported increased racism; 23 percent of both Jewish and Gypsy/Traveler respondents also noted higher levels of unfair treatment during the period.
A key argument in favour of nonprobability approaches which engage with community stakeholders is the proposition that such engagement is able to attenuate low levels of trust across hard-to-reach groups, as well as possible negative beliefs, by incorporating trusted persons and/or organizations to (a) reach respondents who are out-of-frame and (b) better entice participation once contacted.
Documented in Finney et al. (2023); Bécares et al. (2025)
In all, EVENS achieved a total sample of 14,221 respondents – non-panel n=3,406, panel = 10,815. We are concerned herein with only the recruitment activities in the open promotion segment of the non-panel sample generation process.
The EVENS study consisted of a strategy of multiple recruitment samples, derived from: (1) open promotion recruitment (light blue) which consisted of both open web registration and RDS referrals; (2) direct VCSE email campaigns conducted by VCSEs, as well as community-based interviewer recruitment (Friends, Families and Travellers (FFT) partner VCSE) (green); (3) online panel recruitment via Ipsos MORI (opt-in) i-Say (IIS) panels, Ipsos MORI (random) Knowledge Panel, and Prolific (opt-in) web panel (orange).
EVENS Voluntary, Community and Social Enterprise (VCSE) sector partners were: Black & Ethnic Minority Infrastructure in Scotland (BEMIS), Business in the Community, Ethnic Minorities and Youth Support Team (EYST), Friends, Families and Travellers (FFT), Migrant Rights Network, Muslim Council of Britain, NHS Race and Health Observatory, Operation Black Vote, Race Equality Foundation, Stuart Hall Foundation, The Runnymede Trust, The Ubele Initiative.
VCSE outreach and interactions can span a wide range of activities including, but not limited to, formal group events, informal gatherings, drop-in sessions and so forth. Each VCSE therefore has a set of activities which may be similar to others but are wholly dependent on their own adaptations to reach their constituent communities.
As an example, to engage Gypsy, Roma, and Traveler participants, a mixed-methods approach was adapted. To overcome challenges of literacy, digital engagement, and trust of data collectors, the research team worked with the partner organization Friends, Families and Travellers (FFT) to implement in-person fieldwork, conducted by peer-researchers. Specifically, FFT recruited peer-researchers, who were trained by the research team to undertake the survey in their communities, using mobile devices. This marks a departure from the other avenues of recruitment but illustrates the fluid nature of work with underrepresented communities.
Recruitment source item: “Before we start, how did you hear about the study?”; select all that apply; 20 options and 1 ‘other’ option. Respondents from panel and direct VCSE routes did not receive this item.
A portion of our sample is derived from respondent driven sampling (RDS); we remove these respondents from our analyses to simplify interpretation – providing us with only respondents considered as primary respondents. This leaves an analysis sample of 2783 individuals.
Response options (direct n=21, write-in n=27) are collapsed into 7 core categories for analysis — word-of-mouth: wom (option); Partner VCSEs: vcse p (consolidated options); Non-partner VCSEs: vcse np (consolidated options); Traditional media: broadcast (consolidated options); Social media: social (option); other (option); Don’t know (option). As this item was a select all that apply response, we allow for categories to co-exist, allowing us to explore the combinations of sources of recruitment. More details available in the UKDS dataset online.
The UpSet plot takes the unique route categories (i.e., VCSE, word-of-mouth (wom), broadcast media (broadcast), social media (social), other, don’t know (dk)) and presents three metrics: (1) vertical bars representing the frequencies of specific route category intersections, (2) horizontal bars representing frequencies of unique route categories, and (3) a dot matrix indicating in which intersections route categories occur. Lex et al. (2014) introduced UpSet as a novel visualization technique for quantitative analysis of sets and their intersections. Ballarini et al. (2020) demonstrate the utility of UpSet plots in visualizing overlapping subgroups of patients in a clinical trial setting.
We primarily use the median absolute deviation (MAD) to set an outlier threshold because it is robust to extreme values. In some groups, however, many observations take the same (or very similar) value, which can make the MAD equal to zero and therefore unusable for setting a threshold. In those cases, we fall back to the interquartile range (IQR)—the spread of the middle 50% of values—because it still provides a stable measure of typical variability and allows us to apply a conservative, robust outlier rule (Leys et al. 2013).
Results available on request.
We have intentionally omitted representivity indicators at this level of detail (e.g., R-Indicators). Primarily, and ironically, as the sample numbers needed to run our choice R-Indicator analysis are too small to provide useful information at the cluster or individual recruitment route level.