U.S. presidential elections are under scrutiny, not only because of their political influence but also because of pollsters’ performance. The results of the U.S. 2016 election came as a shock. Hillary Clinton had the highest share of voting intention in almost all the polls published in the last 10 days of the campaign (Kennedy et al. 2017), and aggregators gave her a 70% to 99% probability of winning the election against Donald Trump (Messing 2018; Westwood et al. 2020). She managed to get almost two percentage points more votes than Donald Trump, a share close to the average of the late campaign polls but did not win the Electoral College. Therefore, the polls were not that bad but were considered so because they did not predict the winner. This left the impression that the pollsters had done a poor job.
Most subsequent analyses of campaign polls nonetheless stressed the necessity for pollsters to review their methods. The emphasis was on the fact that most pollsters had not adjusted their data using the education level, which was considered a major factor in the underestimation of the Trump vote (Kennedy et al. 2017).
Therefore, one is not surprised to find that, before the 2020 electoral campaign, articles stressed the changes made by “the pollsters”, including the use of adjustment for education level (Keeter et al. 2020; Kennedy et al. 2023; Skelley and Rakich 2020). However, a major change in the share of various modes of administration had also occurred, a change that had mostly gone unnoticed.
In the 2020 election, the pollsters did forecast the winner, Joe Biden, but this was because the polls were substantially biased in favor of the Democrats. Indeed, the polls were much more biased (+3.9 percentage points for the Democrats) than in 2016 (+1.3 points), the worst performance since the 1980 presidential election (Clinton et al. 2021; Keeter and Kennedy 2024), with significant discrepancies across modes of administration (Clinton et al. 2021; C. Durand 2023; C. Durand and Johnson 2021). This means that the changes that occurred were not efficient or that “the pollsters” referred to a different pool of pollsters than in 2016. It could be that the pollsters who were present in 2016 improved their methods, but that this improvement was cancelled out by the presence of new pollsters who used different methods.
Given the poor performance in 2020, changes occurred again in 2024, in terms of adjustment for declared previous voting behavior, as well as in terms of modes of administration. The electoral campaign started with a rather high level of confidence in pollsters because they had performed well in the 2022 midterm elections (Keeter and Kennedy 2024). This time, the pollsters predicted a close contest, and it indeed was so.
The main goal of this study is to assess what happened in terms of pollsters’ presence and methods, more specifically, modes of administration, between the 2016 and 2024 U.S. presidential elections. Did the same pollsters change their methods, did the pool of pollsters change altogether, or both? The methods used are a pollster’s issue. Therefore, to answer this question, this study traces the trajectory of pollsters and the mode of administration they used across the three elections, providing a longitudinal perspective on U.S. electoral polling. In addition to identifying how pollsters entered, exited, or adapted their methods using various modes of administration, this analysis provides insights into the possible impact of the stability and experience of the pollsters on polling accuracy.
Methodology
The data of all public polls conducted from September 1st to election day at the national level for the three presidential elections were collected, mostly from the Wikipedia pages dedicated to opinion polling in the U.S. presidential elections. The information was validated using other websites, such as 538.com and Real Clear Politics. Media reports and web links to poll reports allowed for the completion and validation of methodological information. Replication data are available on Borealis Dataverse (Claire Durand 2026).
The data comprise the published estimates of voting intention, the date of the fieldwork, and the mode(s) of administration of each poll, together with the identity of the pollster or organization[1] that conducted the poll. The mode is categorized as either live phone interviews, web polls, or mixed modes, the latter comprising various combinations of Interactive Voice Response (IVR), web opt-in, live phone interviews, polls using SMS, and variations of river sampling.[2]
The categories needed to be large enough to have different pollsters in each category to control for idiosyncrasies associated with individual pollsters. Each pollster uses a cluster of methods, making it difficult to determine which features are responsible for the quality of the estimates. Grouping enough pollsters ensures that the results do not depend on one specific pollster’s methods. As Pasek et al. (2025, 73–75) show from pollsters’ answers to a survey of methods conducted after the 2024 election, there is not much variation between pollsters in weighting practices. Close to 82% always weight or adjust their data and 10% more do it sometimes. Among them, 95% always weight for demographics, and 92% always weight for age, education or both. However, there is even greater variation in the sampling frames or sources used by pollsters, some of which are linked to the mode of administration. There are also differences in political weighting according to party ID, past vote, past turnout, and likely voter models. However, the 2016 AAPOR report (Kennedy et al. 2017) showed that there were no differences in estimates related to the use of likely voter models, the proportion of cell phones in live interviewer polls, and the use of river sampling. Therefore, we are confident that having enough pollsters in each category of mode of administration is the best and only way, given the availability of information, to consider variations in methods and cancel out possible other explanations.
The signed poll error is used to examine the possible impact of pollster experience. It is measured by the difference between the Republican candidate’s actual two-party vote share and the polls’ estimate of that candidate’s two-party vote share during the last 10 days of the campaign. Many authors have used a period of 15 days. However, in the three elections (C. Durand 2023; Kennedy et al. 2017; Pasek et al. 2025), there was movement in the last days of the campaigns. Therefore, the longer the study period, the more biased the analysis of the polling accuracy.
Results
What is the portrait of the share of each mode in the elections?
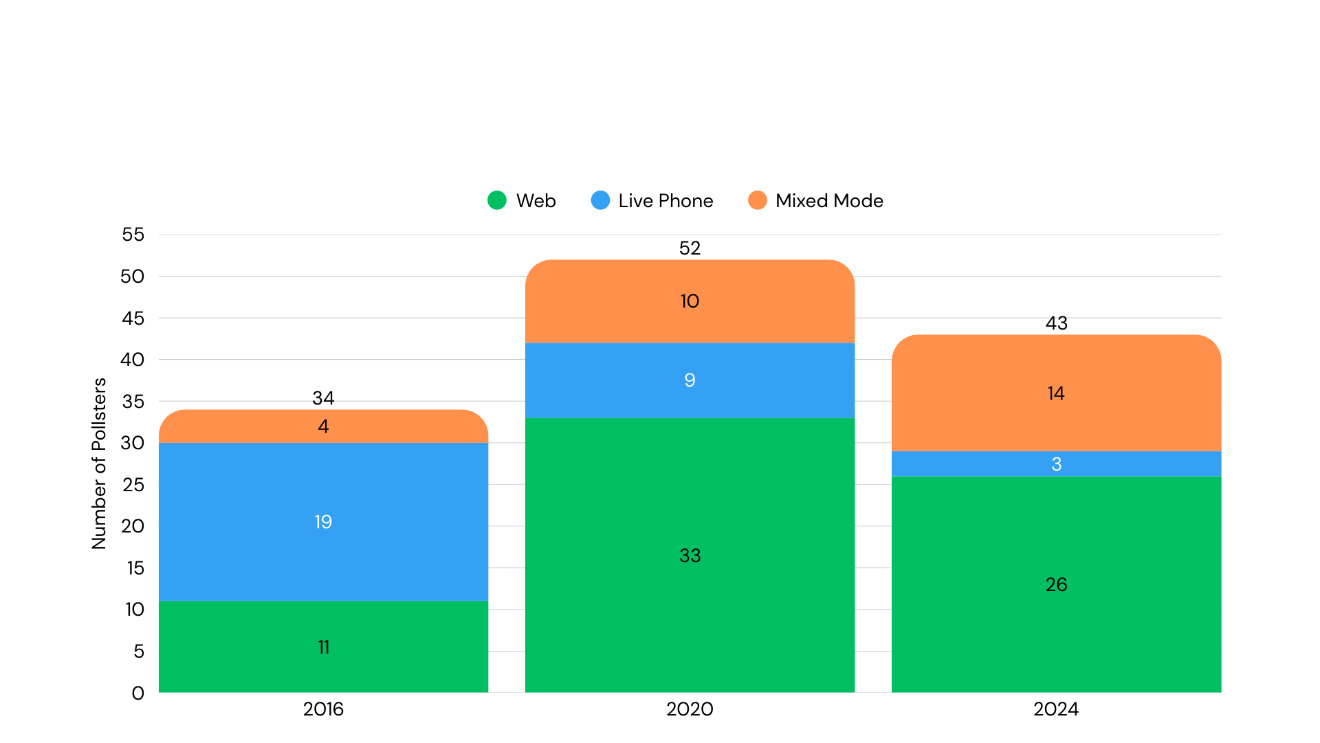
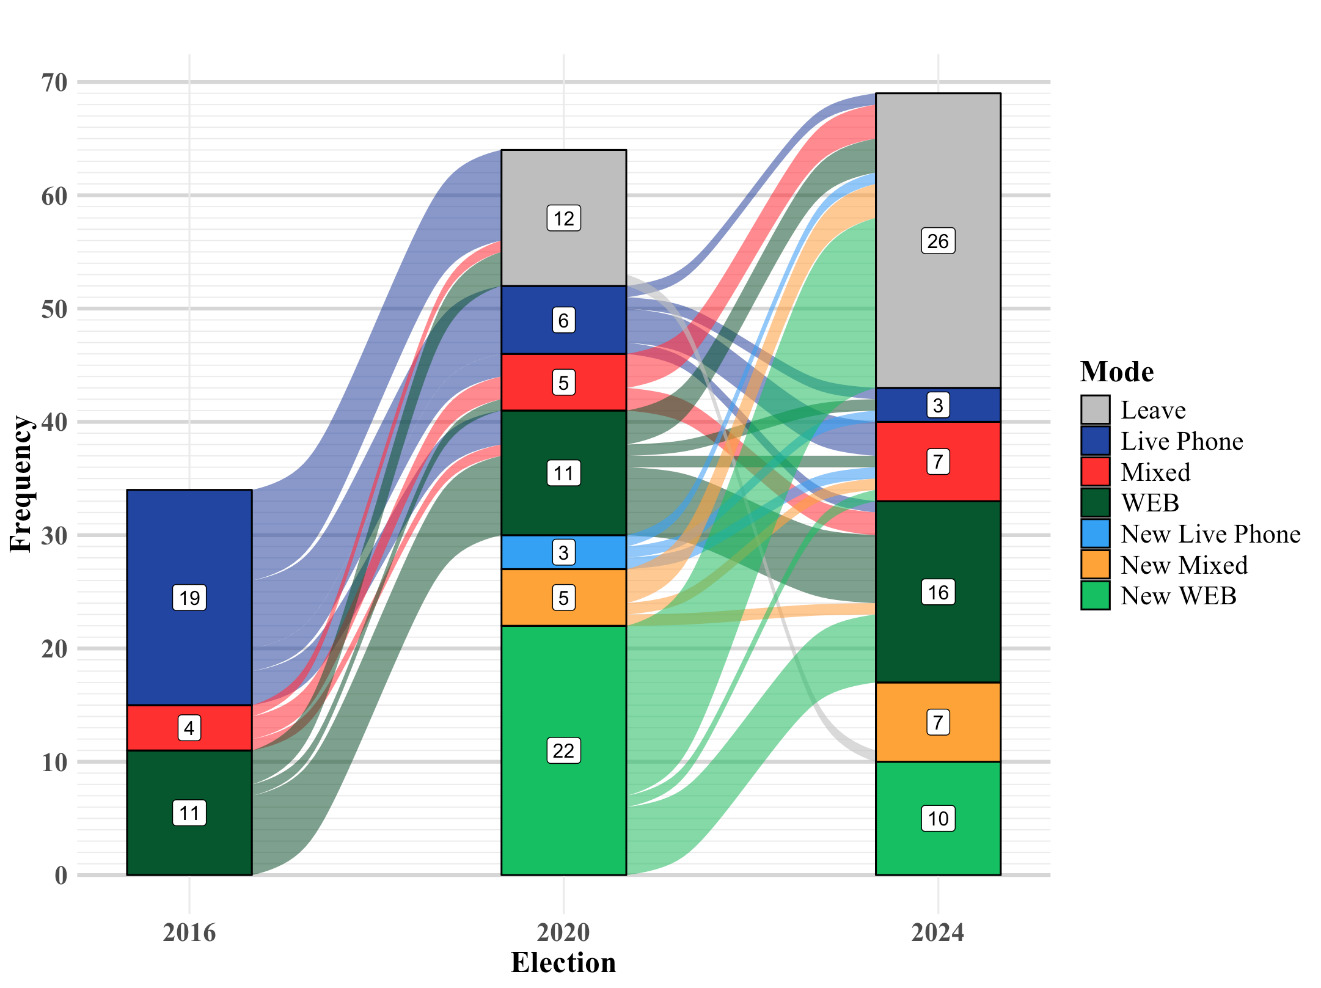
Figure 1 summarizes the distribution of the modes of administration. In 2016, 34 pollsters conducted polls, 19 of whom (56%) used live phone interviews, 11 (32%) used the web, and four used mixed modes. Mixed-mode pollsters generally used IVR, but because of legislation prohibiting the use of IVR calls to cell phones, they completed their samples with cell-only web opt-in respondents.
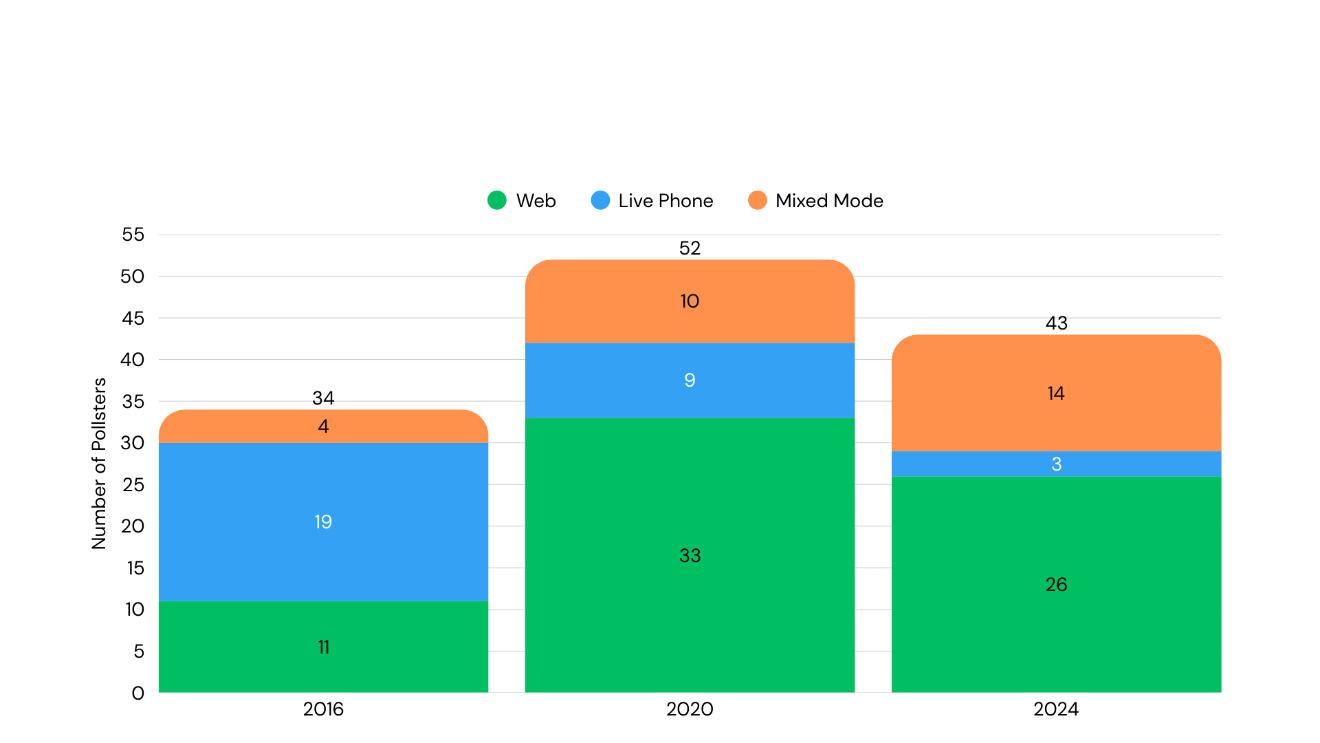
The situation changed substantially in 2020. A total of 52 different pollsters were present, a net increase of 18 (52%). Only nine of them used live phone interviews, accounting for a proportion of 17%. There were 33 pollsters (63%) using the web as the unique mode of administration and 10 pollsters using mixed modes (19%).
In 2024, the situation changed again. The number of pollsters decreased to 43 (-9.2 percentage points). Pollsters who used live phone interviews had almost disappeared (n=3). The proportion of pollsters using the web decreased to 26 for a share of 60%, and the proportion of pollsters using mixed modes increased to 33% (n=14).
Are these changes in the share of modes of administration due to pollsters changing their modes of administration or to changes in the composition of the pool of pollsters in each election? This is the main question addressed below.
What about the presence of pollsters/organizations in the three elections?
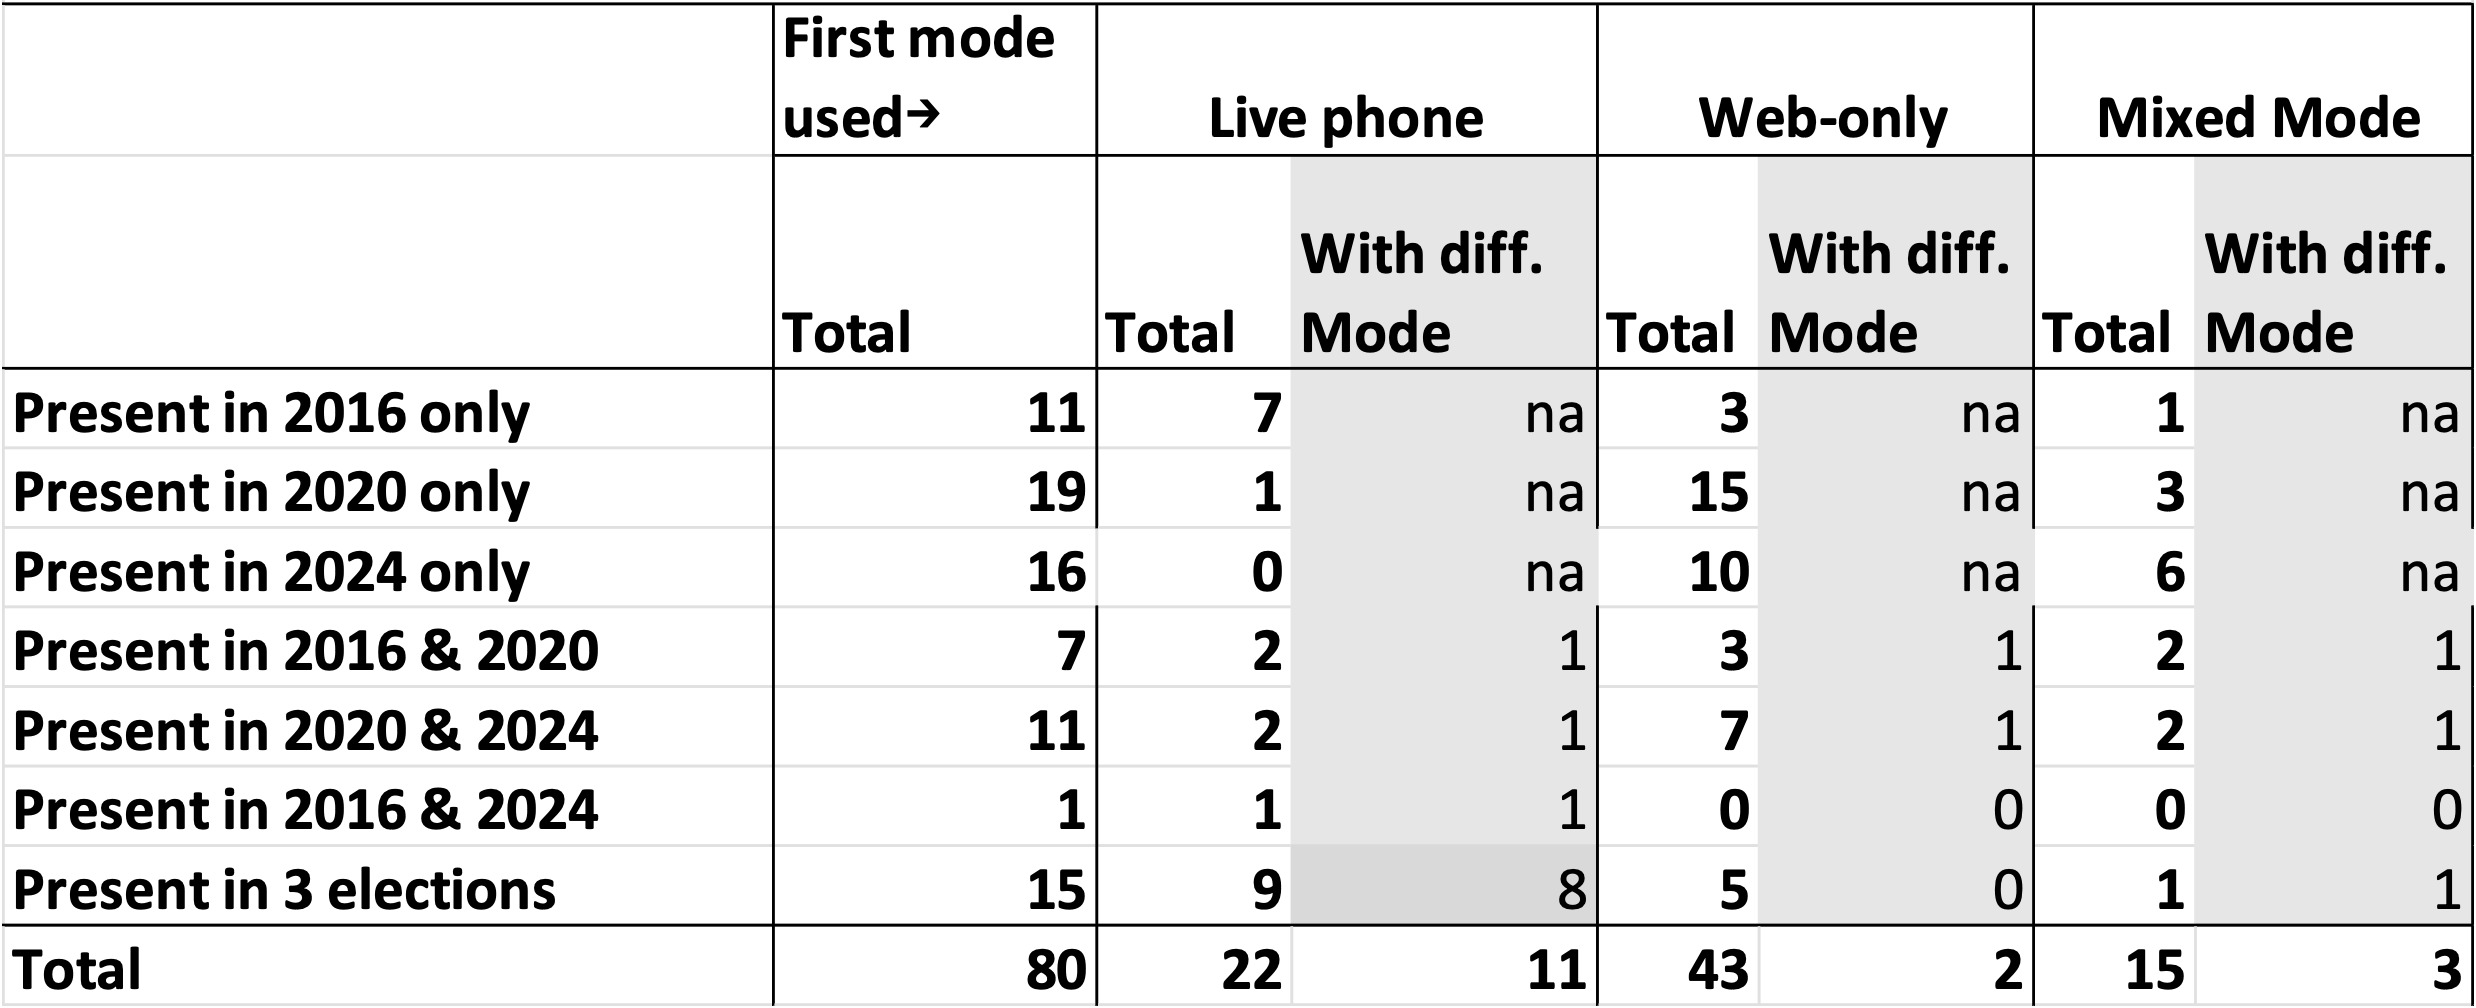
Table 1 shows the composition of the pool of pollsters/organizations that were present in at least one of the three elections, classified according to the first mode used. It also presents the number of pollsters active in two or three elections and the number who changed their mode of administration between elections.
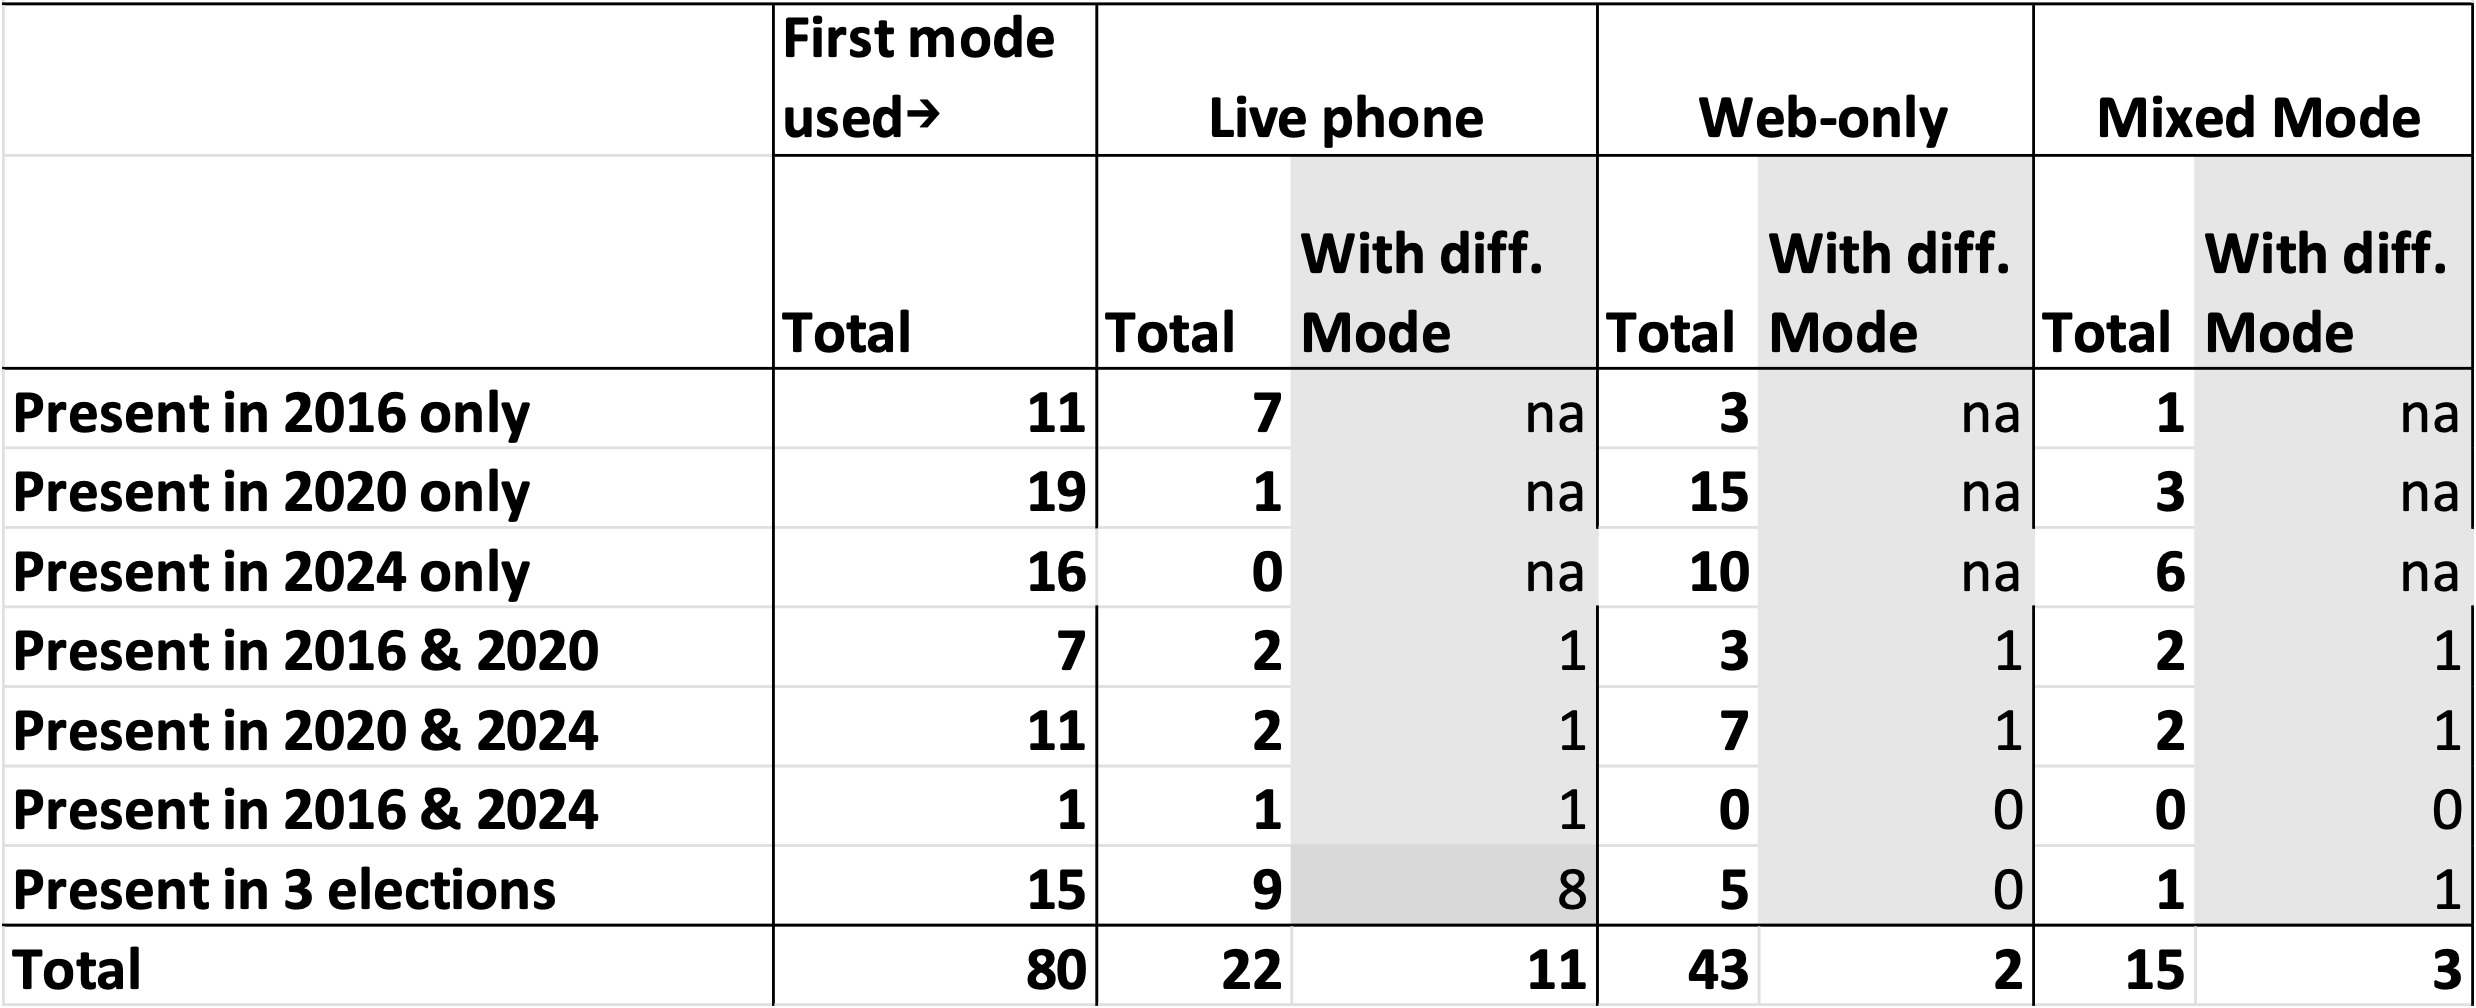
A total of 80 pollsters or organizations were present in at least one of the elections. More than 57% (46) were present in only one election. Among the 11 pollsters/organizations that were present only in 2016, the vast majority used live phone interviews. Among the 19 who were present only in 2020, most (15) were web-only pollsters. In 2024, there were 16 new pollsters, 10 of whom used the web mode and six used mixed modes.
If we now turn to the pollsters who were present in two elections, the seven pollsters who were active in 2016 and 2020 but not in 2024 were spread evenly across the various modes, and only three changed their modes. Most (11) were present in 2020 and 2024 and used the web mode (7). As in the 2016-2020 group, only three pollsters changed their modes between the two elections.
The 15 pollsters who were present in all three elections could be considered the most “professional” meaning that they had a track record of conducting electoral campaign polls. Most of these pollsters used live phone interviews in 2016 (n=9), and almost all of them changed their mode (n = 8) in 2020 or 2024. The unique mixed-mode pollster changed its mode, whereas the five web pollsters did not change their mode.
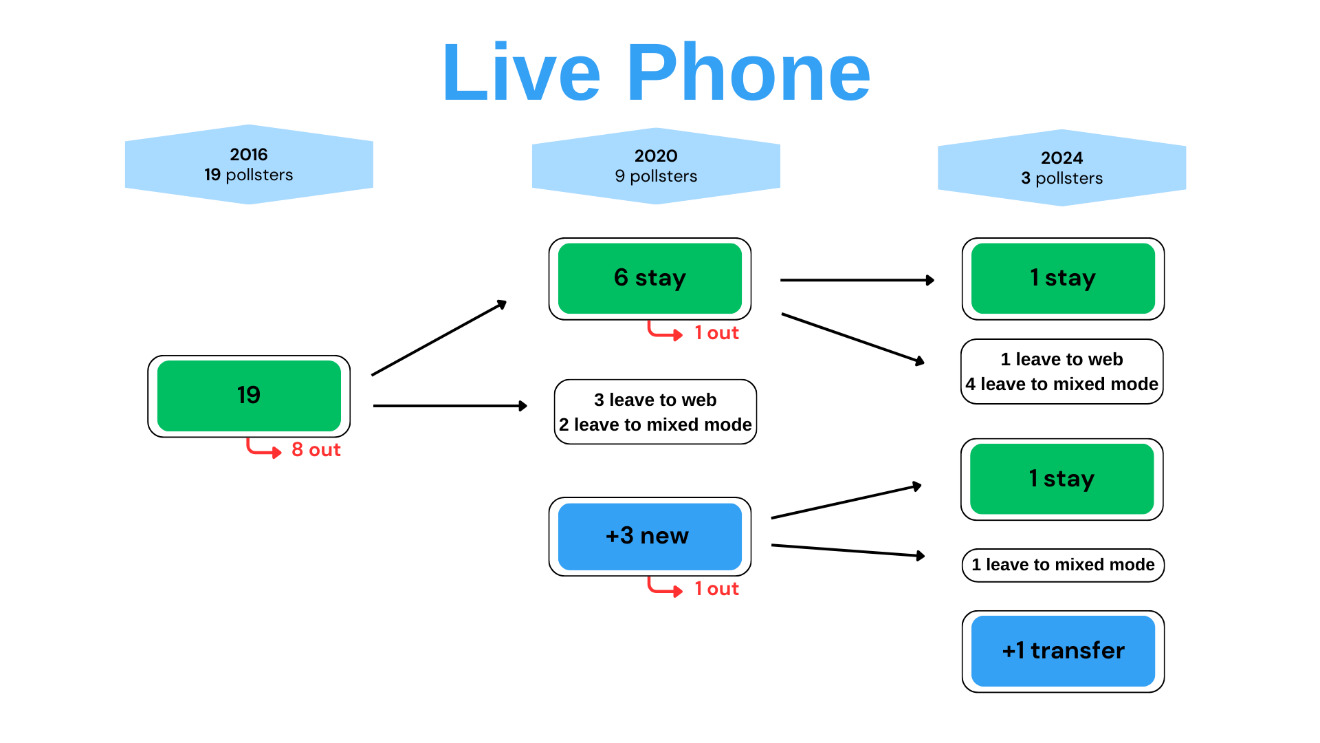
Therefore, we can conclude that the change in mode occurred mostly among pollsters who used live phone interviews (11 of 22); it has been a very rare behavior among web pollsters (2 of 43) and pollsters using mixed modes (3 of 15). In total, only 16 pollsters (20%) of the 80 changed modes, compared to 46 who entered the field in one election only. Therefore, we can conclude that the variation in mode use is mostly due to the composition of the pool of pollsters rather than pollsters changing modes.
How did these movements take place?
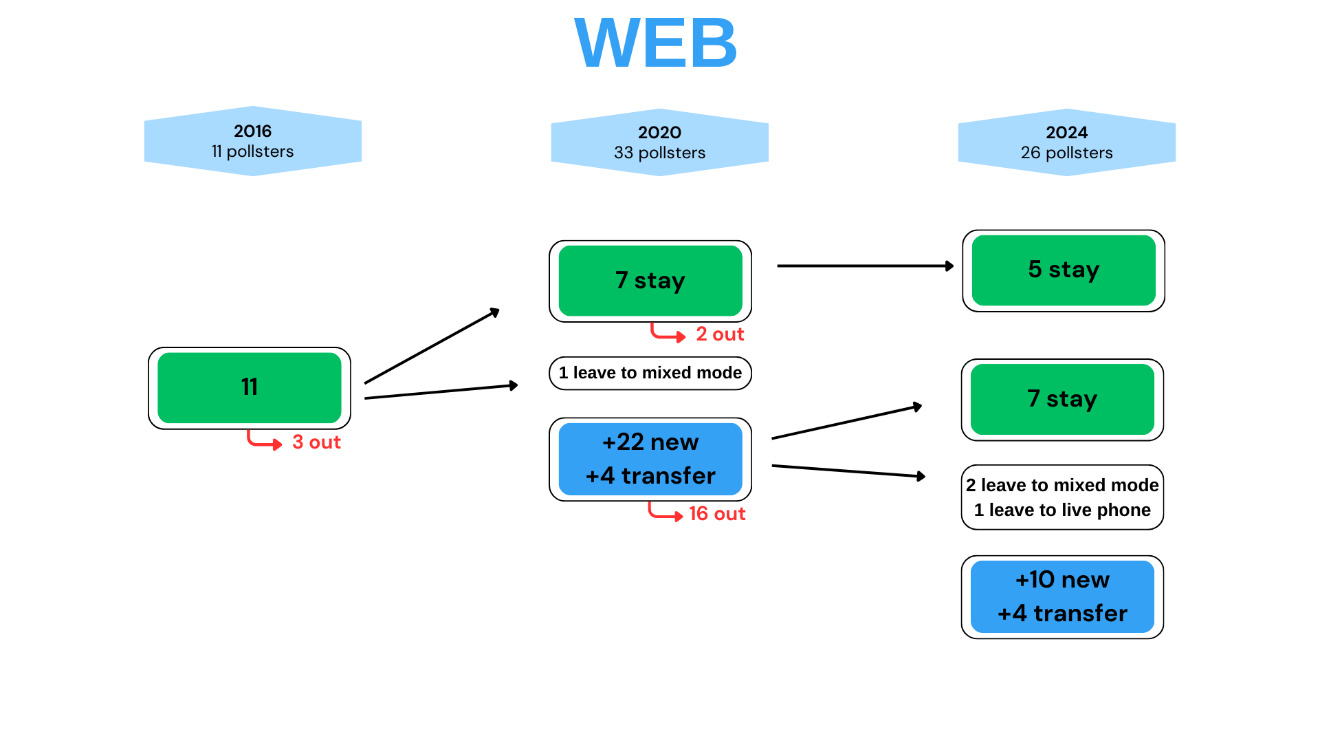
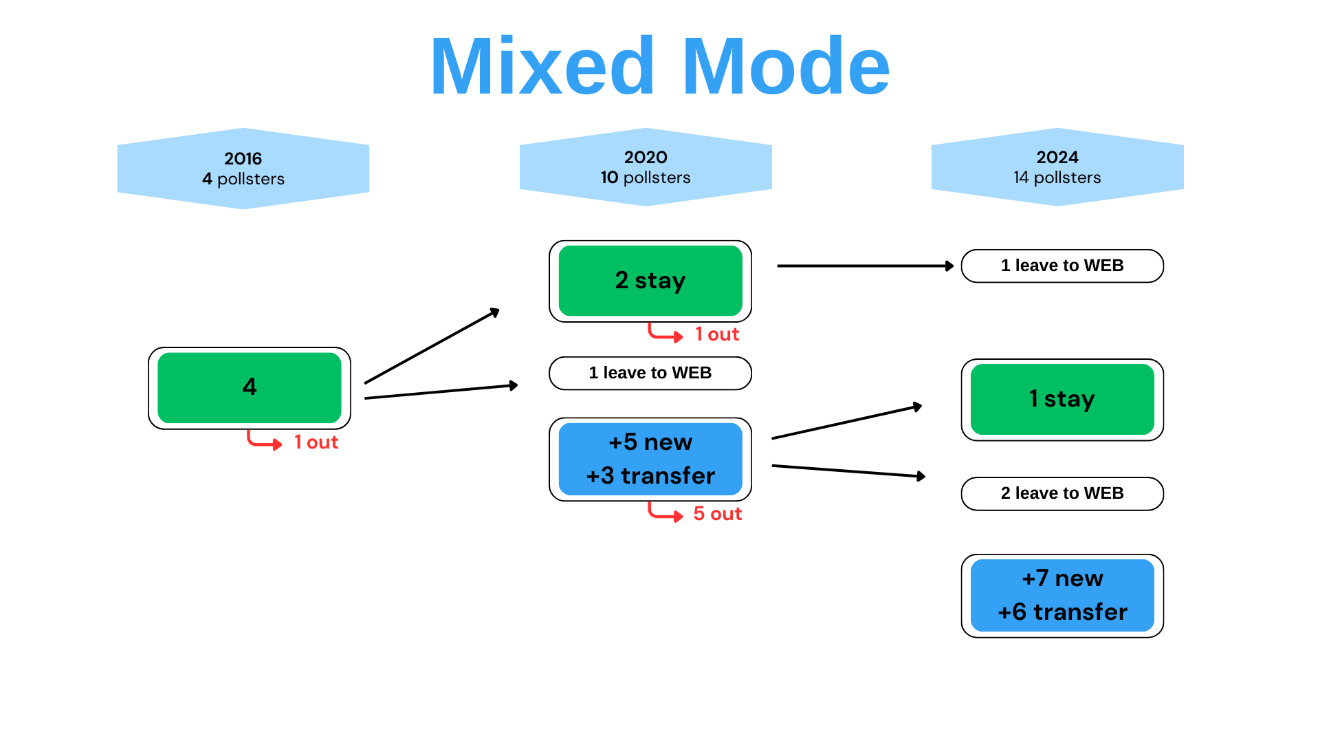
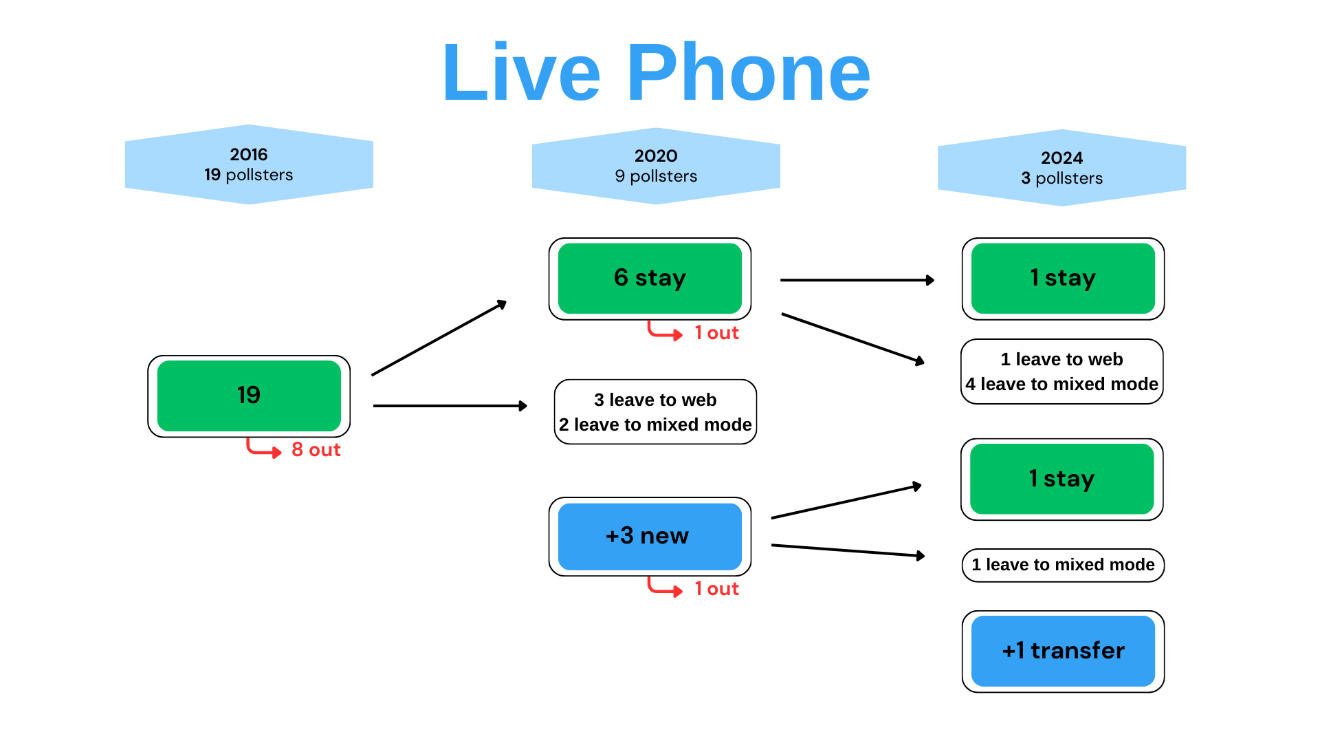
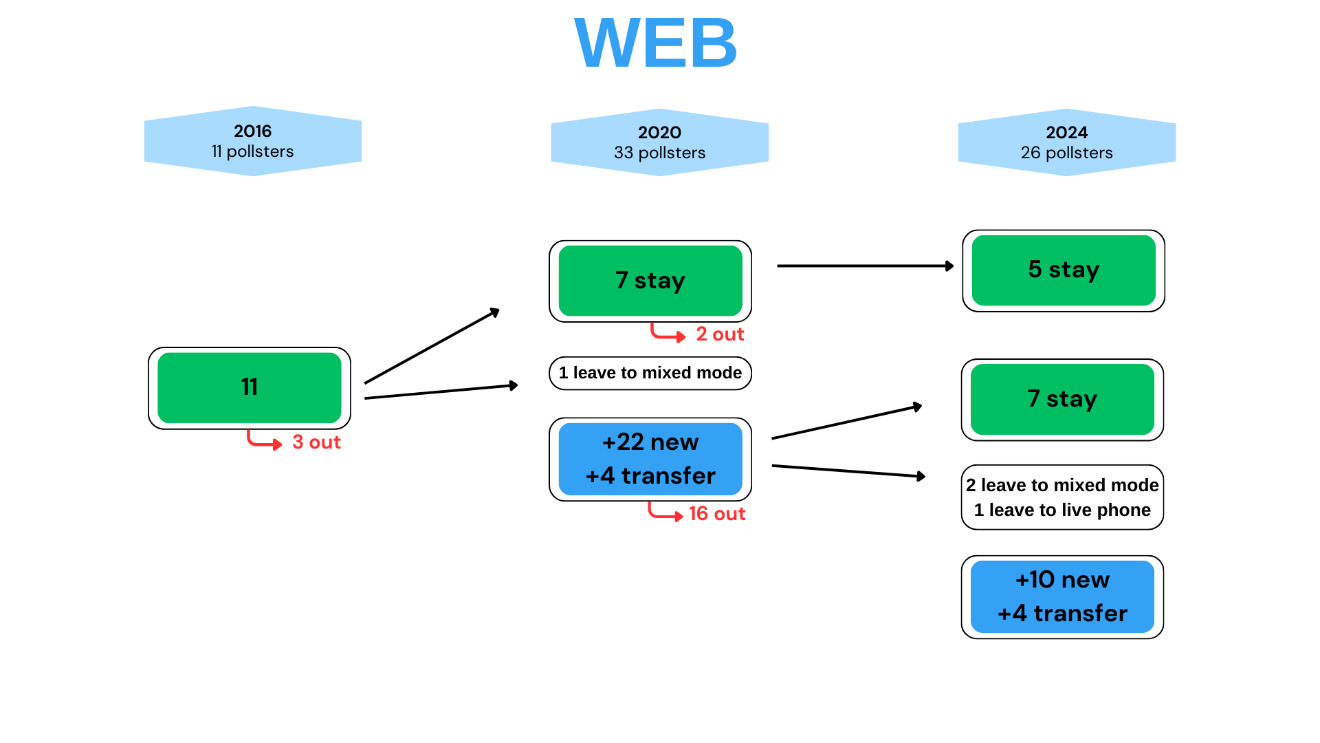
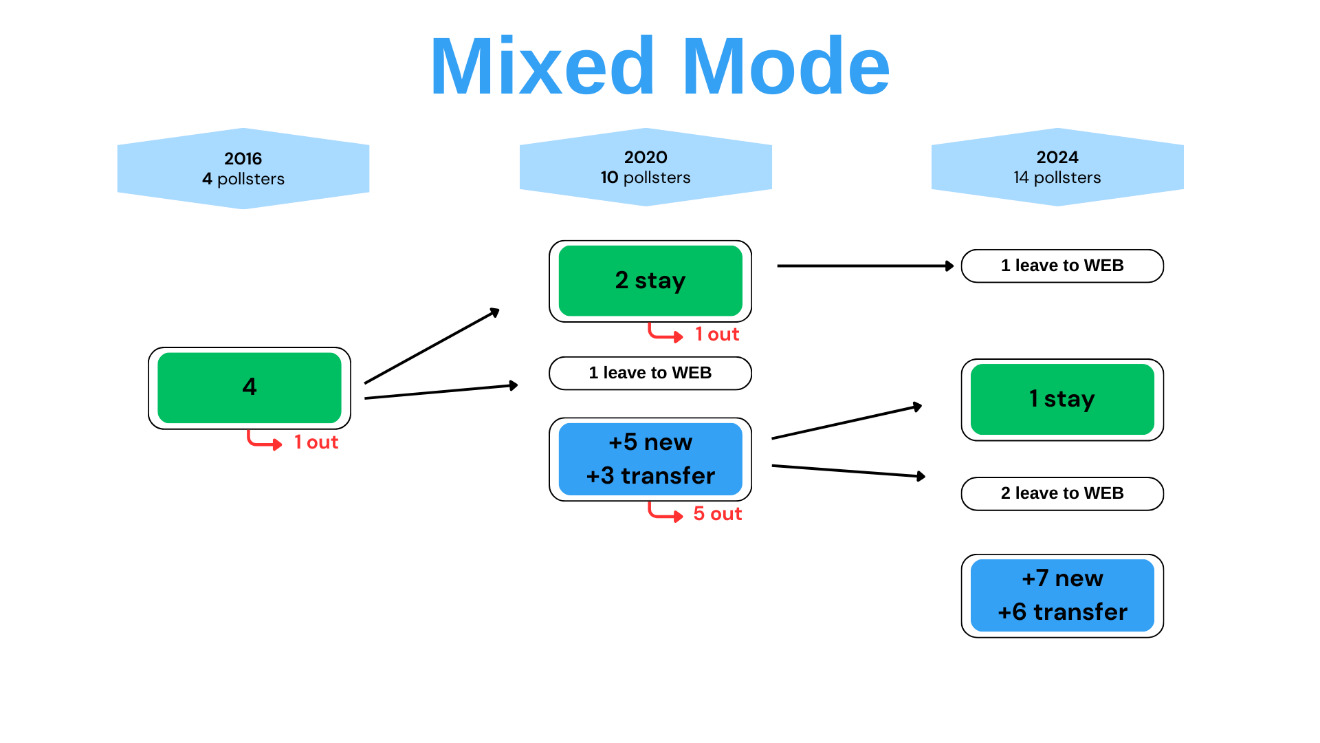
A more detailed examination reveals significant complexities. Figure 2 shows a Sankey plot of all transitions (mode switches, exits, and entries) that occurred from 2016 to 2024. It shows that from 2016 to 2020, the major event was live phone pollsters leaving the field (eight of 19). The rest either stayed with the same mode (n=6) or switched to web (n=3) or mixed mode (n=2).
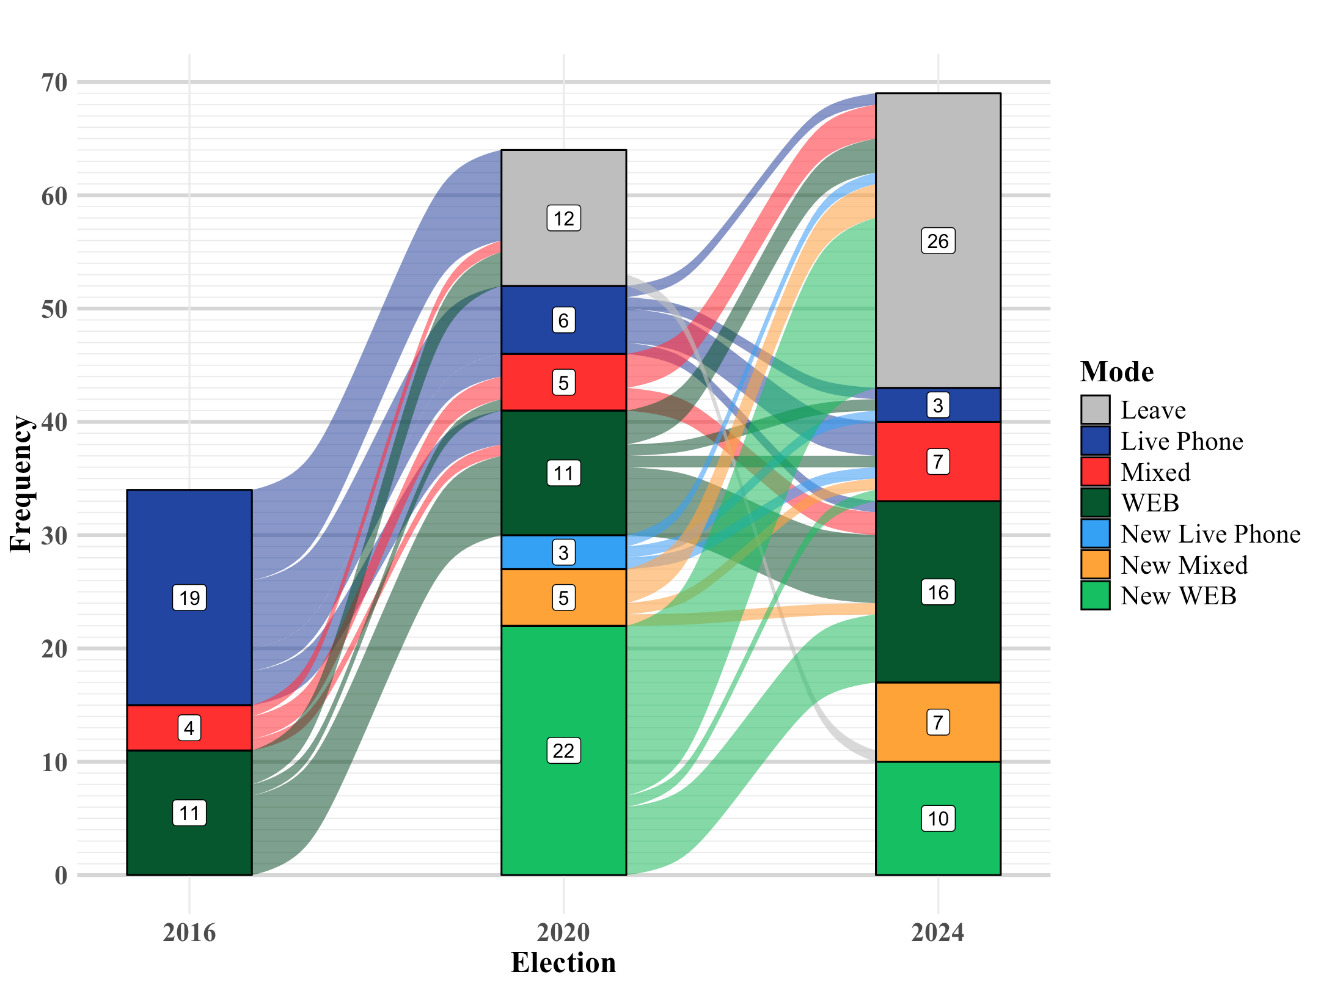
In contrast, the main event in 2020 was the entrance of 22 new web pollsters. They made up two-thirds of all web pollsters that year. Finally, 2024 is characterized by the fact that 26 pollsters who were present in 2020 did not return in 2024; most of them (16) were web pollsters who had done a one-shot appearance in 2020.
The 2024 election was also characterized by mode switching. The larger share of pollsters using mixed modes in 2024 comes as much from Web or live phone pollsters switching (n=6) as from new pollsters (n=7). The web mode also benefitted from mode switching, but the number of new pollsters (n=10) was not even half of 2020. The appendix presents more details on the moves according to the modes used.
In summary, 2020 – the election with the largest polling error since 1980 – was “the year of all dangers,” with a substantial increase in the number of pollsters, particularly new pollsters who used web-based opt-in polls.
Does pollster experience impact the accuracy of polls?
The uniquely high number and turnover of pollsters in the United States, compared with other countries such as Canada, France, or the United Kingdom, pose potential challenges for the transmission and retention of specialized knowledge and skills associated with electoral polling. If experience plays a role in the transmission of know-how (Pasek et al. 2025), pollsters who were present in more than one election should have performed better. Is it the case?
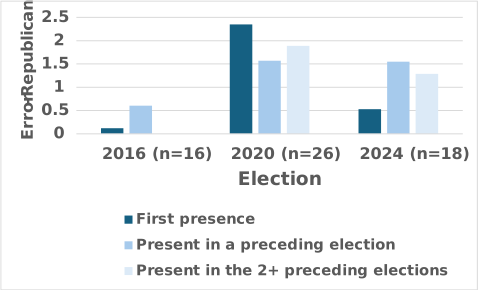
To answer this question, we checked whether the pollsters who were active in the preceding election(s) performed better than those who were present in an election for the first time. We retrieved data from the 2012 electoral campaign to characterize each pollster according to its presence, even before the period under study. We considered a pollster to be present in a given election if it had conducted a poll during the campaign, even if it did not conduct a poll during the last 10 days.
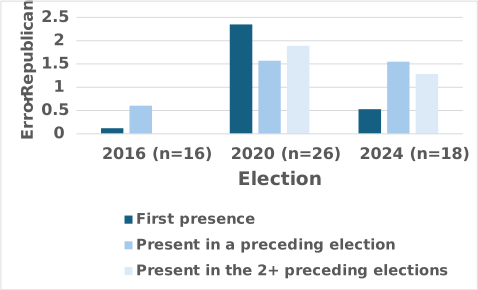
In 2016, among the 16 pollsters active during the last 10 days, 11 were active in 2012. In 2020, 26 pollsters were active in the last 10 days. Thirteen were active for the first time, nine had been active in a preceding election, and four had been active in two preceding elections. In 2024, 18 pollsters conducted a poll during the last 10 days. Four were new pollsters, seven were active in 2012 or 2016, and seven were active in two or three preceding elections. The 2020 election stands as a year in which more than half of the active pollsters in the last 10 days of the campaign were new pollsters.
Figure 3 illustrates that in 2020, the new pollsters did not perform as well (error = 2.34) as the more experienced pollsters (error = 1.57 for one previous presence and 1.89 for two previous presences). However, this difference was not statistically significant. In 2016 and 2024, there were no significant or apparent differences according to experience, with new pollsters exhibiting even better accuracy. In summary, there is no clear impact of pollster experience on polling accuracy, which is a positive outcome.
Limitations
This study has some limitations. First, the categorization did not consider sampling frames, sources, or other methodological features. Changes in the modes of administration usually come with changes in the sampling sources, but pollsters who use the same mode of administration do not necessarily rely on the same type of sampling sources. Most Web pollsters use opt-in panels, but a few use probabilistic panels, and some pollsters rely on voter files (Kennedy et al. 2017; Pasek et al. 2025). In addition, the mixed-mode category is heterogeneous in terms of the various modes that are combined. Unfortunately, many pollsters do not provide sufficient information on their sampling sources. Hence, maintaining large categories is the best way to control for the variety of other methodological features in each category.
Using the last 10 days of each campaign to analyze poll performance restricts the number of polls on which we can base our results. This also means that we cannot compare our results with the AAPOR reports, for example, wich use a 15-day period. However, we consider this restricted period preferable given the movement in voting intentions during the last days of each campaign. For example, in the 2024 campaign, Pasek et al. (2025) found a signed error of 2.5 for the national polls in the last 15 days. However, a local regression of all the polls, presented on the Wikipedia page for the national polling of the election, validated by my own analyses, showed a much lower difference between the polls forecast and the election results.
Finally, some organizations (media, associations) subcontract pollsters to perform fieldwork, but they do not provide information on the pollster’s identity. In addition, some pollsters work for more than one organization. It is also likely that many pollsters or organizations conducting web polls use a limited number of sample providers. This type of behavior is difficult to detect, and it introduces dependency in the data.
Conclusion
Despite major challenges, U.S. presidential election polling has maintained a good level of accuracy, except in 2020. In 2024, there were no substantial differences in the forecasts according to the mode of administration. In addition, the share of the vote and the winner were accurately predicted. However, we cannot attribute the good performance of 2024 to pollsters improving their methods as much as to changes in the composition of the pool of pollsters.
Finally, the current landscape in the U.S. is characterized by the absence of disclosure norms that all pollsters and media agree on and respect. AAPOR’s transparency initiative is an important step in this direction, but it does not seem sufficient. Given the high number of pollsters and organizations active in U.S. elections, voters would benefit from increased transparency and standards that are agreed upon, as adopted by associations of pollsters in other countries, such as the United Kingdom and Canada. Implementing more stringent transparency standards and focusing resources on higher-quality polls with larger sample sizes could further enhance the reliability and trust in electoral-polling results.
Corresponding author contact information
Department of sociology, Université de Montréal,
CP. 6128, succ. Centre-Ville, Montréal, Qc, Canada, H3C3J7
Acknowledgements
I wish to thank Félix Laliberté and Anthony Pelletier for their invaluable assistance with data collection, analysis, and visualization. I am also grateful to the many pollsters who contributed to this endeavor. Finally, I would like to thank the reviewers for their thoughtful and constructive comments on an earlier version of this paper.