Introduction
Longitudinal surveys have grown in international significance for basic research and policy advice in recent decades because they offer a unique opportunity to examine individual life courses and collective social change over time (Bujard and Wagner 2023; Primerano et al. 2026). To ensure high data quality, survey research typically follows standardized survey guidelines that organize planning through the Survey Life Cycle (SLC) and seek to minimize total survey error (TSE) (Groves et al. 2009; Survey Research Center 2016; Wolf et al. 2016). However, longitudinal surveys entail additional types of error due to their design, some of which interact across waves and increase complexity. In response, Lynn and Lugtig (2017) expanded the TSE framework to account for panel specific types of error, e.g., cumulative coverage, sampling, and nonresponse errors. However, both cross-sectional and longitudinal studies continue to rely on the SLC as the overarching conceptual framework.
This research note addresses the conceptual gap by extending the SLC framework to incorporate cross-wave interactions arising from overlapping survey waves, particularly for processes that recur with the same timing in longitudinal studies. We make timing and interrelations of key survey processes explicit, supporting the management of longitudinal data quality across waves, and propose Longitudinal Survey Life Spirals (LSLS) as a conceptual framework. With LSLS, survey practitioners can better coordinate longitudinal survey processes and adapt workflows. By learning directly from overlapping waves, they can apply insights and improve data quality. Identifying and reflecting on cross-wave process overlaps enables longitudinal data infrastructures to make their data available more quickly while still ensuring quality. We use the Socio-Economic Panel (SOEP) as an illustration to highlight the potential of the novel LSLS framework. The SOEP is a multidisciplinary household survey that began in 1984 and annually invites approximately 30,000 individuals from roughly 20,000 households to participate (Goebel et al. 2019). Because the interval between the start of two waves is only one year, while the work on a single wave extends well beyond this period, tasks from up to three SOEP waves are typically carried out in parallel.
Background: The Traditional Survey Life Cycle
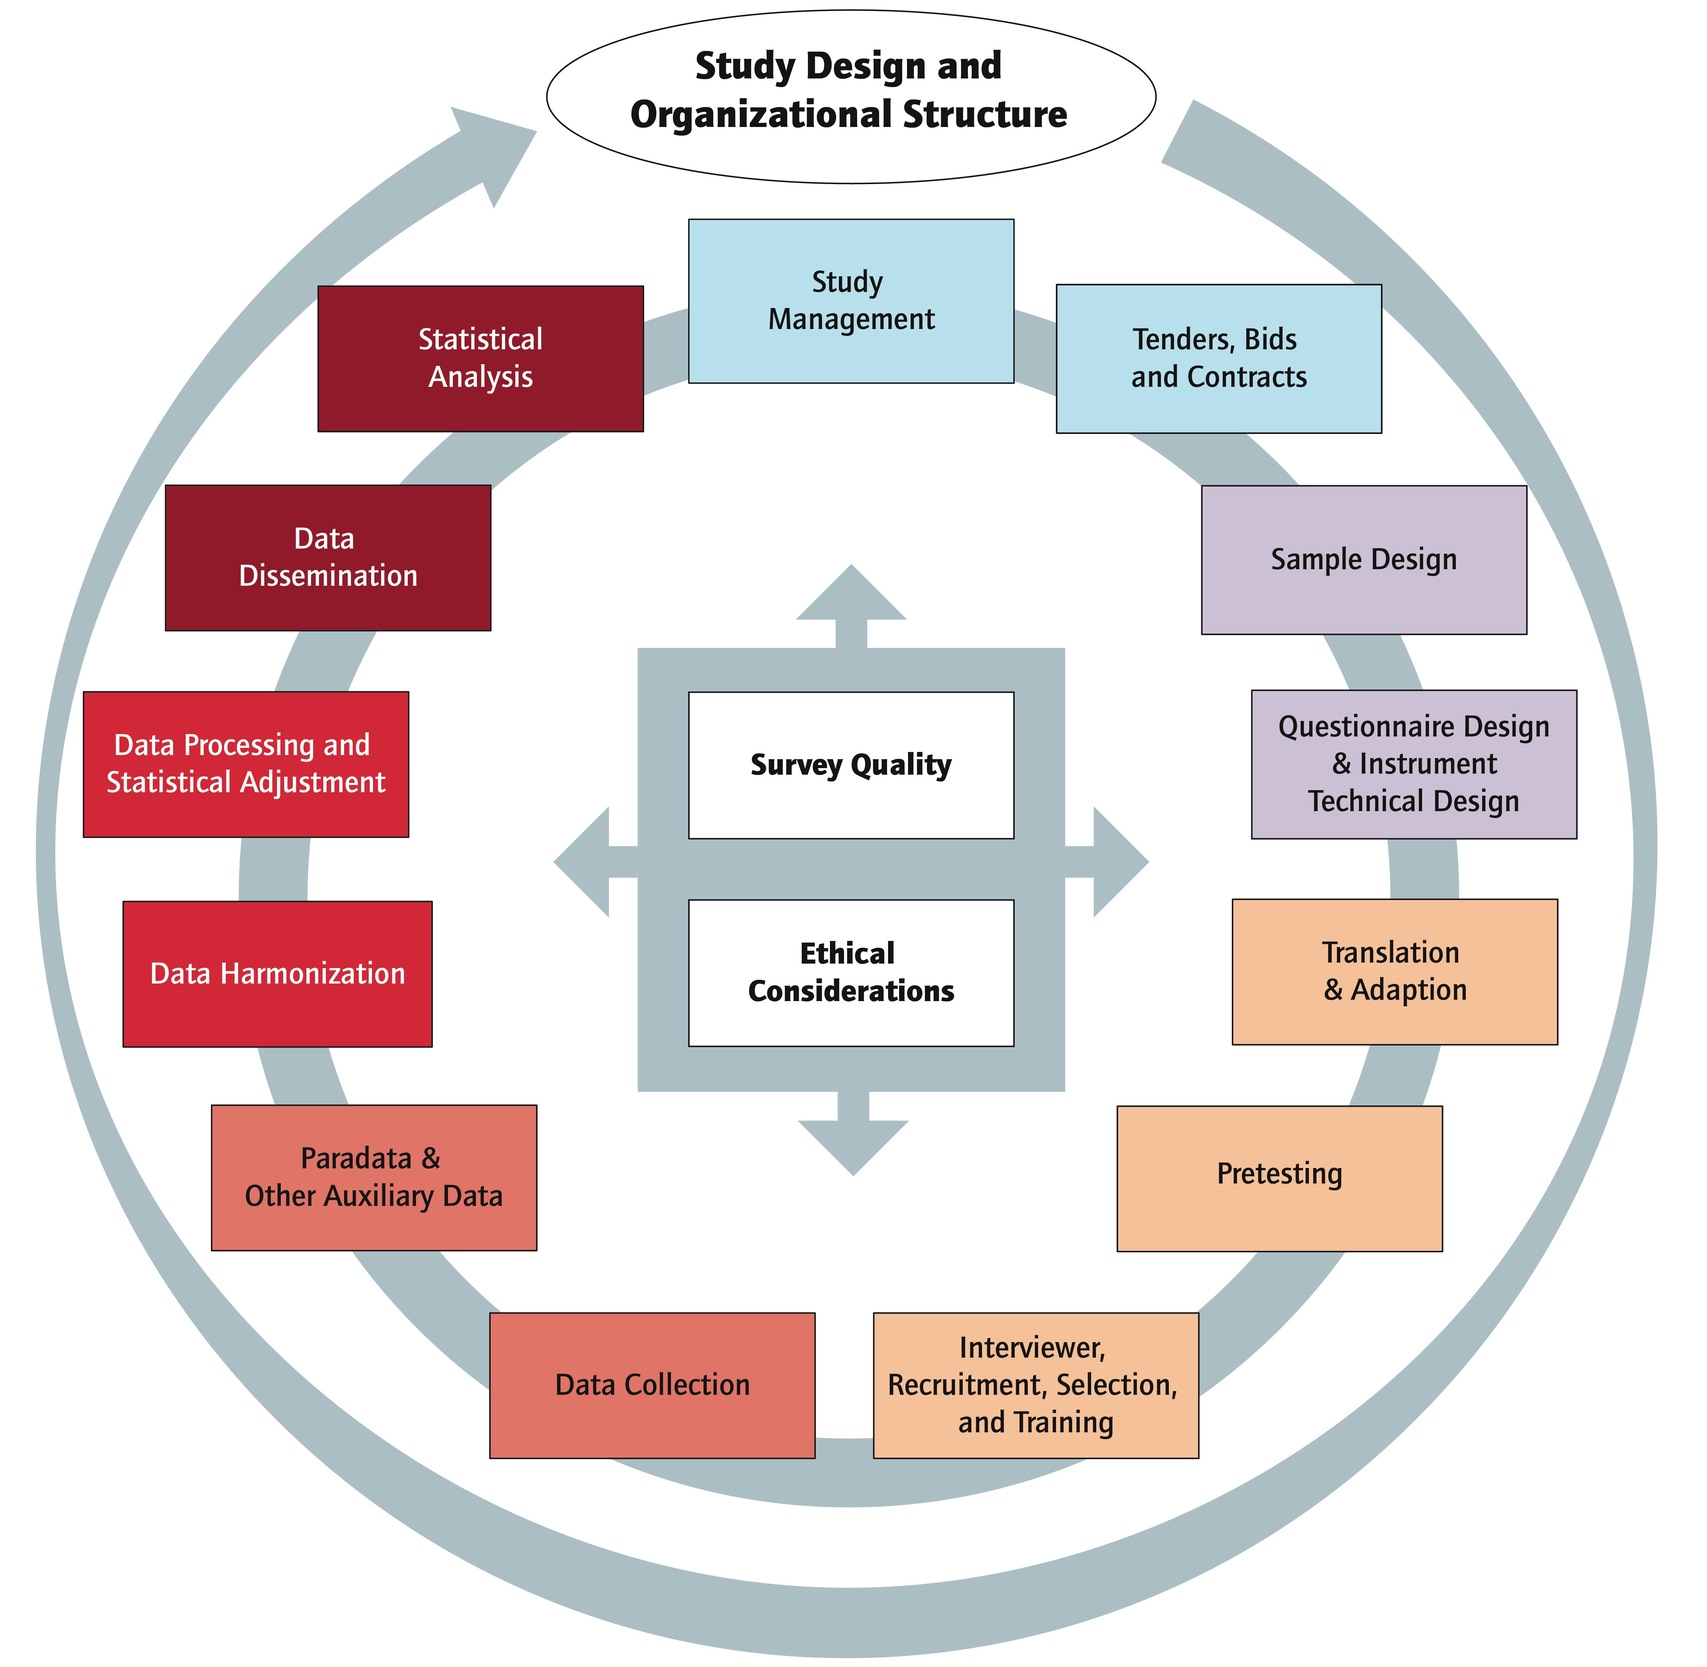
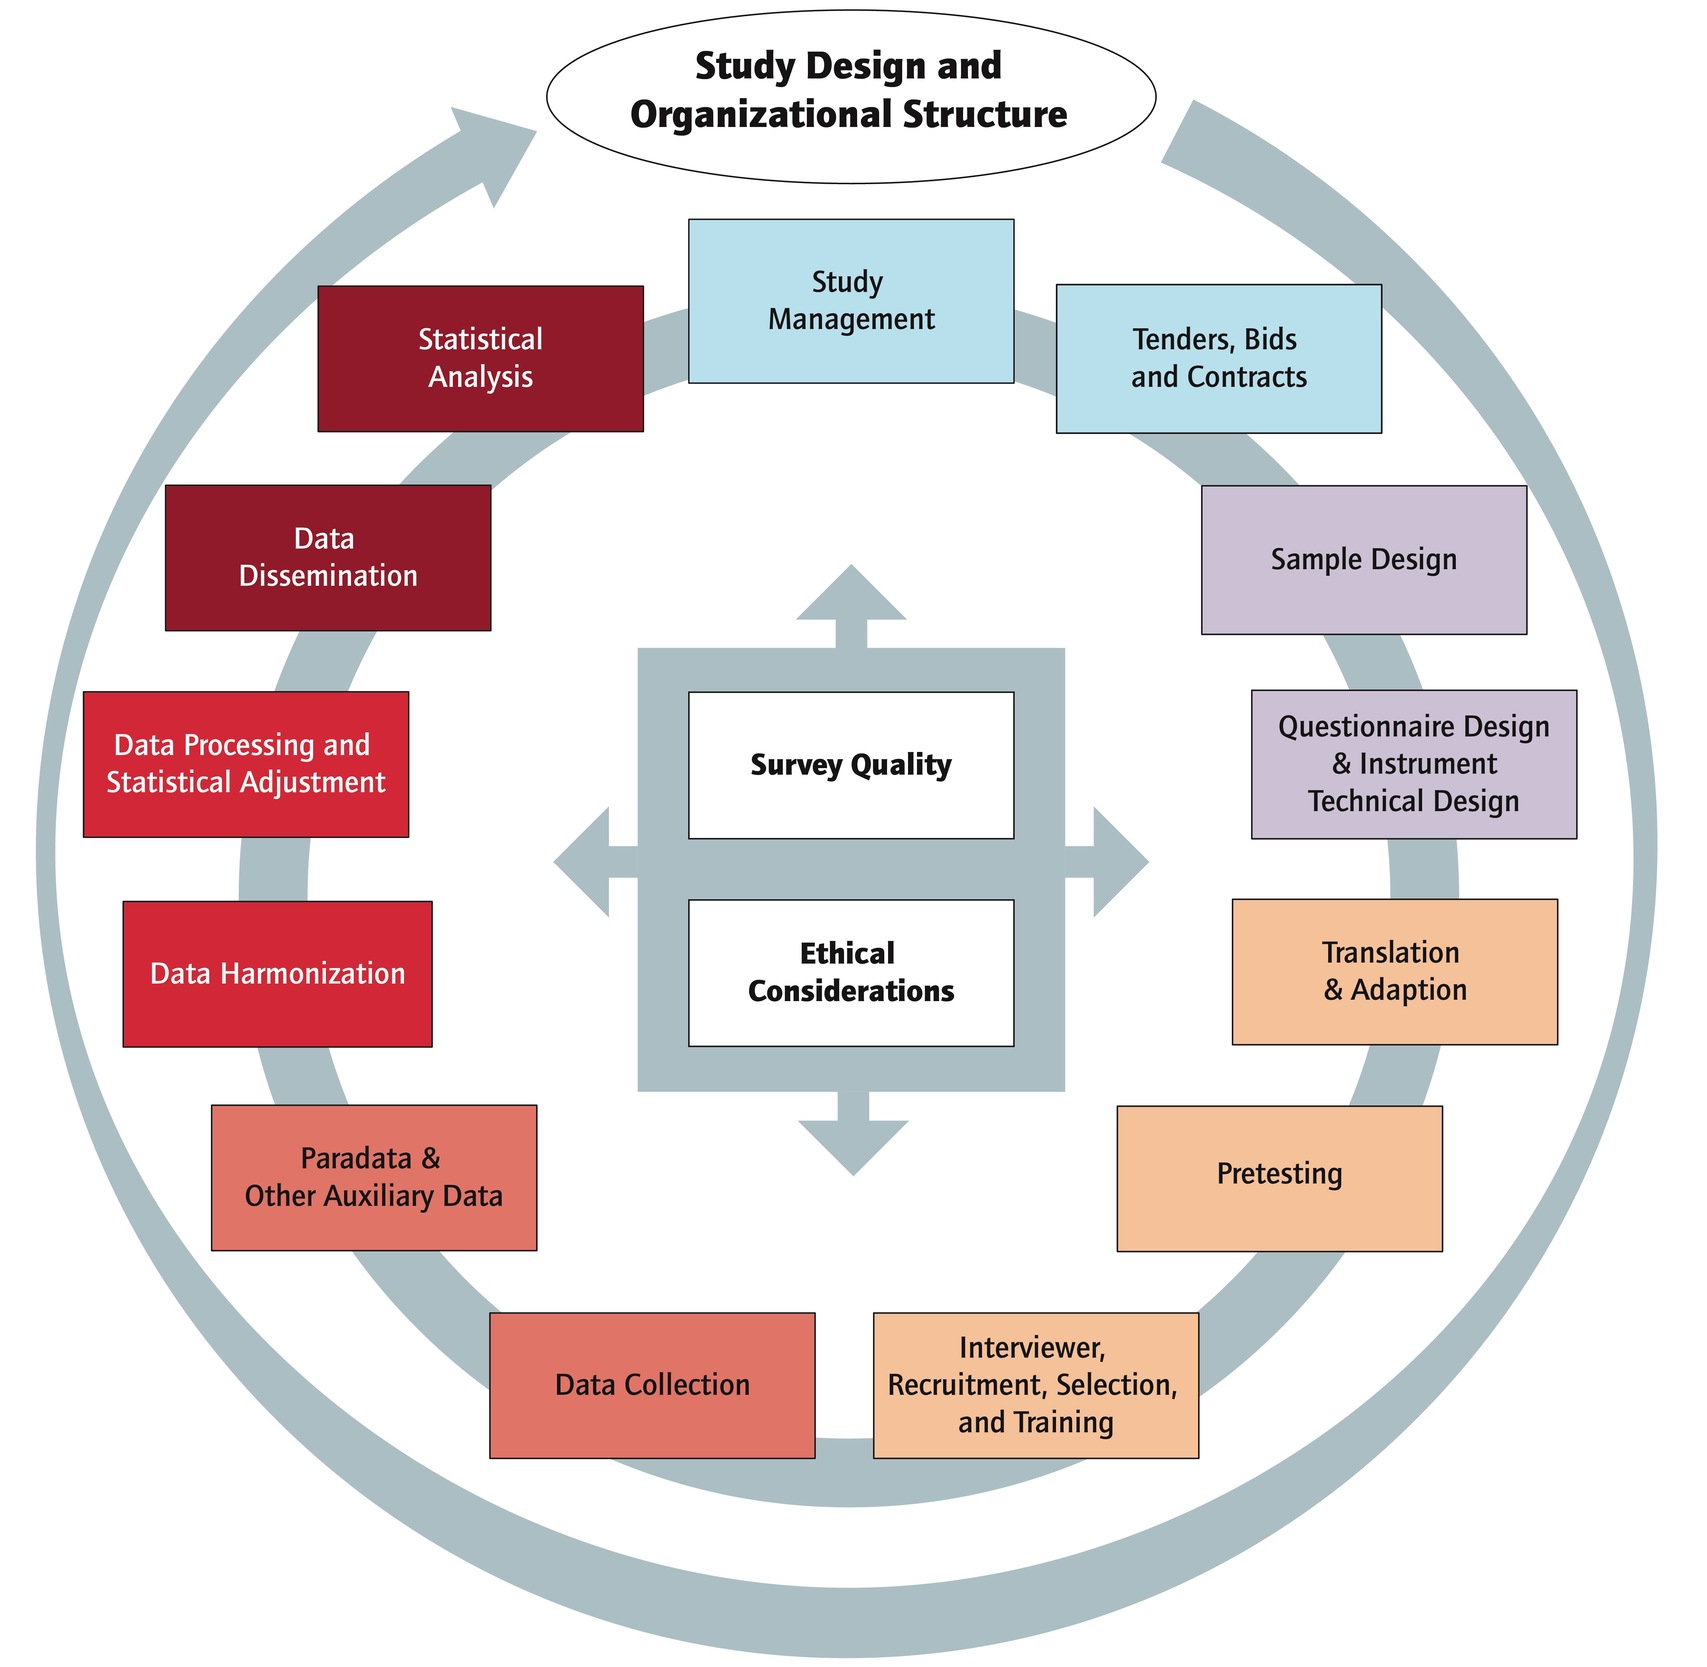
Developed from a growing understanding of TSE, the SLC provides survey practitioners with methodological guidance on the design, implementation, and quality assurance of surveys (Groves and Lyberg 2010). By conceptualizing survey quality as the result of interconnected tasks and decisions across a survey wave, the SLC offers a process-oriented perspective on various sources of error. It is commonly operationalized through standardized task frameworks such as the Cross-Cultural Survey Guidelines (Survey Research Center 2016). Figure 1 illustrates this logic by depicting a sequence of recurring survey tasks that structure the production of a single wave.
In longitudinal studies, however, survey waves are interdependent in terms of timing, resources, and data flows. By focusing primarily on a single wave, the traditional SLC provides only limited guidance for managing these cross-wave dynamics. While cross-sectional studies involve completing each phase of the SLC only once, longitudinal data infrastructures require repeated work on each data collection wave, making coordination across waves a central challenge. Planning for time, costs, and resources, as well as quality standards, must be managed over a longer period, and feedback loops become more important. To meet this need and harness potential synergies, LSLS transform the traditional SLC by incorporating the iterative and interactive elements of longitudinal studies.
The Longitudinal Survey Life Spirals (LSLS): A Conceptual Framework
LSLS are based on three closely interrelated principles. First, in conducting longitudinal studies, interdependencies emerge between different survey waves, particularly when waves occur frequently or when the survey design is complex. Until certain tasks from an earlier wave are completed, certain aspects of subsequent waves may not be fully carried out or planned. Second, the use of LSLS enables continuous documentation and reflection. By establishing effectively timed feedback loops, insights gained from earlier waves can contribute to the continuous improvement of the survey and data quality. Third, the new concept allows for a more flexible standardized process logic to meet dynamic and study-specific needs.
While the SLC depicts task transitions in a linear sequence and restarts once the overall process is completed, longitudinal studies do not require all steps to be carried out strictly in that order. Furthermore, it may be advantageous—or even necessary due to schedule constraints—to begin operations for a subsequent wave before the previous wave has been completed. Thus, the primary objective of LSLS is to identify which tasks within one wave and across waves can be carried out in parallel and which cannot, considering schedules, resources, and other constraints. At the same time, recognizing these relationships enables synergies, where coordinating or overlapping compatible tasks can improve efficiency, reduce duplication, and make better use of available resources.
Although many tasks can be carried out simultaneously, there are also phases with milestones that directly build on one another. LSLS address this aspect through six sequential phases (see Table 1), that are in line with the tasks of the SLC. To identify cross-wave interdependencies, the available and planned resources need to be considered. This highlights organizational issues, such as how many staff members are allocated to which tasks within a given budget, to what extent, and under what substitution arrangements. Precise resource planning reveals whether working groups are involved in multiple phases of the survey wave and, if so, to what extent. The combination of time and resource planning in longitudinal data infrastructures forms the foundation of LSLS.
Table 1 shows an annual panel survey as an example of possible cross-wave overlaps along the six phases. The LSLS framework highlights that it is possible to run between two to six survey waves simultaneously. In practice, however, study-specific interdependencies between survey waves come into play. An example of a time-based interdependency is when the collected and edited data from the last wave needs to be available to define the gross sample for the next wave. In SOEP, for example, the definition of the gross sample for a subsequent wave depends on the raw data check of the preceding wave. Otherwise, households could be assigned an incorrect survey status, for example marked as available despite having withdrawn their participation agreement. Similarly, the data processing of a subsequent wave always begins only after the data dissemination of the previous wave, ensuring that work on one data version is completed before the error-prone maintenance of two data versions becomes necessary. Then, depending on the study design, it may happen that individual project phases are carried out concurrently across multiple waves using the same methodological design and the same survey instruments. For example, data collection periods for subsamples from different waves may overlap, meaning that two subsamples are surveyed simultaneously, each representing a distinct wave. Furthermore, resource constraints may exist, for example, when the same staff members are responsible for both the initiation and planning of the survey waves as well as the data processing.
Beyond the structured coordination of parallel tasks, LSLS also emphasize continuous learning and the use of feedback loops that operate across different waves. Already within the same wave, timely feedback on key milestones can have an impact on later phases, for example, when design flaws are identified during instrument testing or when distributing a beta version helps uncover errors before the official release of data. This potential is further amplified in longitudinal surveys with overlapping fieldwork cycles. In such designs, errors identified in one wave may surface again in subsequent waves before the current wave has even concluded. This allows corrections to be implemented at a very early stage in the lifecycle of a wave. In SOEP, for example, interviewer capacity constraints in computer-assisted personal interviewing (CAPI) or varying effects of reminder strategies in computer-assisted web interviewing (CAWI) can be detected early through field monitoring. By aligning the schedules of consecutive waves, survey teams can use interim data analyses to inform the design of the next wave. Interim data may already provide valuable insights into response behavior, measurement quality, and survey duration. Debriefings with interviewers and “Lessons Learned” workshops serve as further feedback loops to improve ongoing fieldwork. Crucially, the effectiveness of this approach depends not only on the existence of feedback mechanisms but on their timing. Managing when feedback enters the process is therefore as important as ensuring that feedback is generated at all.
As each new survey wave begins, the number and complexity of potential feedback loops between overlapping waves increase. For example, design decisions (e.g., concerning mixed survey modes), sample developments, or data analyses can have a direct and, in some cases, short-term impact on various components of subsequent waves. This growing interconnectedness not only amplifies dependencies between waves but also creates opportunities for continuous learning and adaptation. Teams working in parallel on different waves can continuously expand their expertise and identify new areas for improvement. Within the LSLS framework, time and resource planning need to become longitudinal too, to efficiently integrate what has been learned into a longitudinal study.
Table 1 illustrates examples of feedback loops that span multiple waves. While data from the first wave is being processed, the subsequent wave is already in the implementation phase, and the third wave is being initiated. If the data generated in the first wave reveals any shortcomings in the survey instrument, these can be addressed before the planning and design phase of the third wave begins. Critical errors could even be fed back into the implementation phase of the second wave to ensure the data quality of the subsequent wave just in time. This requires cross-wave integration of schedules and resource plans as well as close coordination among the different teams. Then, feedback loops can be identified and timed along the overlapping processes.
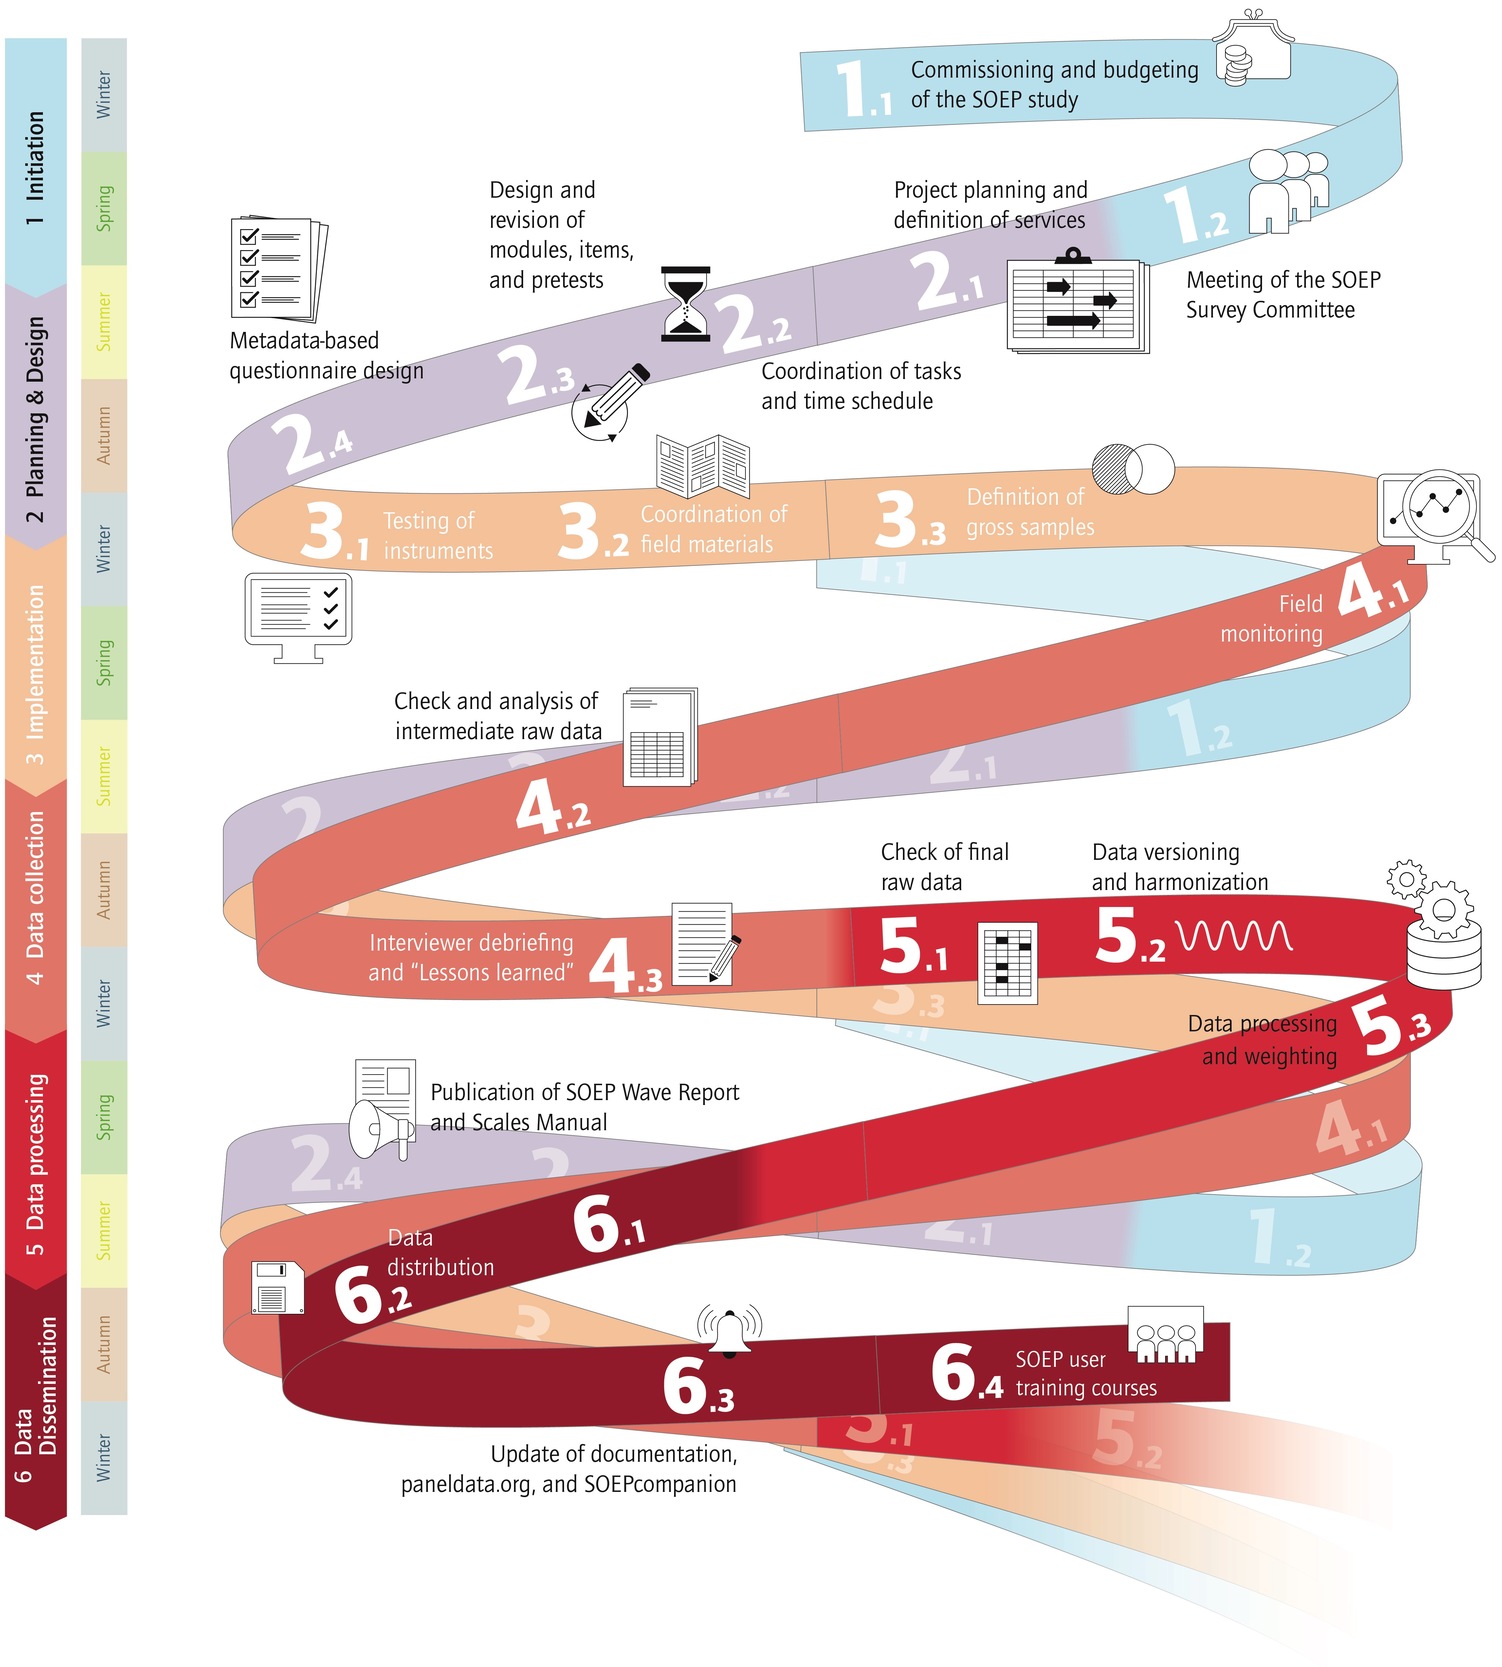
Longitudinal studies not only differ in design or field duration from cross-sectional surveys but often go along with overlapping processes for the different panel waves. LSLS should therefore be understood as a dynamic planning and reflection framework that supports study-specific, learning-based adjustments over time. A key advantage of this approach is that it makes complex temporal structures and interdependencies easier to grasp through visualization. The first step in applying LSLS is to map out all planned tasks and milestones in detail. A spiral visualization is particularly useful here, as it provides an intuitive way to represent recurring survey waves over time (see Figure 2). In the next step, the spiral is duplicated and shifted downward, aligning subsequent waves beneath the initial one. Repeating this process until the full study period is covered creates a layered view of overlapping processes of the panel waves. This visualization helps to identify when tasks from different waves coincide, thereby revealing cross-wave dependencies, potential overlaps, and opportunities for coordination throughout the longitudinal study.
_applied_to_soep__visualizing_overlapping_surve.jpg)
Figure 2 applies this logic to the SOEP, mapping the chronological order of tasks across waves onto the six LSLS phases introduced above. One full turn of the spiral corresponds to the one-year cycle between SOEP wave starts. Layering successive waves visualizes how activities overlap over time.
The use of LSLS also reveals opportunities for optimization in time and resource planning, as it visualizes overlaps where tasks do not depend on one another. In SOEP, for example, it has become standard practice in recent years to define datasets and variables for data dissemination already at the end of the Planning & design phase. This provides greater clarity about the structure of the final data product and saves time in later phases. A second example involves exporting programmed instruments from metadata templates, which streamlines the time required for testing and translation. Similarly, using preliminary or mock final data sets helps speed up the preparation of comprehensive data validation scripts.
Implications for Survey Practice
Building on the organizing and quality-assurance functions of the traditional SLC, LSLS underscore the need to move beyond wave-by-wave planning toward an integrated management of time, resources, and survey processes across waves. The spiral-shaped representation makes overlaps and cross-wave interdependencies visible. In this way, the framework supports informed scheduling decisions and facilitates coordination among teams responsible for survey management, data collection, and data processing. Rather than treating survey waves as largely independent repetitions, LSLS make explicit which phases can overlap and which milestones require completed inputs from earlier waves. This perspective is particularly relevant in settings where multiple survey waves need to be conducted simultaneously and where budget constraints imply that personnel or technical resources are shared across tasks. As illustrated by the SOEP examples above, LSLS enable integrated management that directly improves process efficiency and resource allocation across waves.
From a quality-assurance perspective, LSLS ensure the systematic timing of feedback loops across waves, allowing survey teams to identify and address data quality issues earlier and more effectively. Field monitoring results, interim data analyses, and collaborative feedback gain additional value when they are not only documented retrospectively but deliberately integrated into initiation, planning, and implementation stages of the next panel wave(s). Embedding such learning processes into longitudinal time and resource planning enables survey teams to address emerging issues early, to refine survey instruments continuously, and to balance increasing demands for timely data dissemination with sustainable quality standards. In this way, the LSLS framework is a needed tool for improving efficiency and accelerating data availability while maintaining careful control over TSE in complex longitudinal studies.
Longitudinal studies commonly share the challenge of coordinating interdependent processes across waves. In practice, they already exchange experiences on how to manage these challenges, but such knowledge often remains informal and fragmented. LSLS offer a shared conceptual framework that can make these experiences more comparable and easier to communicate across studies. It can also support exchange formats among survey practitioners, such as workshops and practitioner networks, by providing a common language for discussing coordination, timing, and process integration across waves. In this way, LSLS not only facilitate practical improvements in longitudinal survey operations but also contribute to the more systematic documentation and dissemination of methodological knowledge in the field.
Acknowledgement
The authors gratefully acknowledge Stefanie Reeg for her valuable support in the graphical design and preparation of the figures.
Corresponding author contact information
Florian Griese, fgriese@diw.de, Socio-Economic Panel, German Institute for Economic Research, Berlin, Germany