Introduction
Latino People are a Hard-to-Survey Population
Latino and Spanish-speaking households are underrepresented in surveys of the United States and are a hard-to-survey population (Brown 2015; Ceballos et al. 2014; Hughes et al. 2019; Martinez-Hollingsworth et al. 2022; Rojo et al. 2024; Sha et al. 2017). When survey materials are only in English and interviewers are not bilingual, Latino people with limited English proficiency are excluded. Latino people living in rural areas are less likely to respond to surveys due to limited internet access, non-standard mailing addresses, and the transience of migrant farmworkers (Gold and Su 2019). Older Latino people with more traditional cultural beliefs and less formal education have been shown to have concerns about research credibility, and do not see direct benefits to themselves, their families, or their communities (De Ver Dye et al. 2021; Hughes et al. 2019; Larkey et al. 2009; Sage et al. 2018).
Reliance on web-only data collection, address-based sampling (ABS)-only frames, and English-only study materials limits the participation of Latino adults. Latino adults are less likely than White, non-Hispanic adults to have broadband internet access (Pew Research Center 2024). Latino adults are more likely to live in cell-phone-only households (Blumberg and Luke 2025), and older Latino adults report computer and connectivity problems that hinder online participation (Gutiérrez et al. 2022). An ABS-only approach limits participation among rural Latino adults, especially migrant farmworkers who face financial barriers to stable housing (Canizales 2025).
Responsive and Adaptive Survey Designs
Even carefully planned studies can fall short of expected response rates. A responsive and adaptive survey design (RASD) provides researchers with real-time feedback to modify data collection methods (Robert M. Groves and Heeringa 2006). By leveraging real-time data, RASD can reduce nonresponse bias and improve data quality (Chun et al. 2018; R. M. Groves et al. 2000; Zhang and Wagner 2024). Depending on the timeline and budget, various study components can be modified, such as materials, contacts, Caller ID, pre- and post-incentives, and sample design (Dillman et al. 2014).
A core principle of RASD is advanced planning. Before data collection, teams should identify which modifications their budget and timeline can accommodate. This includes anticipating potential issues, specifying monitoring indicators, and pre-identifying feasible solutions. As data collection signals emerge, such as unexpectedly low response rates, teams quickly implement planned adaptations. Pre-planning also enables efficient resource allocation. For example, structuring data collection in multiple waves creates decision points for modification. Teams can purchase sample and print materials incrementally between waves, adjusting quantities and specifications. Having adequate time is critical. Modifications, such as translating revised letters, analyzing interim data, and coordinating with sample vendors, require substantial lead time. Without pre-planning, teams risk exhausting their budget and timeline on ineffective protocols and missing opportunities to course correct.
The 2024 Community Health Survey
Initial Study Design
The Policies Influencing Rural Latino Health (PIRLH) Study is a cross-sectional study of the impact of policy contexts and direct encounters with institutions that implement policy, funded by the National Institute on Minority Health and Health Disparities. One component was the 2024 Community Health Survey (CHS), which examined the association between mental health and health care access and immigrant policies among Latino adults in rural regions of sixteen counties in Arizona and California. The CHS was designed to conduct 3,000 interviews.
Targeting hard-to-survey individuals, we designed a dual-frame study using ABS and a prepaid cell phone sample to conduct surveys via web and phone. Research indicates that migrants and individuals with low socio-economic status disproportionately rely on prepaid or “burner” phones (Sandberg et al. 2016). Therefore, we included prepaid cell phone numbers to improve coverage and representation of these populations. Using vendor flags, we stratified the ABS sample by households identified as Likely Hispanic, Likely Non-Hispanic, and Race/Ethnicity Unknown, and the prepaid cell phone sample as Likely Hispanic and Race/Ethnicity Unknown.
Eligible respondents were required to be part of a sampled household, consider themselves Hispanic or Latino, live in a rural region of the sixteen counties, and be at least 18 years old. To identify rural households, we used the Rural-Urban Commuting Areas (RUCA) provided by the Economic Research Service (ERS) of the United States Department of Agriculture (USDA). We included areas with a RUCA code 4 (micropolitan area core: the primary commute to work is within an urban cluster of 10,000 to 49,999 people) through 10 (rural areas; the primary commute to work is outside urban areas and urban clusters).
Surveys with complex sample designs and rare populations are most effectively conducted in waves. The principal reason is that the exact number of households to be invited to achieve a survey response (survey yield) is unknown at the outset. Multiple waves enable measuring yield and eligibility in the first wave and adjusting the number of sample records released in subsequent waves to arrive at the final number of desired completed interviews. The first wave was designed to mail and dial a sufficient sample to assess participation rates and provide information to modify plans as needed for Waves 2 and 3. We mailed 25 percent of the ABS sample and dialed 25 percent of the cell sample in Wave 1.
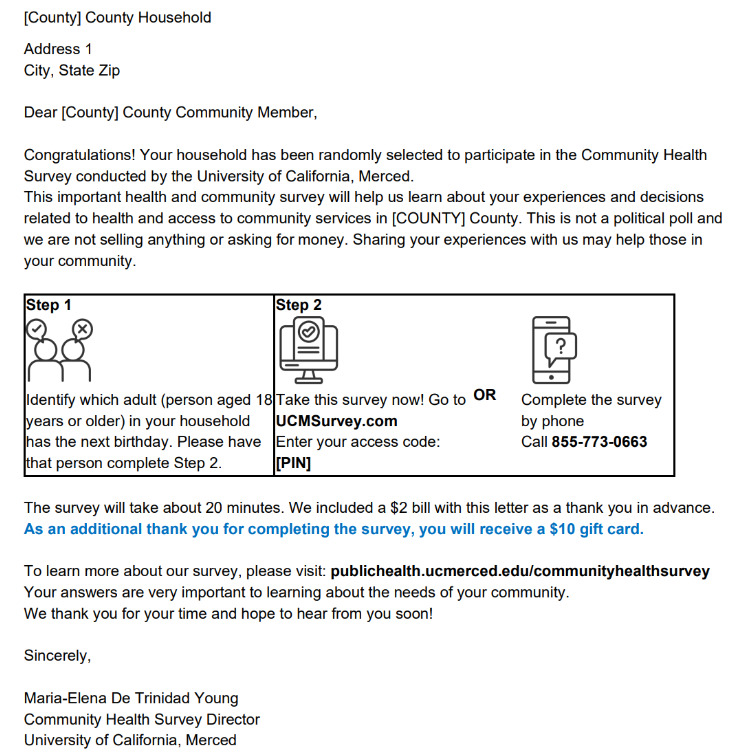
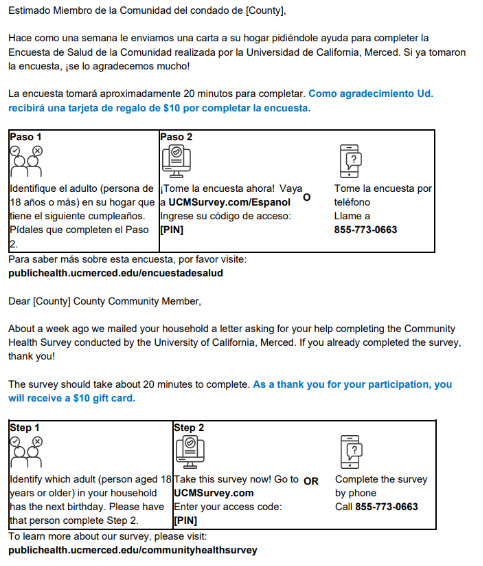
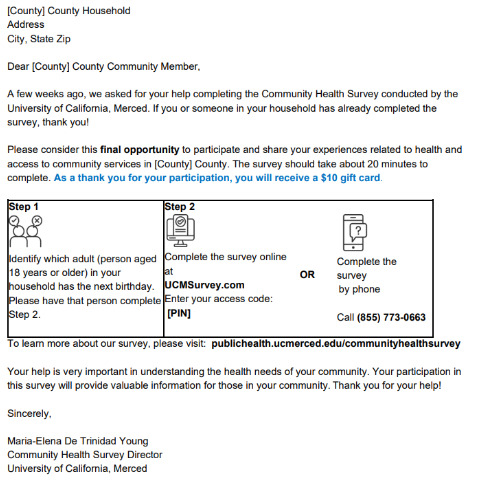
We used a three-mailing strategy to encourage response from the ABS sample. We mailed an invitation letter, followed by a reminder postcard one week later, and a second invitation letter to nonrespondents one and a half weeks later. Mailings were in English and Spanish and included a push-to-web and a phone number for inbound phone interviewing. Each mailing included a graphic directing people to complete the survey, with instructions for responding, and the request to do so immediately. We provided URLs and webpages in English and Spanish and a unique PIN. Wave 1 included a prepaid $2 incentive visible in a window envelope, with cases randomly assigned to receive one $2 bill or two $1 bills.
We took several steps to ensure the study’s importance resonated and to increase trust and response rates. We used a Spanish-first approach to increase response as 40.5% of adults in the target Census tracts spoke Spanish (Hughes et al. 2019, 2021; U.S. Census Bureau 2024). The letters had Spanish on the front and English on the back, and the postcard included Spanish at the top and English at the bottom. The mailings were addressed to “[County] County Household” to increase personal relevance. The letters were printed on University of California, Merced letterhead and included the project director’s signature, a University of California, Merced professor.
Prepaid cell numbers were called at least three times, on different days and times of day, to reach respondents with varying availability. Interviewers left a bilingual message on voicemails.
The Responsive Approach
Two weeks into data collection, we identified a significantly lower-than-expected response rate: 34 percent of the expected interviews. We therefore needed to quickly make continuous adjustments until we identified an approach most likely to encourage response.
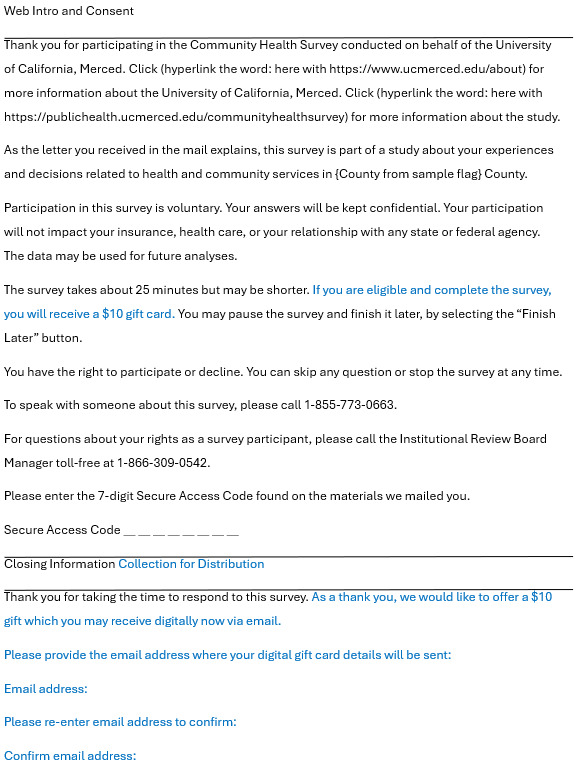
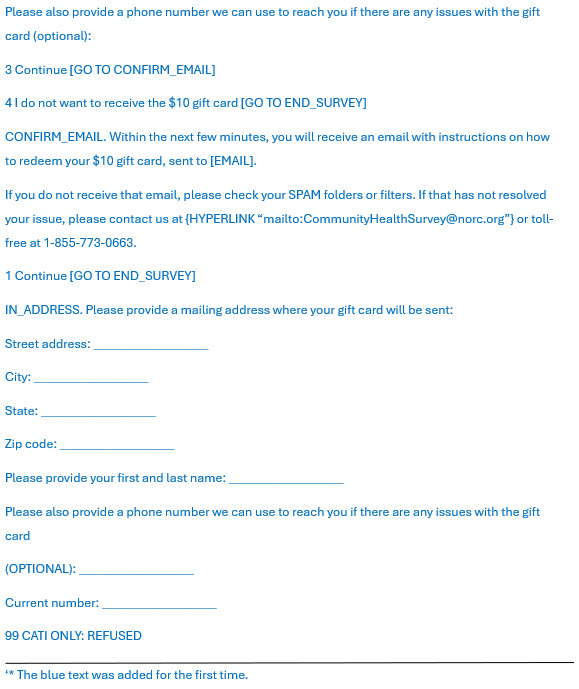
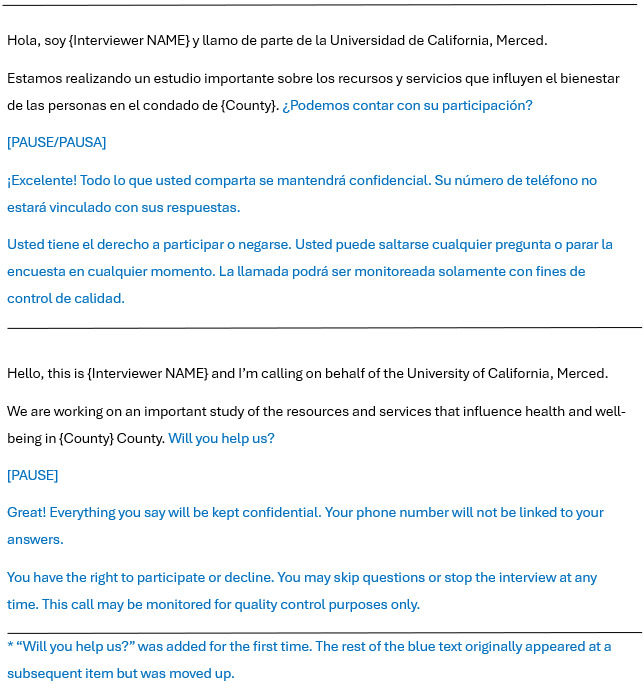
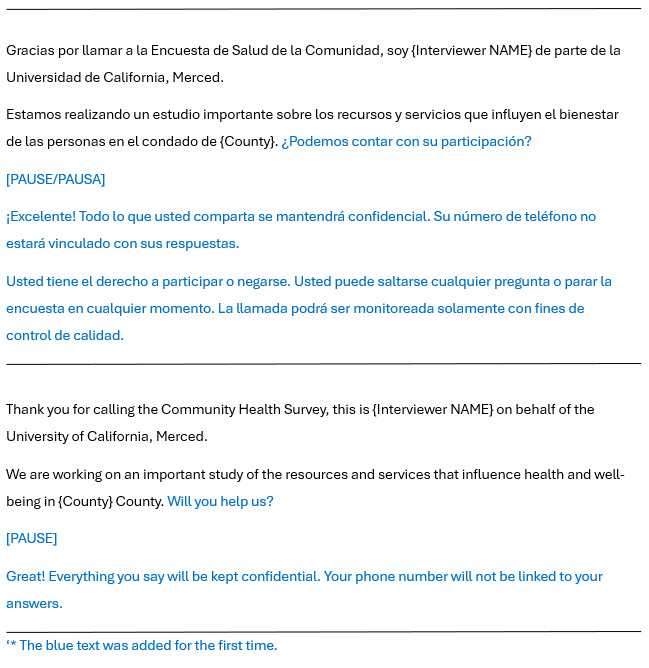
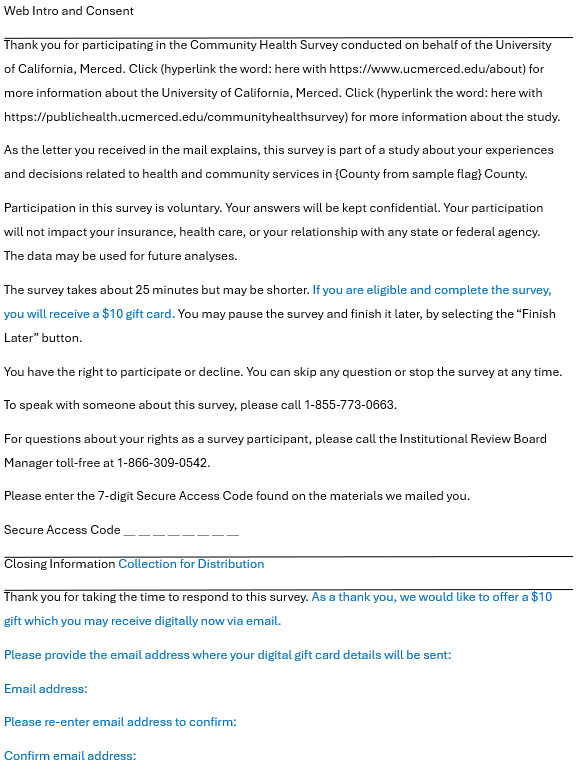
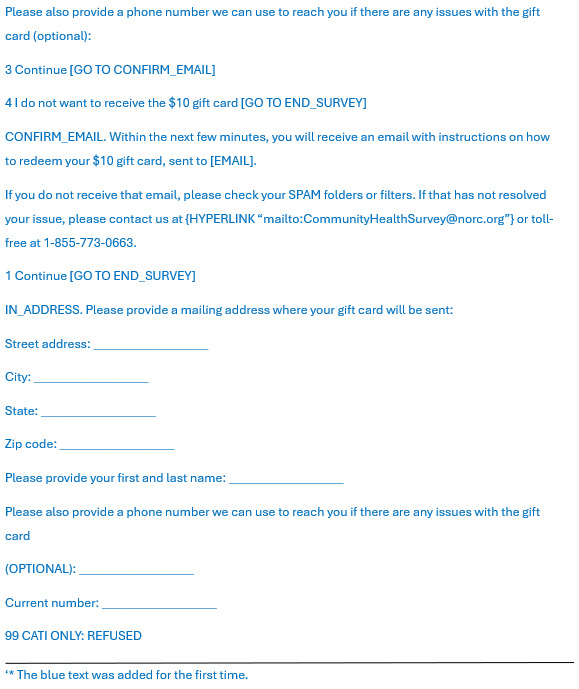
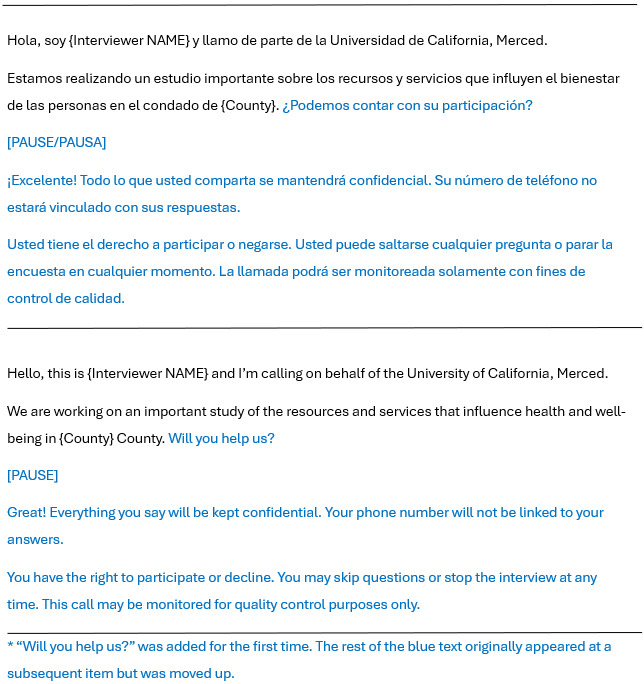
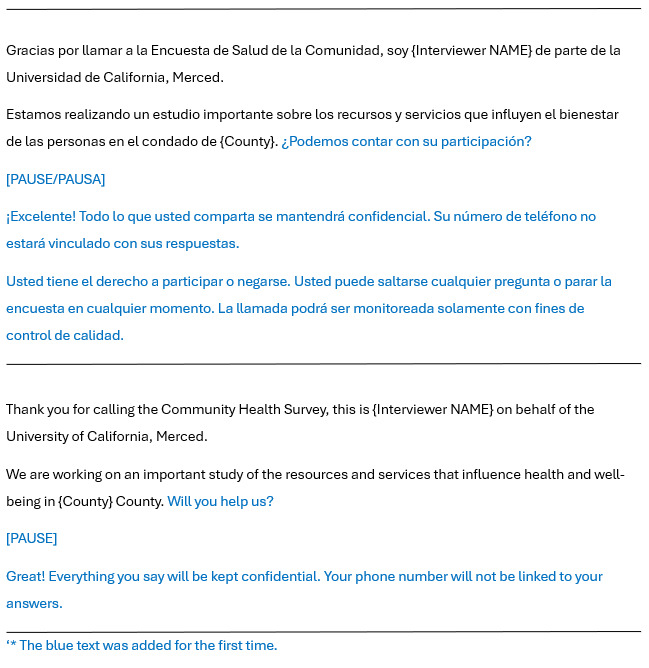
In Wave 1, we used early information from phone interview monitoring, interviewer feedback, and completed interview data to modify the cell phone protocols. To minimize hangups, we shortened the introduction and consent scripts, added a gaining cooperation tool for interviewers, and switched the default language to Spanish, as many households answered the phone in Spanish [Refer to Appendix Figures A1-A2]. We also tested Caller ID labels (e.g., “Encuesta de salud” or “Health survey”) and sent texts to unreachable ABS cases who had left a voicemail. During Waves 2 and 3, we continued exploring caller ID options and texting strategies. We began texting households with prepaid cell sample numbers who had not finished the survey to ask them to complete it.
We adapted our sampling design to better target our population of interest. We reduced the sample from the Race/Ethnicity Unknown ABS strata, stopped sampling the likely non-Hispanic ABS, and discontinued the unlisted prepaid cell. Given the limited available sample in some counties with a RUCA code of 4-10 flagged as likely Hispanic, and that some areas designated with a RUCA code 3 (a metropolitan area where less than 10 percent of workers commute to an urban area) are considered rural communities (e.g., California’s Central Valley), we expanded the criteria to include Census tracts assigned RUCA codes 3.
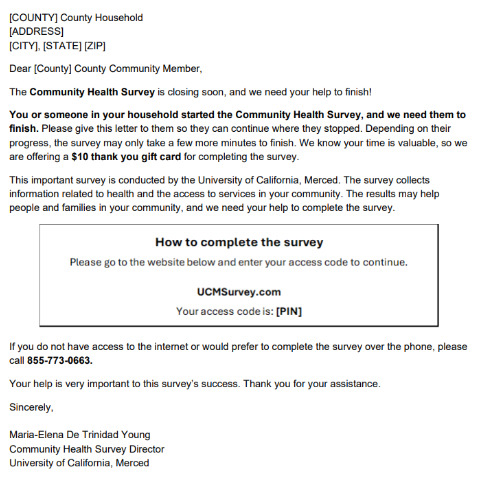
Finally, we adjusted our mail strategy and use of incentives. We designed a fourth mailing for households that started the survey but did not finish (partial completes). We added a $10 post-completion incentive with the third nonresponse follow-up (NRFU) mailing in Waves 1 and 2 and for all mailings in Wave 3 [Refer to Appendix Figures A3-A7]. As the post-incentive was introduced during Wave 2, the fourth mailing for Waves 1 and 2 was sent at the same time, past the end of Wave 1 data collection. We also targeted the third/fourth mailings in Wave 3 to underperforming counties and partial completes. Lengths of each wave varied based on the amount of sample and mailing holidays, ranging from 5-8 weeks, with Wave 2 being the longest. Refer to Tables 1 and 2 for modifications by sample and wave.
Research Questions
This paper seeks to address four research questions. First, does the denomination of the prepaid incentive affect response rates or respondent demographics? Second, do responsive design decisions affect response rates? Third, do responsive design decisions change who completed the survey across waves? Finally, what are the cost impacts of the responsive design changes?
Analysis
We first discuss the results of the Wave 1 prepaid incentive experiment and compare American Association for Public Opinion Research (AAPOR) RR3 response rates (AAPOR 2023) by experimental group, along with respondent demographic characteristics. Second, we compare AAPOR RR3 response rates by wave and sample type, followed by sample composition by wave and sample type. Finally, we compare the cost per complete based on data collection costs by wave and sample type. For sample composition analyses, we report Pearson chi-square statistics. Unless otherwise specified, analyses are based on unweighted data.
Results
Prepaid Incentive Experiment
For the Wave 1 experiment, one $2 bill was slightly more effective compared to two $1 bills (5.6% vs 4.9% RR3 (χ²(1) = 3.69, p = .055)). There were no significant differences across demographics between the two conditions (unweighted) (Table 3). Based on these results, we implemented the single $2 bill for Waves 2 and 3.
Wave-by-Wave Adaptations
Response rates by sampling frame and wave are in Table 4 (Overall 6.4%). The ABS sample showed the largest improvement, with Wave 1 significantly underperforming at 5.3 percent (AAPOR RR3) compared to 7.3 percent in Wave 2 and 7.9 percent in Wave 3 (χ²(2) = 89.22, p < .0001). Given the purposeful and substantive changes between Waves 1 and 2 (and subsequently Wave 3), this significant increase in response is likely due to the responsive changes implemented to address the lower-than-expected response in Wave 1. The Wave 3 ABS response rate was slightly higher than Wave 2 (χ²(1) = 3.19, p = .074), which may be a result of expanding the $10 post-incentive to all cases. For the prepaid cell sample, the only significant difference was between Wave 1 (0.9 percent) and Wave 2 (1.3 percent) (χ²(1) = 5.47, p = .019).
The sample composition of the ABS survey completes by wave is in Table 5. Wave 3 respondents were more likely to be under age 40 (41.5 percent) compared to Waves 1 (30.3 percent) and 2 (32.2 percent), and the 18–29 age group increased substantially in Wave 3. Offering the $10 incentive to all respondents from the start may have had a meaningful impact on certain age groups, given that the only other change for the ABS sample from Wave 2 was to send the third mailing to underperforming counties (see Table 1). Wave 3 respondents reported larger household sizes, with more households having four or more persons. They were also more likely to complete the survey in English (82.5 percent) than in Spanish, compared to earlier waves (77.7 percent and 79.4 percent).
Cost by Wave
Implementing a responsive design was more cost-effective. The cost per interview decreased across waves for ABS and prepaid cell samples (Table 6). For ABS, compared to Wave 1, the cost per completed interview declined by 34 percent in Wave 2 and by an additional 6 percent in Wave 3. The prepaid cell sample began at a much higher cost in Wave 1 (nearly 4.4 times the cost of an ABS complete) but showed similar reductions in later waves. By Wave 3, the cost per interview was 60 percent of that in Wave 1 for each sample type.
Discussion
To increase response rates among rural Latino adults in California and Arizona, we employed responsive sampling, incentives, and outreach. Guided by RASD, we refined strategies across three waves, improving response rates and exceeding our interview target. These results showed improved engagement and a more diverse sample across waves.
Wave 2 and 3 modifications increased response rates, but without an experimental design, we cannot pinpoint the source of the change. These modifications included reducing or removing unproductive ABS samples, expanding eligibility for a $10 postpaid incentive from partial completes (Wave 1) to NRFU and partial completes (Wave 2), and to all cases (Wave 3). We saw mixed results from modifying the prepaid cell sample, switching to Spanish-first scripts, shortening introductions, and experimenting with caller ID messages. While there was a significant increase in the cell phone response rate from Wave 1 to Wave 2, and the cost efficiency increased, the Wave 3 response rate did not differ significantly from Wave 1. Further exploration is needed to understand the effects of postpaid incentives, language choice, and caller ID, as the extent to which each influenced participation in this study remains unknown.
Demographic shifts across waves further illustrate the impact of these modifications. Wave 3 respondents were significantly younger and more likely to live in larger households, thereby contributing to the sample’s diversity. However, the proportion of Spanish-language interviews declined in Wave 3.
One of the most notable outcomes of the responsive approach was its effect on cost efficiency. Despite adding a $10 postpaid incentive, the cost per interview declined by at least 33 percent for the ABS sample and 40 percent for the prepaid cell sample compared to Wave 1. This counterintuitive result highlights that reaching respondents more effectively can offset the increased cost of post-incentives. By Wave 3, the cost per interview was 60 percent of Wave 1’s for both sample types, reinforcing the value of responsive design in improving response rates and optimizing resources.
This study contributes valuable insights into the design and implementation of surveys targeting hard-to-survey rural Latino adults. Through a responsive approach, we made data-driven decisions based on early indicators, improving response rates and cost efficiency. Future research should continue to explore incentive design, sample targeting, recruitment approaches, and language accessibility to isolate the effects of each modification and better engage Latino adults.
The study lacked experimental controls except for the $1 and $2 prepaid incentive experiment, limiting causal attribution of individual changes. Additionally, while we targeted Latino adults in rural areas, the generalizability of our findings to other Latino subpopulations or geographic regions remains uncertain. The reliance on commercial flags to identify likely Hispanic households also introduces potential bias, as these flags are imperfect proxies for ethnicity.
Corresponding author contact information
Hannah Murrow, MPA: hannahmurrow@uchicago.edu; 5235 South Harper Court, 4th Floor Chicago, IL 60615
Barbara M. Fernandez, MSPH: fernandez-barbara@norc.org; 300 E. Randolph Street, Suite 4600, Chicago, IL 60601
Lauren Sedlak, MPP: sedlak-lauren@norc.org; 300 E. Randolph Street, Suite 4600, Chicago, IL 60601
Brian M. Wells, PhD: wells-brian@norc.org; 300 E. Randolph Street, Suite 4600, Chicago, IL 60601
Simon Page: page-simon@norc.org; 300 E. Randolph Street, Suite 4600, Chicago, IL 60601
Maria-Elena De Trinidad Young, PhD, MPH: mariaelena@ucmerced.edu; School of Social Sciences, Humanities, and Arts, 5200 North Lake Road, Merced, CA 95343
Sharon Tafolla, PhD: stafolla@ucmerced.edu; School of Social Sciences, Humanities, and Arts, 5200 North Lake Road, Merced, CA 95343
Alec M. Chan-Golston, PhD: achan-golston@ucmerced.edu; School of Social Sciences, Humanities, and Arts, 5200 North Lake Road, Merced, CA 95343
_for_the_post-incentive.png)
.png)
.png)
.png)