1. Introduction
Web-based surveys have become a dominant mode of data collection in applied social science research because they reduce administrative costs, simplify data management, and support complex survey designs. However, web-based sampling becomes difficult when the target population is geographically narrow or highly localized. Commercial opt-in panels and probabilistic web panels often contain too few respondents within small geographic areas to support representative sampling, particularly when researchers require demographic stratification or location-specific analysis. This problem commonly arises in environmental valuation, infrastructure siting, recreation demand, and local policy research, where populations are defined by proximity to a resource, facility, or policy intervention.
A common alternative is to use a mail survey or a mail-push-to-web design in which households receive a mailed invitation directing them to an online questionnaire, often through a QR code or web link. While such approaches can be effective, they also present limitations. Response rates are frequently low, follow-up contact can be difficult when respondents do not initially engage, and researchers do not obtain a reusable e-mail contact list for future survey waves or panel recruitment. These limitations are especially important in studies that require repeated contacts, reminder waves, or follow-up surveys.
This paper examines an approach for constructing probabilistic e-mail survey panels from address-based samples (ABS). Under the method, households are first selected from an address-based sampling frame and then contacted by mail with a request to provide an e-mail address for participation in a subsequent web survey. Once the e-mail list is established, researchers can administer internet-based surveys using conventional reminder protocols while maintaining the geographic targeting advantages of address-based sampling. The approach is particularly useful in settings where commercial survey panels cannot provide sufficiently representative samples over narrow geographic areas.
A central issue in the success of this recruitment strategy is whether households are willing to provide an e-mail address in response to a mailed solicitation. Concerns over privacy, unsolicited contact, and expected survey burden may reduce participation rates. The survey methodology literature consistently finds that prepaid monetary incentives increase survey participation rates across a wide range of survey modes and populations (Church 1993; Mercer et al. 2015; Singer and Ye 2013). However, most previous studies examine incentives in the context of survey completion rather than recruitment into a future web-based survey panel.
We evaluate the ABS-to-e-mail recruitment approach using two survey applications—one concerning recreational use of an urban river system and the other examining coastal property owners’ views regarding offshore wind development—and a set of incentive pretest experiments for both. In both cases, the geographically narrow target population limited the usefulness of existing commercial web panels. Across both applications, we analyze recruitment outcomes under alternative incentive structures, multiple contact waves, and several response modes (mail, e-mail, and text). We also examine the cost-effectiveness of alternative incentive strategies and estimate the sample sizes required to achieve target recruitment levels.
2. ABS-to-E-Mail Recruitment Design
The ABS-to-e-mail recruitment approach begins with the selection of a random address-based sample from the target population. The sampling frame may be obtained from commercial survey vendors, property ownership records, or other address-based sources and can be stratified if desired. Households are then contacted by mail and asked to provide an e-mail address for participation in a subsequent web survey. Follow-up reminder mailings are sent to nonrespondents in order to improve recruitment rates. Once collected, the e-mail addresses form the basis for administering internet-based surveys and conducting subsequent reminder waves or follow-up studies.
We evaluate the recruitment method using two survey applications. The first concerns recreation use along an urban river system (“Urban Study”), while the second examines coastal property owners’ views regarding offshore wind development (“Coastal Study”). In both cases, the target populations were geographically narrow, limiting the usefulness of existing commercial web panels. Prior to implementing the full surveys, pilot recruitment experiments were conducted to evaluate the feasibility of the ABS-to-e-mail approach and to examine the effects of alternative monetary incentives on recruitment outcomes. These pilot experiments are referred to as the “Urban Test” and “Coastal Test.” The pilot experiments and full survey applications were conducted between 2020 and 2021.
In the Urban Test, a sample of 500 households was drawn from residents living within the county surrounding the river study area. The households were randomly assigned to five equal-sized groups that differed only in the prepaid cash incentives included in the recruitment mailings. Table 1a summarizes the incentive structures. The total incentive amounts ranged from no incentive to a cumulative value of $42 across the mailing waves. Households were contacted through an initial recruitment letter followed by two reminder mailings. Recipients could provide an e-mail address through mail, e-mail, or text response. A prepaid return envelope was included for mail responses.
The Coastal Test followed the same general recruitment procedure but focused on owners of coastal residential properties located near a proposed offshore wind development area. In this case, all households (n = 200) received the incentive structure shown at the bottom of Table 1a. The final contact wave targeted nonrespondents and included a brief follow-up questionnaire along with one final opportunity to provide an e-mail address. Unlike the earlier mailings, responses to the final contact were returnable by mail only.
The full Urban and Coastal surveys subsequently adopted incentive structures informed by the pilot experiments. Table 1b summarizes the incentive amounts used in the two full survey applications.
The empirical analysis focuses on several dimensions of recruitment performance. First, we examine overall recruitment rates across incentive treatments and applications. Second, we analyze the timing of recruitment across successive mailing waves in order to evaluate the marginal contribution of follow-up contacts. Third, we compare response modes (mail, e-mail, and text) to assess how alternative reporting mechanisms affect participation. Finally, using observed recruitment rates and mailing costs, we estimate the sample sizes and total costs required to achieve target recruitment levels under alternative incentive strategies.
3. Results
3.1. Recruitment Rates and Incentive Effects
Table 2 reports recruitment outcomes for the two pilot experiments and the two full survey applications. The Urban Test provides the clearest evidence regarding the effect of monetary incentives because households were randomly assigned across five incentive treatments ranging from no incentive to a cumulative incentive of $42 across mailing waves.
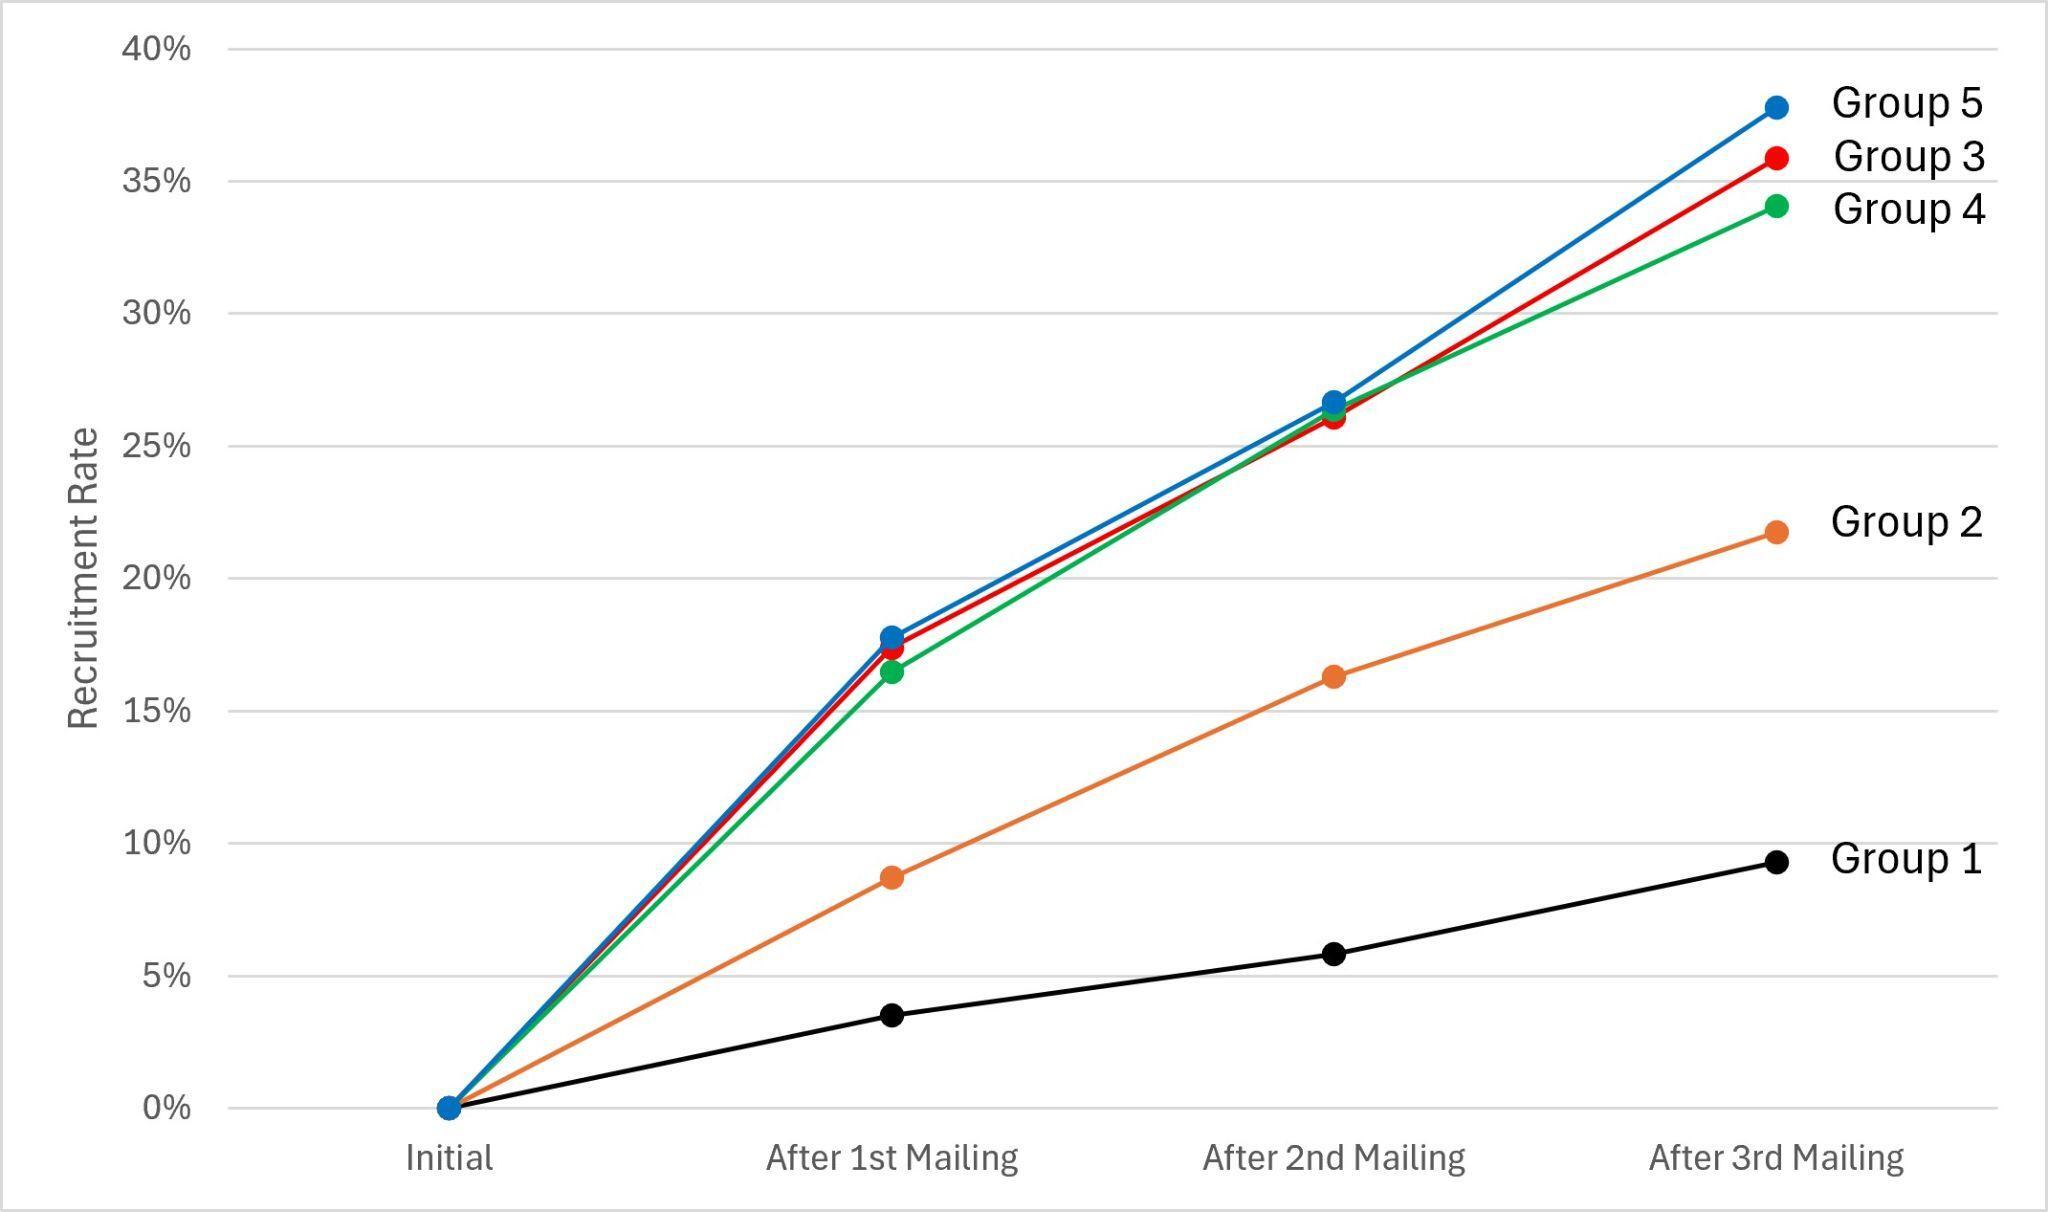
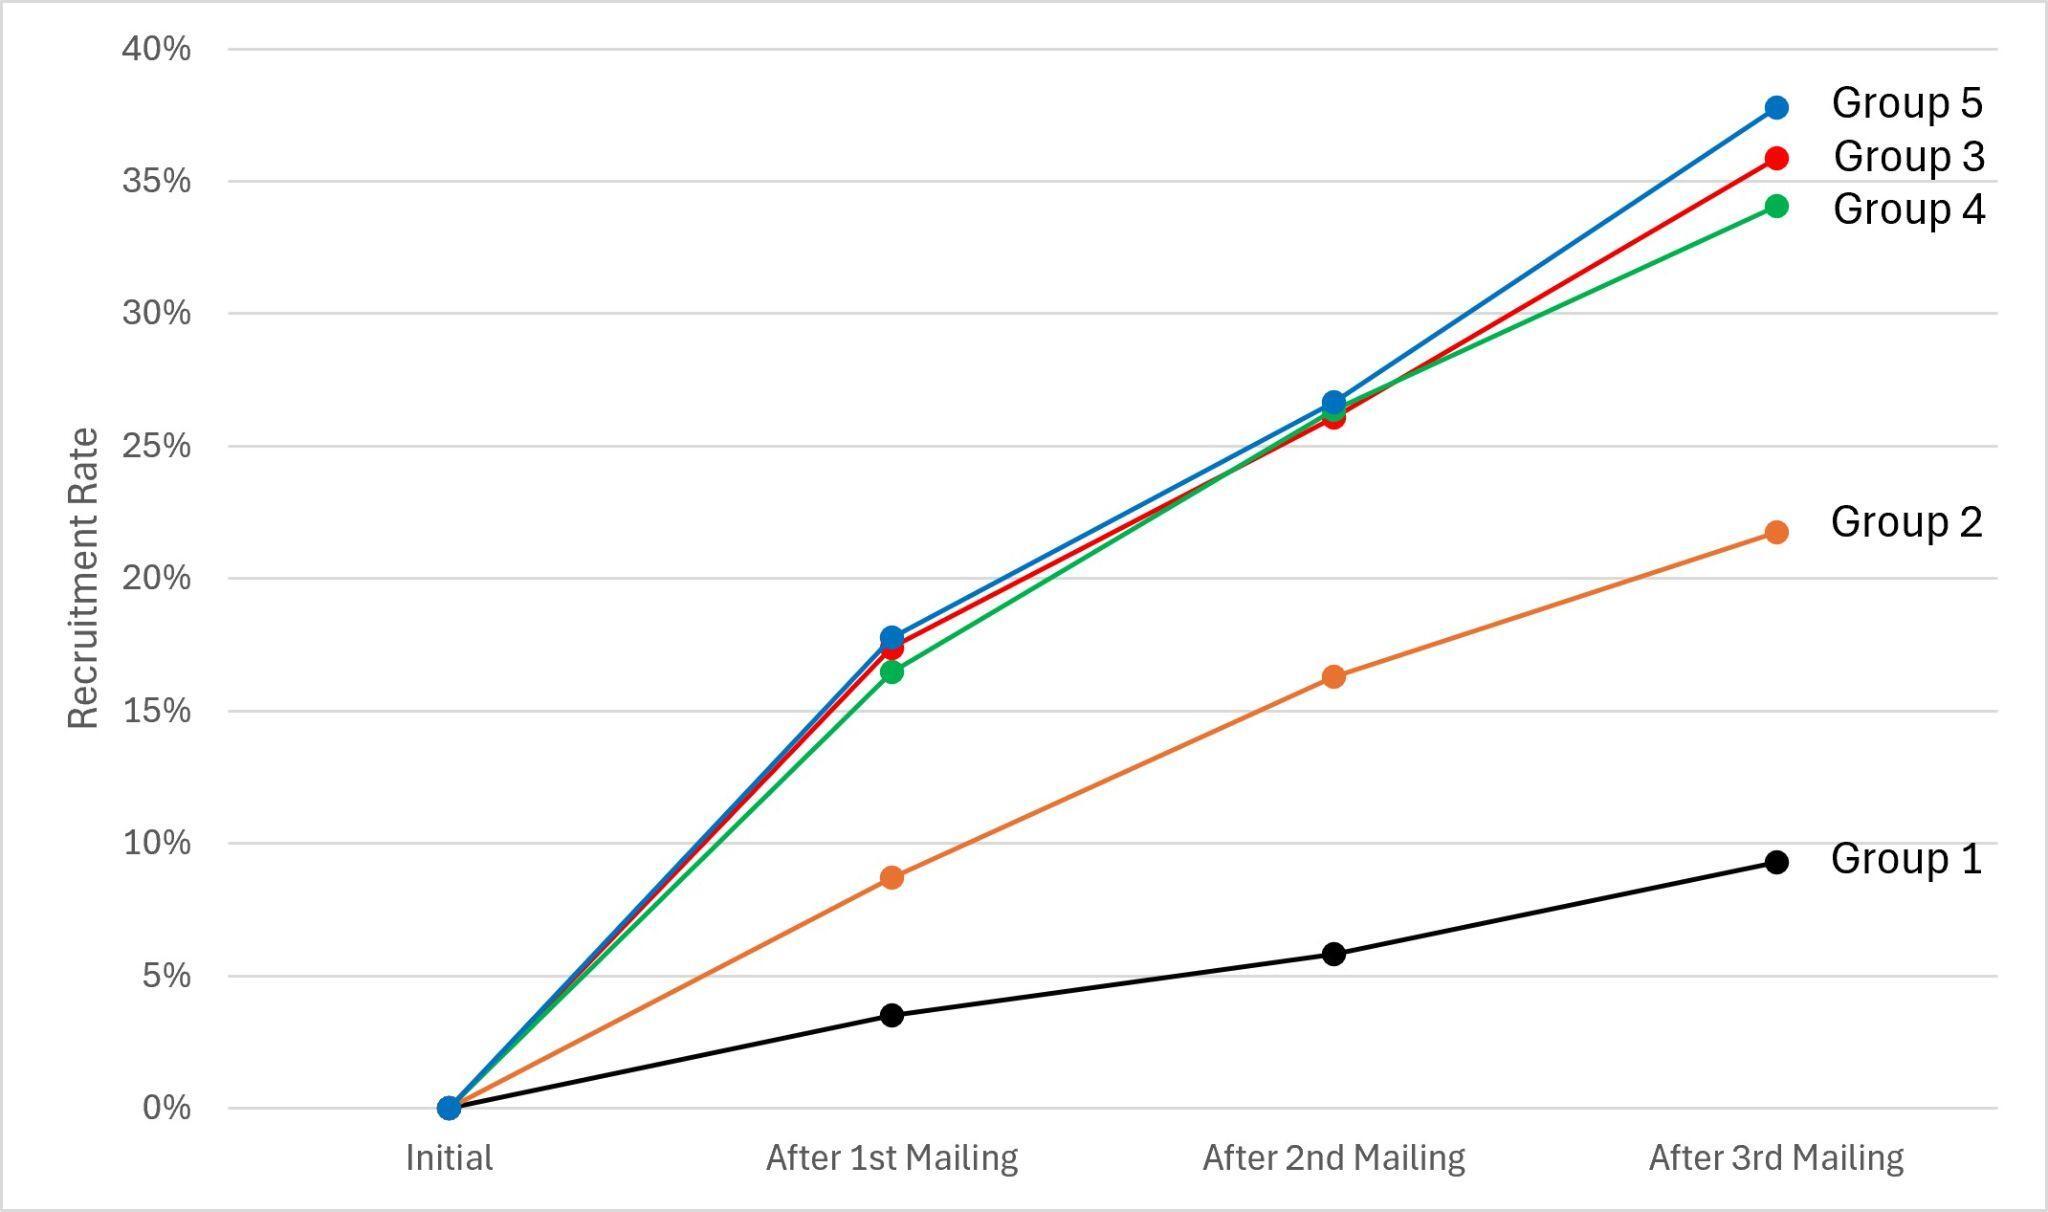
The results show a strong positive relationship between prepaid cash incentives and recruitment rates, particularly between the no-incentive and moderate-incentive treatments. Recruitment increased from 9% in the no-incentive treatment to 22% under the $2-centered incentive structure and to 36% under the $5-centered structure. Beyond this level, the marginal gains from larger incentives were limited. Recruitment rates under the $10- and $20-centered incentive structures were 34% and 38%, respectively, indicating substantial diminishing returns to higher incentive payments.
The Coastal Test produced substantially higher recruitment rates than the Urban Test, reaching 56% under the $5-$0-$5-$2 incentive structure. Recruitment rates were similarly high in the Coastal Study, which achieved a 63% recruitment rate. The Urban Study, by comparison, achieved a recruitment rate of 33%, close to the Urban Test results under the Group 3, 4, and 5 incentive treatments.
The difference between the Urban and Coastal applications likely reflects differences in respondent engagement and issue salience. The coastal sample consisted primarily of older, wealthier, and highly educated coastal property owners with a direct financial and personal interest in the offshore wind project under study. In contrast, the urban sample reflected a broader and more heterogeneous population with weaker connections to the survey topic. These results suggest that recruitment performance depends not only on incentive levels but also on the perceived relevance and salience of the underlying survey issue.
3.2. Recruitment Timing Across Mailing Waves
Figure 1 shows the cumulative recruitment rate across successive mailing waves. Groups 3, 4, and 5, the higher incentive groups, are nearly the same and are consistently higher than the lower incentive groups. The right-hand side of Table 2 shows the same data in terms of the share of all recruits made up by each wave. In all cases, recruitment was highest in the first wave, typically accounting for 40% to 50% of all recruitments (see 1st Mailing column in Table 2).
Although the contribution of later mailings declined across waves, reminder contacts continued to generate meaningful additional participation. The second and third mailings together accounted for roughly half of all eventual recruitments in most applications. In the Coastal Test and Coastal Study, the final nonrespondent follow-up generated relatively small but nontrivial additional recruitment gains.
Figure 1 further illustrates how incentive effects differed across mailing waves in the Urban Test. The largest differences across incentive treatments emerged during the first mailing wave, particularly between the no-incentive and moderate-incentive groups. In later waves, recruitment gains were similar across treatments, suggesting that the marginal effect of incentives declines over successive contacts. In other words, higher incentives appear most effective in motivating early participation rather than converting persistent nonrespondents.
3.3. Logistic Regression Results
We also estimated a simple binary logit model using the Urban Test data in which the dependent variable equals one if a household provided an e-mail address and zero otherwise. The explanatory variables included incentive levels and mailing-wave indicators discussed in the previous sections. This provides a more formal test of the incentives and timing.
Table 3 reports the estimated coefficients. The results confirm the patterns observed in the descriptive analysis: recruitment probabilities increase substantially between the low- and moderate-incentives with diminishing gains at higher amounts. The monotonic stepwise increase in coefficients going from $1 to $20 (aside from the dip for $10) is evidence that the amount of the incentive matters. Note that the incentive levels in the model may occur at different mailings – so for example $2 occurs in the first mailing for Group 2 but in the second mailing for Groups 3, 4, and 5.
The regression results also show the importance of contact timing. Recruitment probabilities were highest during the initial mailing wave and declined across subsequent contacts, consistent with the descriptive evidence presented in Table 2 and Figure 1. These findings reinforce the conclusion that prepaid incentives are most effective in generating early participation rather than converting persistent nonrespondents in later recruitment waves.
Finally, we considered a model with interactive terms (timing × incentive) to see if timing affected incentive levels differently. There was little effect along these lines.
3.4. Response Modes
Table 4 shows the distribution of responses across the alternative methods available for providing e-mail addresses. Across both the pilot experiments and the full survey applications, respondents used all three response modes—mail, e-mail, and text—indicating that mixed-mode recruitment broadened participation opportunities.
Mail (postal) responses accounted for the largest share of recruitments in most applications, generally representing approximately 40% to 50% of total responses. E-mail responses were the second most common mode, while text responses consistently represented a smaller but still meaningful share of recruitments. The relative stability of these patterns across the Urban and Coastal applications suggests that respondents value flexibility in how they provide contact information. The mail responses suggest that some households may be willing to participate in a web-based survey once recruited but remain reluctant to initiate contact electronically during the recruitment stage. Also, the higher use of the postal response in Groups 1 and 2 relative to the other Groups implies that respondents requiring lower inducement to participate are less inclined to use digital modes of response. If one accepts that older (retired) and less educated respondents are more likely to use the postal response, this may suggest that this demographic requires a lower incentive.
3.5. Cost-Effectiveness of Incentive Strategies
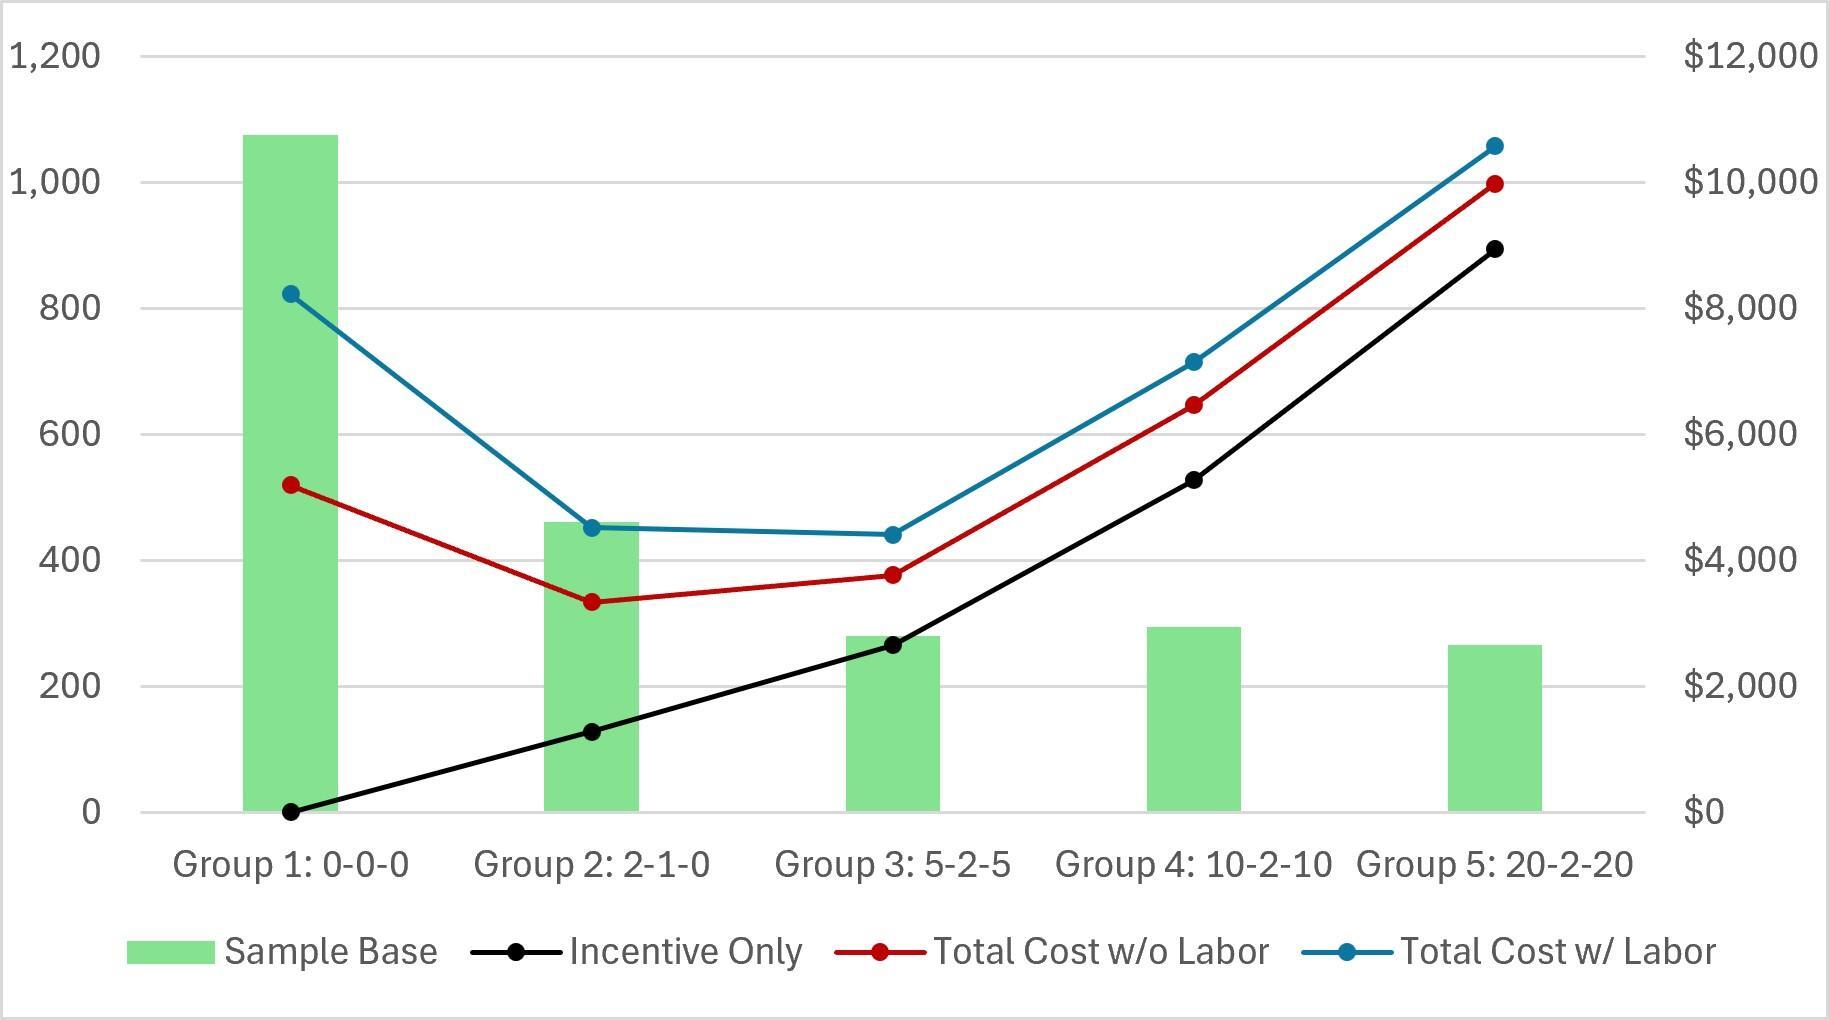
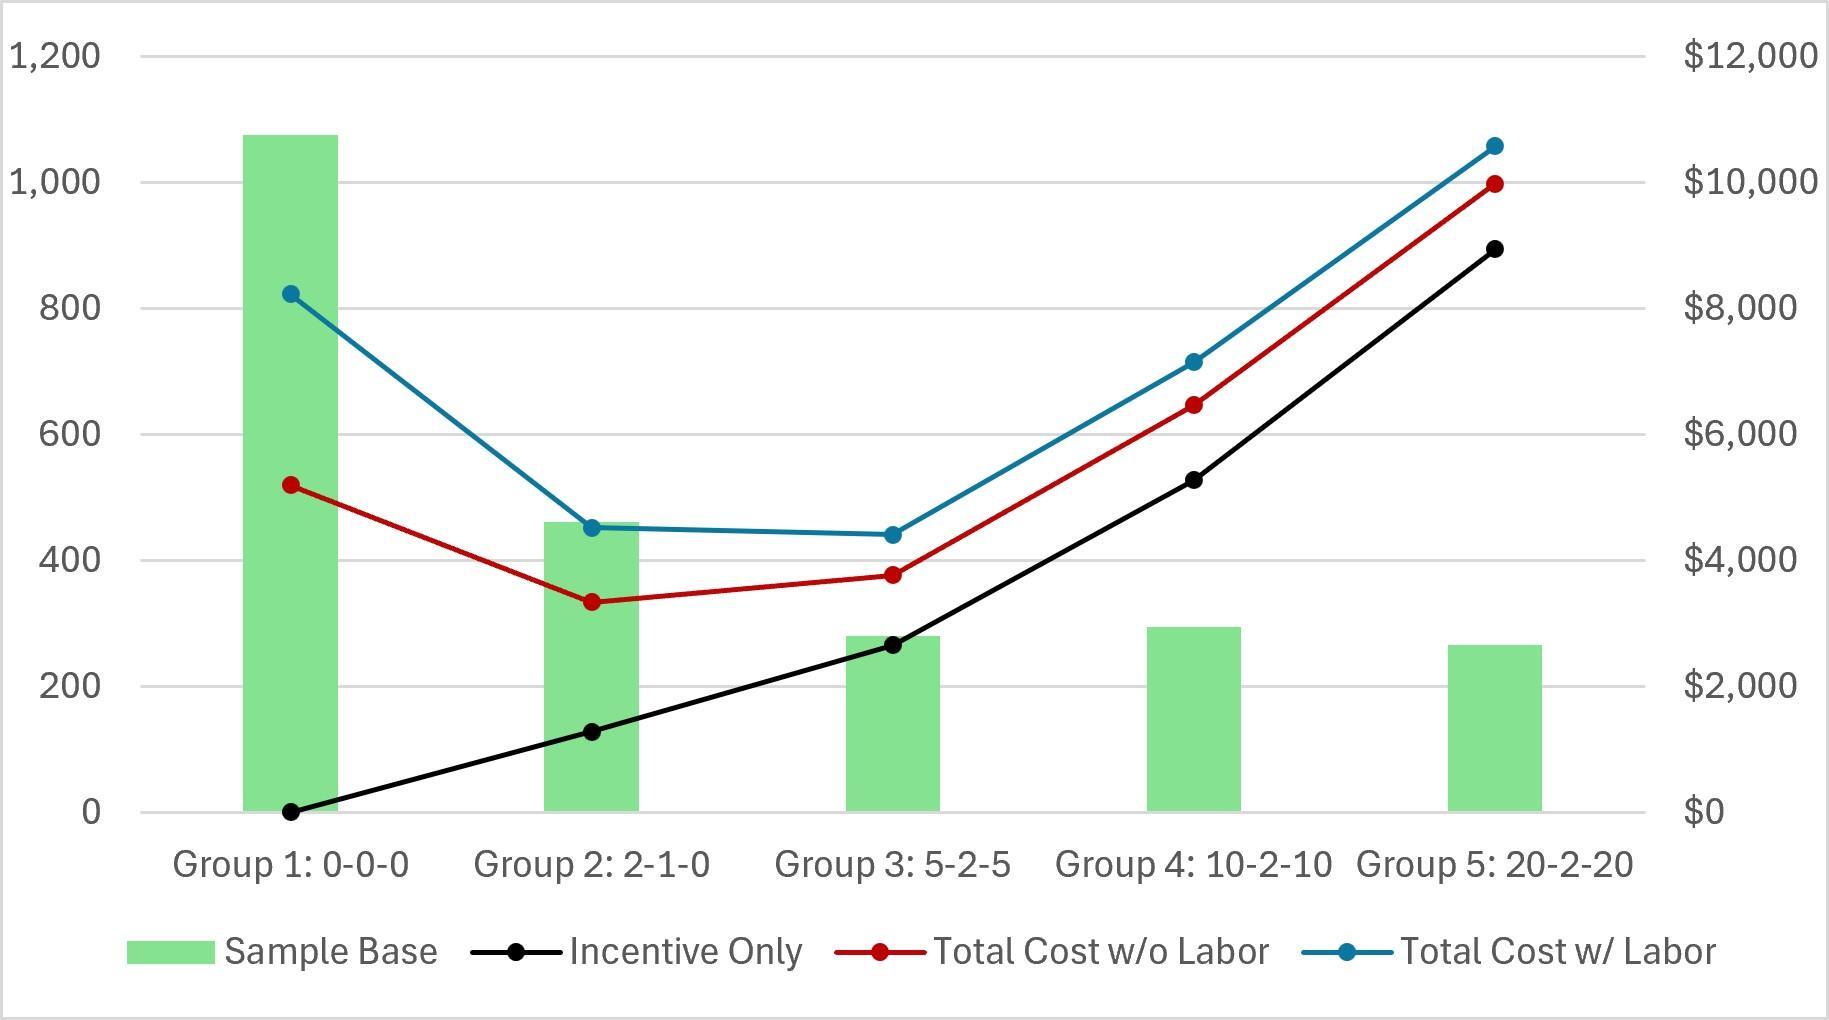
Table 5 evaluates the sample sizes and total recruitment costs required to obtain 100 recruited participants under the alternative incentive structures used in the Urban Test. The estimates incorporate realized recruitment rates along with mailing, materials, postage, and labor costs.
The results highlight an important tradeoff between incentive payments and operational costs. Low or zero incentives reduce direct incentive expenditures but require substantially larger initial mail samples because of lower recruitment rates. The no-incentive treatment would require more than 1,000 mailings to obtain 100 recruited participants, whereas the moderate incentive treatments achieve comparable recruitment targets with sample sizes below 500 households.
Once mailing and labor costs are incorporated, moderate incentive strategies become more cost-effective than either no incentives or very large incentives. The $5-centered incentive structure produced the lowest estimated total cost per 100 recruited participants while also generating one of the highest recruitment rates. The $2-centered incentive generated similar overall costs but substantially lower recruitment rates, while the higher incentive treatments produced gains too small to offset increased expenditures. Figure 2 replicates data in Table 5 (columns 2 and 3), providing a visual representation of this relationship.
4. Discussion and Implications
This paper examines a method for constructing probabilistic e-mail survey panels from address-based samples and evaluates the role of prepaid monetary incentives in improving recruitment outcomes. The results suggest that the ABS-to-e-mail approach is a feasible strategy for constructing geographically targeted web-survey panels, combining the sampling advantages of address-based frames with the flexibility of internet survey administration.
Consistent with prior work on survey incentives (Church 1993; Mercer et al. 2015; Singer and Ye 2013; Trussell and Lavrakas 2004), we find that prepaid cash incentives substantially increased recruitment rates, with diminishing marginal returns beyond moderate payment levels. Across the applications considered here, moderate prepaid incentives produced the most favorable balance between recruitment performance and total recruitment cost. “Moderate payment levels” in our case are $5 on the first mailing, followed by $2 in a second mailing, and $5 in a third mailing.[1]
The results further suggest that the effectiveness of recruitment strategies depends partly on respondent engagement and issue salience. Recruitment rates were substantially higher in the coastal applications than in the urban applications, likely reflecting differences in respondents’ personal and financial interest in the survey topic. This finding suggests that incentive performance cannot be evaluated independently of the broader survey context and target population. The analysis of recruitment timing also highlights the importance of early engagement. Across applications, the largest share of successful recruitments occurred following the initial mailing wave, with later contacts generating progressively smaller gains. At the same time, reminder mailings continued to produce meaningful additional recruitment, indicating that repeated contacts remain an important component of ABS-to-e-mail recruitment strategies.
The cost analysis underscores that incentive strategies should be evaluated on total recruitment costs, not incentive expenditures alone. Lower incentive amounts may reduce direct payment costs but can require substantially larger mailing efforts and follow-up contacts because of lower recruitment rates. Similar tradeoffs are discussed by Carter et al. (2025) in their comparison of mail-push and e-mail-based recruitment strategies. In the applications examined here, moderate incentive strategies achieved relatively high recruitment rates while minimizing overall recruitment costs.
Finally, the results support the use of mixed-mode recruitment procedures that allow respondents to select the reporting mechanism most convenient or comfortable for them. Providing multiple response options appears to reduce participation barriers and improve recruitment efficiency.
Several limitations should be noted. The applications considered here involve two environmental policy research contexts, and outcomes may differ in other settings. The analysis also focuses on recruitment rather than completion behavior in the subsequent web survey. Although recruitment and survey response are closely related, the effects of incentives on panel recruitment may differ from their effects on survey completion rates. Future research could examine how demographic characteristics, issue salience, and survey topics interact with incentive strategies in ABS-to-e-mail recruitment designs.
Overall, the findings suggest that ABS-to-e-mail recruitment provides a practical and flexible framework for constructing geographically targeted web-survey panels when existing commercial panel providers cannot adequately support representative sampling. To see the method in action, see Parsons and Shan (2027) for results corresponding to the Coastal Study and Chakrabartty and Parsons (2025) for the Urban Study.
Corresponding author contact information
George Parsons
gparsons@udel.edu
School of Marine Science & Policy, University of Delaware
The incentive amounts evaluated in this study reflect conditions in late 2020 and 2021. Subsequent inflation and increases in mailing and labor costs imply that the effective value and cost-effectiveness of specific dollar amounts may differ in more recent survey applications. As a result, the precise incentive thresholds identified here should be interpreted as approximate rather than fixed benchmarks.