Introduction
The common wisdom among survey scientists is that cash incentives are more effective at gaining response than alternative monetary incentives (e.g., gift cards) and non-monetary incentives (e.g., Abdelazeem et al. 2023; Birnholtz et al. 2004; Gajic et al. 2012; Singer and Ye 2013). This research has led to the mantra that “cash is king” in the incentive world. However, in a post-Covid world, who is still carrying and using cash?
Changes to consumers’ relationship with cash were accelerated with the ubiquity of contactless payment methods that arose during the pandemic (Dickler 2021). Besides handing over a credit or debit card, using one’s smartphone as a digital wallet can eliminate the need to carry a physical wallet, and therefore reduce the ease of carrying cash. The Federal Reserve reports that the distribution of types of point-of-sale payments has changed since 2016, predominantly due to the rise of mobile phone payments. In addition, consumers across all age groups have “more than doubled their use of mobile phone payments” since 2020 (Bayeh et al. 2025).
In data collected after the official end of the Covid-19 pandemic, Bayeh et al. (2024) found that while most respondents reported carrying cash on the day(s) of the survey (79%), using cash as a payment method is decreasing— e.g., 16% of all payments in 2023 and 14% in 2024 (Bayeh et al. 2025). Credit and debit cards are the most used payment types, making up 35% and 30% of all payments in 2024, respectively (Bayeh et al. 2025). Transactions under $25 were equally made by either cash or debit card for the first time in 2023, whereas in previous years cash was used more (Bayeh et al. 2024). In addition, payment apps unseated cash during the pandemic as the most popular way to make person-to-person payments (Bayeh et al. 2024). Researchers predict that the proportion of purchases using cash will not return to pre-pandemic levels (Bayeh et al. 2024).
There is evidence that the enthusiasm to abandon cash is not evenly distributed across the population, and may vary by income, age, and race. Studies conducted by Pew Research in 2018 and 2022 (Faverio 2022; Perrin 2018) reported that low-income households (those with household incomes of less than $30,000 per year) are more likely to use cash, compared to mid- and high-income households. Similarly, Bayeh et al. (2024) and Bayeh et al. (2025) reported that cash is most often used by people with a household income of less than $25,000. Older people (defined as 55 or older by the Federal Reserve, and 50 or older by Pew Research) are more likely to use cash. Also, Black and Hispanic consumers are more likely to use cash than White consumers (Faverio 2022). These relationships are somewhat driven by the 6% of the population that does not have a credit or debit card and therefore makes most of their payments (73%) in cash (Greene and Shy 2022). These cardless consumers are more likely to be younger (24-34 years old), have no college education, and be Black or Hispanic (Greene and Shy 2022).
If use of cash is indicative of preference to receive it, and therefore incentive preference, receptiveness to a cash incentive may be declining. In addition, those who do prefer a cash incentive will represent a specific subset of the population. Taken together, this will lead to different incentive preferences for different subpopulations.
Research Questions
To understand the public’s spending behaviors post-Covid, this analysis uses survey questions to capture people’s preferred payment methods when paying for common expenses and how often they carry and use cash. The analysis will identify attributes of those who most often carry and use cash. The specific research questions are as follows.
RQ1: How do people pay for different types of common expenses?
RQ2: Do people carry cash? Of those carrying cash, what are their characteristics?
RQ3: Are people using cash? Of those using cash, what are their characteristics?
Given the literature, credit and debit cards are expected to be the most popular forms of payment for common expenses (RQ1). Also, most people will carry cash but this will be more likely among older and low-income people (RQ2). Few people will use cash frequently, and those who do will be more likely to be low-income (RQ3).
Data
The data come from a web survey of Census Bureau Research Panel members. These 30,000 panel members were respondents to Phase 4.2 of the cross-sectional Census Household Pulse survey (U.S. Census Bureau 2024), administered from July to September 2024, who agreed to be contacted about future research opportunities. This convenience sample is used to host experiments and methodological investigations and is treated as a nonprobability sample. No official statistical products are produced from the Research Panel and the responses are not weighted.
The web survey was open from 3-15 December 2024 and available in English only. The survey asked about demographics, household composition, carrying and spending cash, preferences for incentive payment method, costs of utilities, eating school lunches, and income from property rental (in that order). It took approximately 15 minutes. No incentive was offered. Two reminders were sent, beyond the initial email invitation, resulting in approximately 10,000 responses and 500 bounce backs (assumed eligible), for an AAPOR RR2 of 33% (conditional on those who volunteered for the panel). There were about 9,200 cases still active in the survey for the questions in this analysis.
Survey Questions
Survey questions relevant to the analysis, in the order they were presented, are below.
The first three questions were randomized and used the same response options:
-
When eating out at a restaurant, how do you usually pay?
-
When buying a couple of inexpensive items at a convenience store or grocery store, how do you usually pay?
-
When buying a large amount of groceries, how do you usually pay?
Response options: Cash, Credit card, Debit card, Phone (e.g., Apple Pay, Google Wallet), Check, SNAP EBT card[1]
-
[If selected SNAP] How do you pay for food or other items when you do not use a SNAP EBT card?
Select all that apply: Cash, Credit card, Debit card, Phone (e.g., Apple Pay, Google Wallet), Check
-
How often do you have[2] cash?
Response options: Always, Most of the time, Sometimes, Rarely, Never
Question includes a checkbox for “I only have cash for emergencies” under the response options that can be selected in addition to a response.
-
How often do you use cash to pay for things?
Response options: Always, Most of the time, Sometimes, Rarely, Never
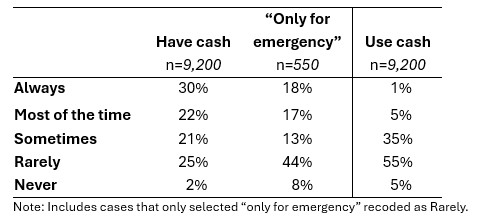
As noted, respondents were asked how often they have cash but could also designate they have cash “only for emergencies” in a checkbox. Among those who checked the box, “Rarely” had the highest frequency of the five categories. Therefore, the thirty people who checked this box but did not also select a Likert scale response were recoded as “Rarely” so that they were included in the analysis.
Methods
The results show the distribution of payment types for three common expenses (RQ1) and how often respondents have and use cash (RQ2 and RQ3). Logistic regressions predict having and using cash “Always” or “Most of the time”, controlling for the following demographic variables: age[3] (19-35, 36-54, 55-70, 71-96), education (less than a college degree; college degree; graduate degree), sex (indicator for male), race (White alone, Hispanic or Latino alone, Black or African American alone, other), household income[4] (less than $35,000, $35,000-$99,999, $100,000 or more), children under 18 years old in the household, currently working, and using a computer daily. Given the amount of missing data for household income, models were run with and without income.
All models were logistic regressions in the following form:
\[\ln\left( \frac{p_{i}}{1 - p_{i}} \right) = B_{0} + B_{1}x_{1i} + \ldots + B_{p}x_{pi}\]
where is the probability of carrying cash (RQ2) or using cash (RQ3). Independent variables are represented by
Results
RQ1: How do people pay for different types of common expenses?
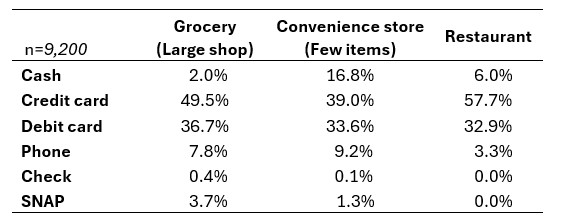
Respondents were asked how they typically pay for a large number of items at a grocery store, a few items at a convenience or grocery store, and the bill at a restaurant. Paying by phone, check, and SNAP were not common methods for these expenses. Cash was also not used often; the highest incidence of cash use was when purchasing a few items (17% of respondents). The most popular method for all three expenses was a credit card followed by a debit card (see Table 1). The hypothesis for RQ1 was supported.
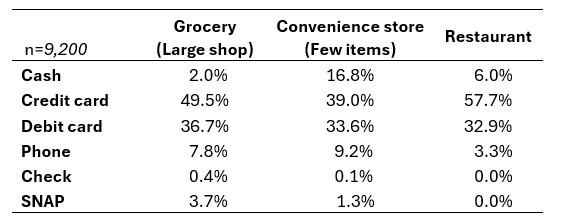
Those who chose SNAP for any of the three questions were asked to designate what payment method they use when not using SNAP. These 350 respondents could choose more than one response. A debit card was chosen most often (69%) but cash was also popular (39%)—this percentage is notably higher than for non-SNAP respondents. Credit cards were selected by 22% of SNAP users and phone and check were 6% and 1% respectively.
RQ2: Do people carry cash? Of those carrying cash, what are their characteristics?
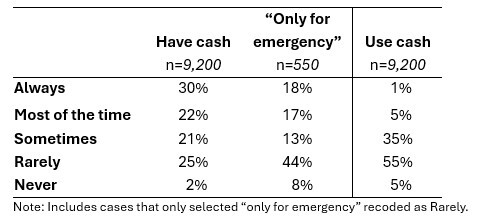
Table 2 shows a fairly even distribution of responses from Always to Rarely, indicating that just over half of people (52%) often carry cash (Always or Most of the time) and very few people (2%) Never have cash on hand. Even among those who checked the box that they only carry cash for emergencies, 35% reported often carrying cash.
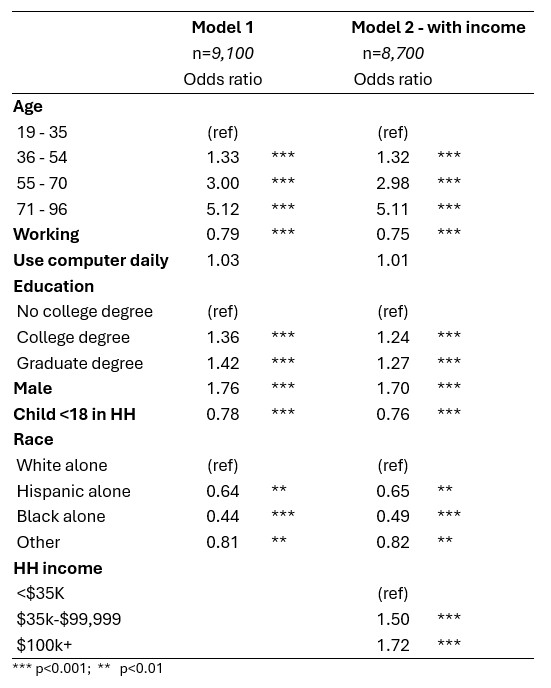
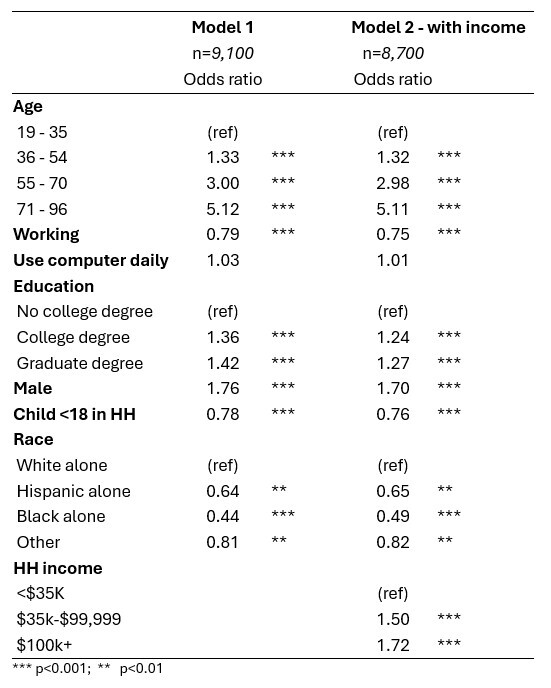
A logistic regression predicting having cash Always or Most of the time (see Table 3) finds that the older a person is (using broad categories), the more likely they are to carry cash. Males, people with more education, and people who are White (alone) are more likely than their counterparts to carry cash. Those less likely to carry cash are currently working and have children under eighteen years old in the household. When income is added to the model, there are only small changes to the odds ratios, and results indicate that those with higher household incomes are more likely to carry cash, contrary to the hypothesis.
RQ3: Are people using cash? Of those using cash, what are their characteristics?
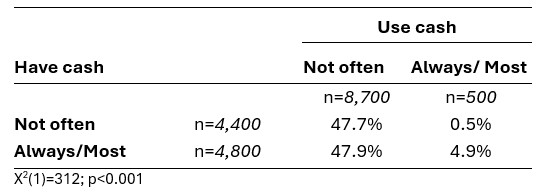
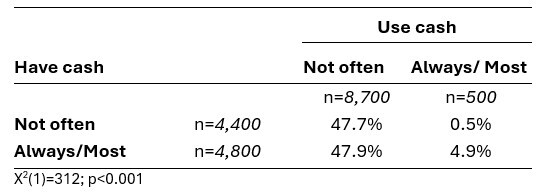
Respondents were asked how often they use cash, using the same Likert scale as for carrying cash. The responses are more skewed, with majority of people reporting that they Rarely (55%) or Sometimes (35%) use cash (see Table 2). Comparing those who carry cash to those who use cash, it is evident that people are carrying cash but not using it often, as hypothesized. Instead of high cash use among those who often carry cash, this incidence is only 5% (see Table 4). Most people who carry cash Always or Most of the time report using it Sometimes, Rarely, or Never (48%). It appears that people carry cash “just in case” they need it, rather than as a regular method of payment.
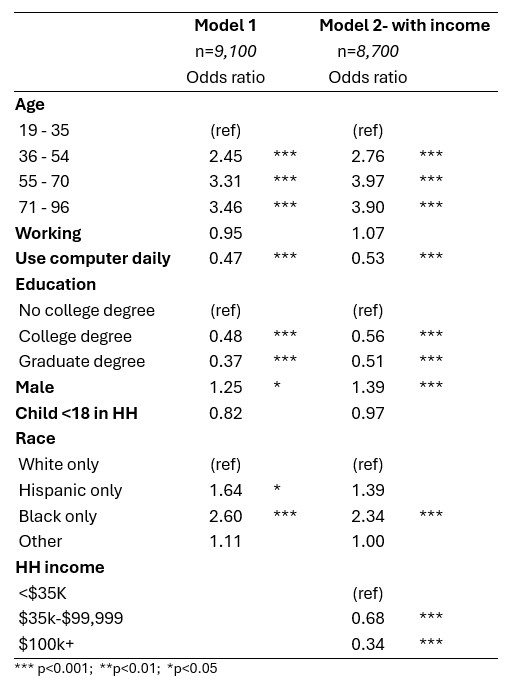
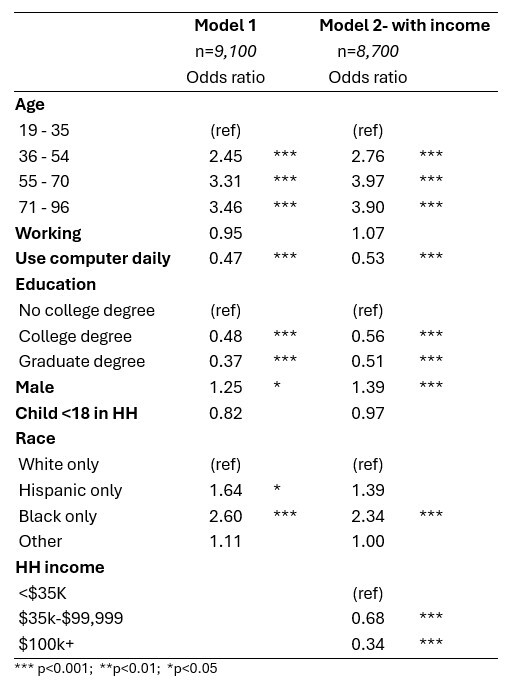
A logistic regression predicting use of cash (see Table 5) shows that, like carrying cash, older people are more likely to use cash, compared to younger people (19-35 years old). However, working and having children in the household are not significant correlates, as they were when predicting carrying cash. In addition, the relationship between cash use and education, race, and income is opposite of the relationship between carrying cash and these variables (i.e., White-only people, more educated people, and people with higher household incomes are less likely to use cash). In addition, men were more likely to use cash.
See Appendix A for a supplementary analysis of what expenses people pay for with cash, and the typical amounts of cash used.
Conclusion
The analysis found that although people carry cash, they are not using it often. Common expenses like groceries and eating out were mostly paid using electronic means, namely credit cards, followed by debit cards. People who generally have cash have different characteristics than those using it often, with relationships between carrying cash and education, race, and income being opposite of the relationship between those same demographics and cash use.
Across these findings, there is support for the hypothesis that cash is no longer king (of people’s wallets) for all subpopulations. In fact, it appears to be attractive to only a small subset of people, as noted above. But does this shift in payment behavior indicate a change in incentive preference?
The next phase of this research will analyze what types of monetary incentives respondents prefer, and if forms of payment for common expenses correlate with those incentive preferences. This correlation (or lack thereof) will be helpful to practitioners trying to decide what incentives are likely to be enticing to their sample.
Corresponding author contact information
Jennifer Sinibaldi
US Census Bureau
4600 Silver Hill Road
Washington, DC 20233
jennifer.sinibaldi@census.gov
Disclaimer
Any opinions and conclusions are those of the authors and not those of the U.S. Census Bureau. The paper has been reviewed for disclosure avoidance and approved under CBDRB-FY26-CBSM003-011. Sample sizes and counts in both the text and tables are rounded in accordance with Census Bureau reporting requirements. These rounded values are italicized.