Introduction
Research has shown that cash incentives are more effective at gaining response than alternative monetary incentives (e.g., gift cards) and non-monetary incentives (e.g., Abdelazeem et al. 2023; Birnholtz et al. 2004; Gajic et al. 2012; Singer and Ye 2013), leading to the mantra that “cash is king”. However, post-Covid, consumers’ relationship with cash has changed (Bayeh et al. 2024; 2025; Dickler 2021; Sinibaldi 2026) prompting questions about whether this incentive preference has shifted too. Among the various monetary incentives, is cash still king across all subpopulations?
Research comparing the effectiveness of different forms of monetary incentives primarily focuses on prepaid incentives[1]. A study of physicians found that a $50 prepaid incentive in the form of a check was associated with a higher response rate than a $50 prepaid reloadable debit card requiring activation[2] (Pace et al. 2020). Birnholtz et al. (2004) found that among a select group of researchers, a $5 prepaid cash incentive improved the response rate over a $5 digital gift certificate. A survey of over 4,000 people residing near the Atlanta airport showed that a $2 prepaid cash incentive was more effective than a $2, $5, or $10 postpaid Amazon gift card (Smith et al. 2019). These latter two papers support the wisdom that cash is king for (prepaid) incentives, and all three indicate that digital payments were less appealing.
These studies were conducted pre-Covid though. Only one study could be found that compared monetary incentives conducted post-pandemic. A small study of employees reported that an electronically delivered promised cash incentive of $5, particularly Venmo, was preferred to $5 through direct mail (Neman et al. 2022). This study is most aligned with the research presented below because it concerns stated incentive preference, rather than the effect on response rate, and asks about a promised, rather than prepaid, incentive.
Sinibaldi (2026) found that a small subset of the population uses cash regularly (older, male, non-White, no college degree, low-income). This analysis builds on those findings by exploring incentive preference among those same respondents, using vignette questions about how they would like to receive $5 and $40 promised incentives for completing a web survey. The results will indicate if cash remains the preferred monetary incentive for all subgroups and, if not, which types of monetary incentives different segments of the population favor. Furthermore, the analysis will explore the relationship between people’s everyday payment behaviors (as documented in Sinibaldi 2026) and their stated incentive preferences.
Research Questions
The specific research questions and hypotheses are as follows. Since these data come from hypothetical vignettes about promised payments, the results are relevant to promised, rather than pre-paid, incentive preferences and not intended to predict true response behavior.
RQ1: What type of incentive payment is preferred for $5 and $40?
Hypothesis: Cash will not be a popular choice for either amount, with most respondents favoring digital delivery (electronic bank transfer or digital gift card) for both amounts.
RQ2: What are the characteristics of those who prefer cash incentives?
Hypothesis: Those who prefer cash incentives will have similar characteristics as those who use cash often (e.g., low-income).
RQ3: Do payment behavior and incentive preference correlate?
Hypothesis: Payment behavior and incentive preference will have a positive correlation –i.e., those who spend cash will prefer cash incentives, those who use credit and debit cards will prefer physical gift cards, and those who use their phone to pay will prefer bank transfers[3].
If the hypotheses are correct, promised cash incentives should be enticing to a small subset of the population, namely low-income people.
Data
The data come from a web survey of Census Bureau Research Panel members. These 30,000 panel members were respondents to Phase 4.2 of the cross-sectional Census Household Pulse survey (U.S. Census Bureau 2024), administered from July to September 2024, who agreed to be contacted about future research opportunities. This convenience sample is used to host experiments and methodological investigations and is treated as a nonprobability sample. No official statistical products are produced from the Research Panel and the responses are not weighted.
The web survey was open from 3-15 December 2024 and available in English only. The survey asked about demographics, household composition, carrying and spending cash, incentive preference, costs of utilities, school lunches, and rental income (in that order). It took approximately 15 minutes. No incentive was offered. Two reminders were sent, beyond the initial email invitation, resulting in approximately 10,000 responses and 500 bounce backs (assumed eligible), for an AAPOR RR2 of 33% (conditional on those who volunteered for the panel). There were about 9,200 cases still active in the survey for the questions in this analysis.
Survey Questions
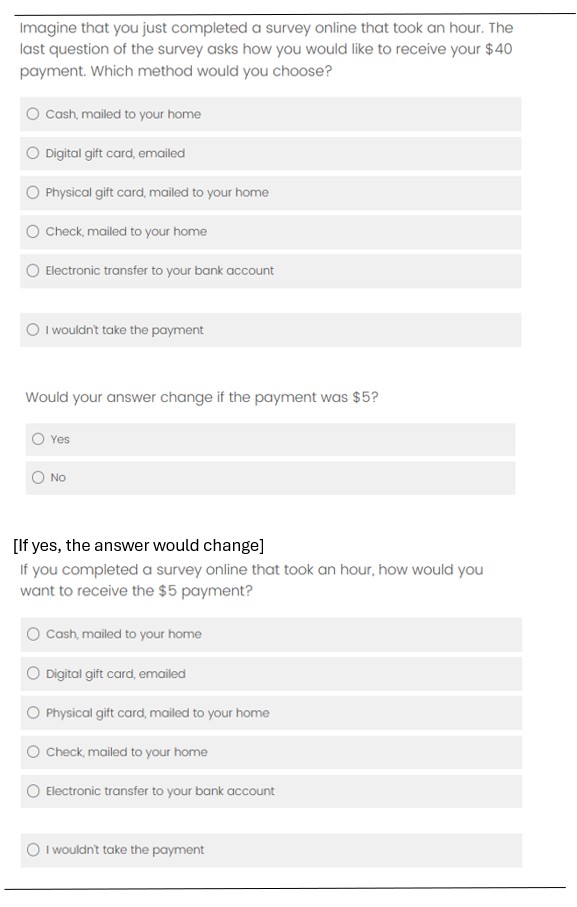
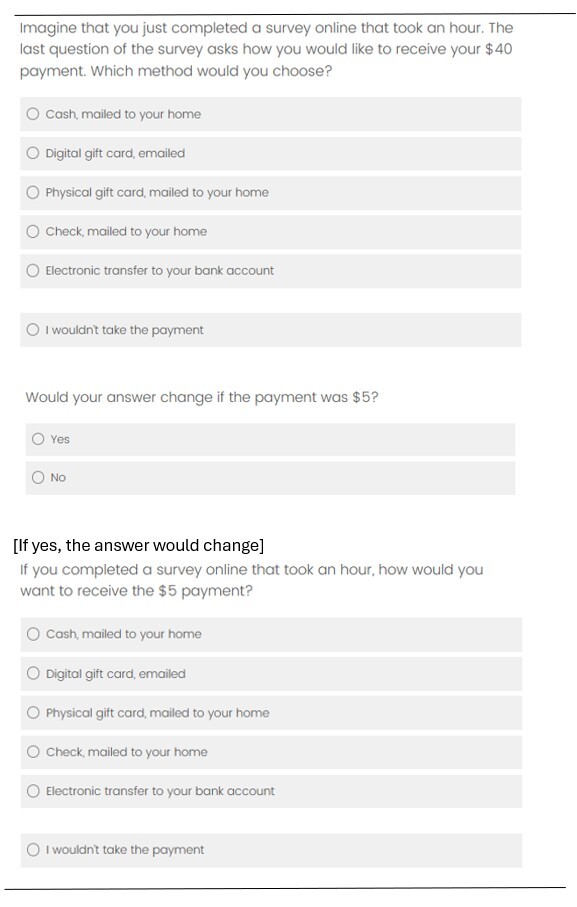
Respondents were randomized into two groups to determine which incentive vignette was shown first. The randomization was intended to balance any potential confirmation bias resulting from asking the smaller or larger amount first. A screenshot of the $40 incentive vignette question is shown in Figure 1 (the other group saw the same question but with “$5” instead). The respondent could choose: cash, digital gift card, physical gift card, check, or electronic bank transfer, or decline payment. Note that incentive options included the delivery method, in case that factored into the respondent’s decision. An hour-long survey is referenced in the vignette to encourage respondents to take payment for their time (and avoid confusion about receiving an incentive for the shorter survey they were currently answering). After answering about either $40 or $5, they were asked if their answer would change for the other incentive amount. If yes, they were asked their preference for that amount.
Appendix A presents additional survey questions relevant to the analysis. These items examine respondents’ reasons for selecting a particular incentive, their preferred method of reimbursement from a friend, and their use of payment apps. Questions pertaining to how people pay for common expenses, analyzed in Sinibaldi (2026), are also included in the analysis.
Methods
The results show the distribution of incentive preferences for $5 and $40 (RQ1) and a crosstab highlights differences in preferred incentive by amount. The distribution of reasons for choosing a particular incentive are presented by amount. In the multivariate analyses, logistic regression models predict the preferred incentive (cash for RQ2 and each incentive as a separate model for RQ3). The dependent variables for these models combine both the $5 and $40 preferences into one variable – i.e., a respondent could have chosen the incentive type for one or both amounts. The model predicting cash incentive preference (RQ2) is used to generate propensity scores to identify demographic subgroups who prefer a cash incentive. When predicting incentive preference by payment behavior (RQ3), if a variable is significant for any of the models, it is retained for all models for consistency.
The variables indicating payment behavior that were used to predict incentive preference (RQ3) are the types of payment respondents reported using for common expenses (as described in Sinibaldi 2026). These were recoded into four, not-mutually-exclusive, variables indicating that cash, credit card, debit card, or phone payments were reported for any of the three common expenses (groceries, dining out, or small convenience store items). The very small number of low-income participants who reported SNAP[4] for all three expenses were recoded into a different payment type using a follow-up survey question asking about non-SNAP payments. Few people chose payment by check and no one chose checks for all three expenses. Therefore, there is no indicator for payment by check.
As explained in Sinibaldi 2026, the analyses controlled for the following demographic variables: age, education, sex, race, household income, children under 18 years old in the household, currently working, and using a computer daily.
All models are logistic regressions in the following form:
\[\ln\left( \frac{p_{i}}{1 - p_{i}} \right) = B_{0} + B_{1}x_{1i} + \ldots + B_{p}x_{pi}\]
where is the probability of choosing a cash incentive (RQ2) or choosing a particular incentive type (RQ3). Independent variables are represented by
Results
RQ1: What type of incentive payment is preferred for $5 vs. $40?
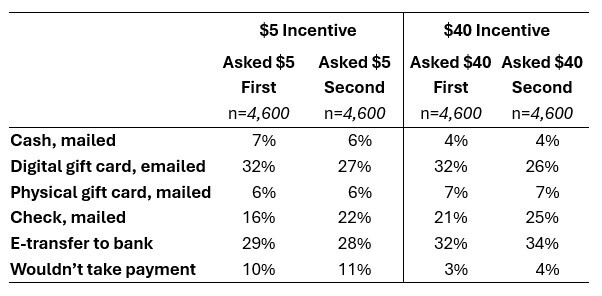
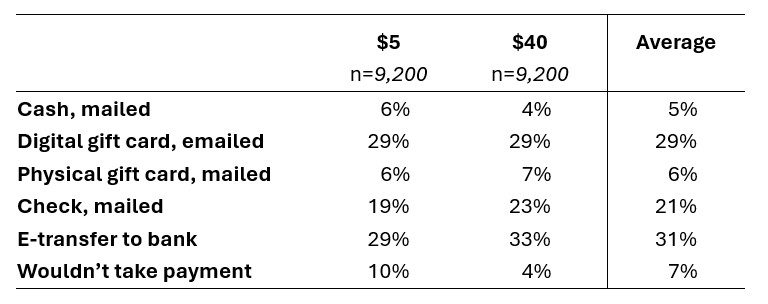
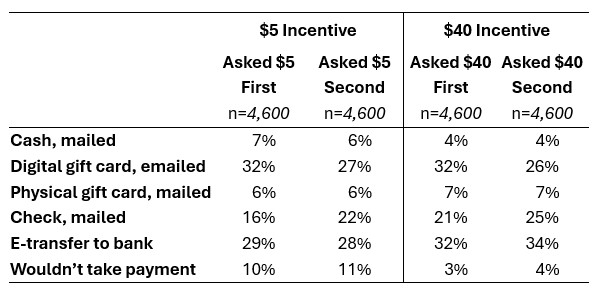
Digital gift cards and electronic bank transfers are most preferred (as hypothesized), regardless of incentive amount (see Table 1). Digital gift cards were preferred by 29% of respondents for both amounts, and bank transfers were preferred by 29% ($5) or 33% ($40) of respondents.
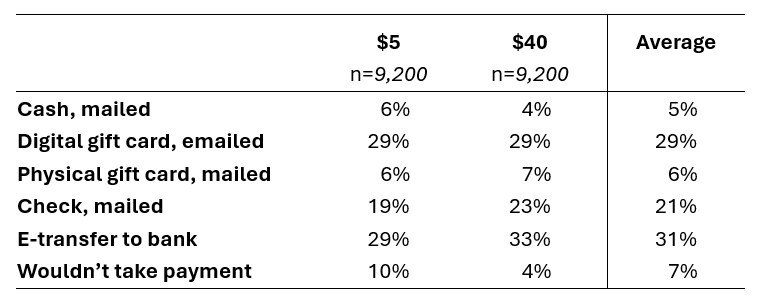
As hypothesized, cash is the least popular incentive with 6% ($5) and 4% ($40) of cases preferring this. Physical gift cards are also not very popular (6% or 7% of cases). Both were designated in the vignette as delivered in the mail, which might appear to drive preference. However, 19% ($5) and 23% ($40) of respondents preferred a (mailed) check, which approaches the popularity of the digital gift cards.
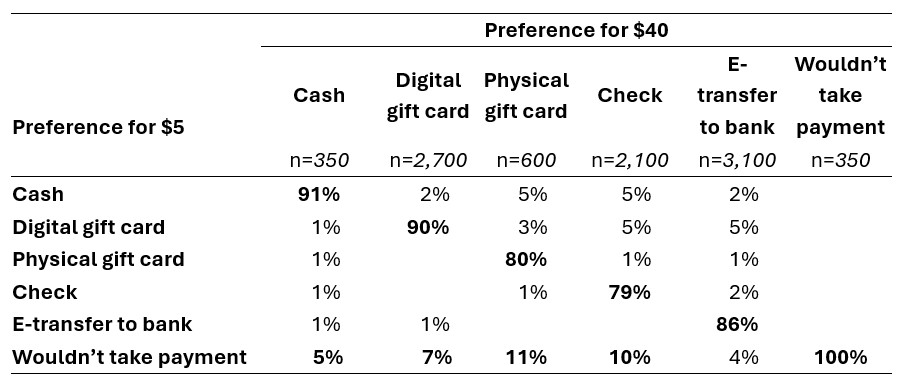
Of those randomly asked about $40 first, 17% changed their answer for $5. Similarly, 14% of people asked about $5 first changed their answer for $40. Most of the fluctuation, for both groups, is among those preferring digital gift cards or a check for only one of the amounts. See Appendix B for detailed results.
It is notable that, on average, 7% of respondents said they would not take an incentive, with more people providing this response for the $5 incentive. Table 2 shows that among the people who chose different responses for the two incentive amounts, they most often reported that they would not take a payment for the $5 incentive rather than choosing a different incentive type for the smaller payment[5].
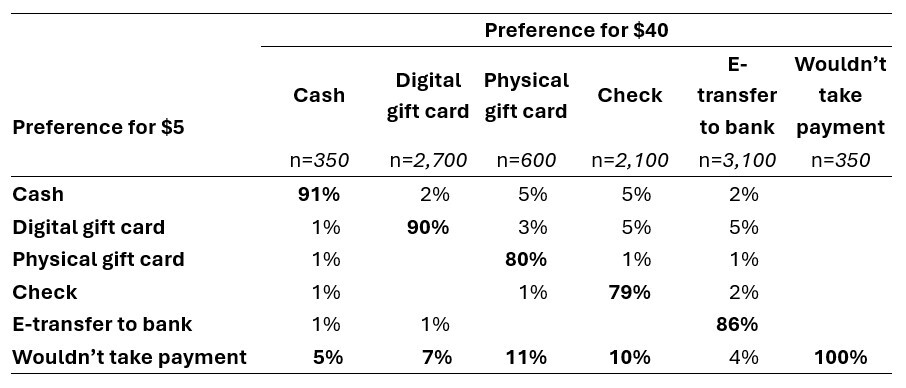
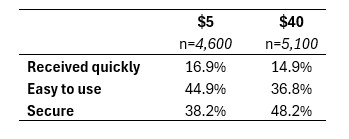
Table 3 shows the distribution of reasons from the closed-ended question asking why they chose the incentive they did. Receiving the payment quickly was least important for both amounts. However, choosing a secure payment was most important for the higher incentive amount, while being able to easily use the incentive was most important for $5[6].
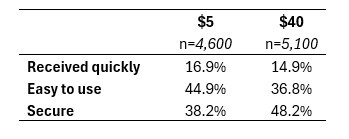
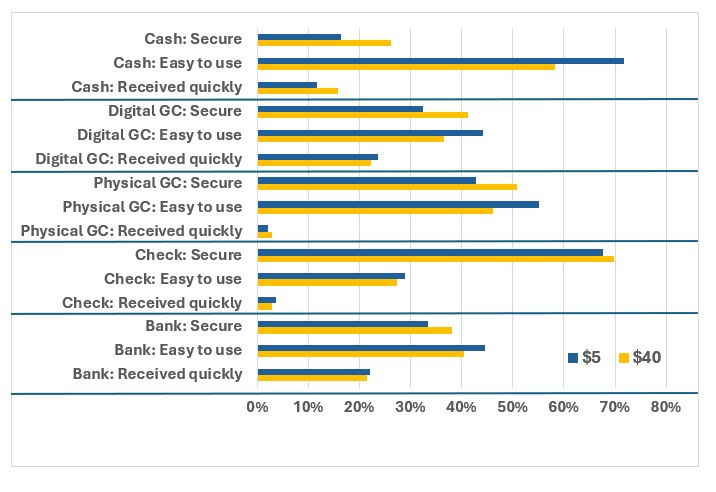
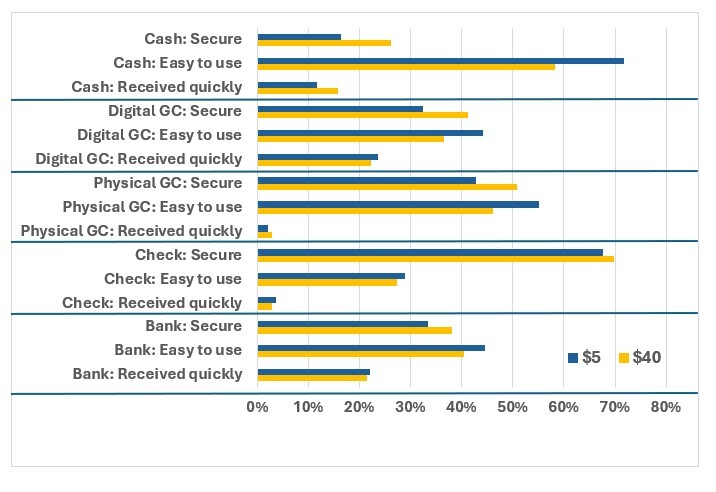
Figure 2 charts these three reasons by incentive amount and type of incentive. Most reasons were chosen by fewer than 50% of respondents within each incentive preference category but two have noticeably high percentages. The majority of respondents who chose cash for $5 or $40 did so because it is easy to use, while majority of those who preferred a check cited security. Physical gift cards were chosen both because they are secure (higher for the $40 incentive) and easy to use (higher for the $5 incentive). Receiving the payment quickly was consistently the least popular of the three reasons for all incentive types, reinforcing the overall frequency shown in Table 3.
RQ2: What are the characteristics of those who prefer cash incentives?
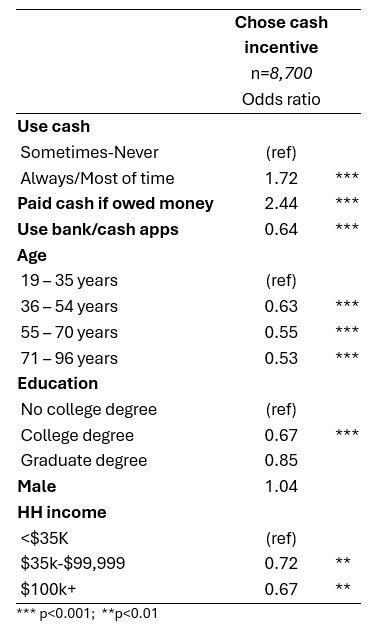
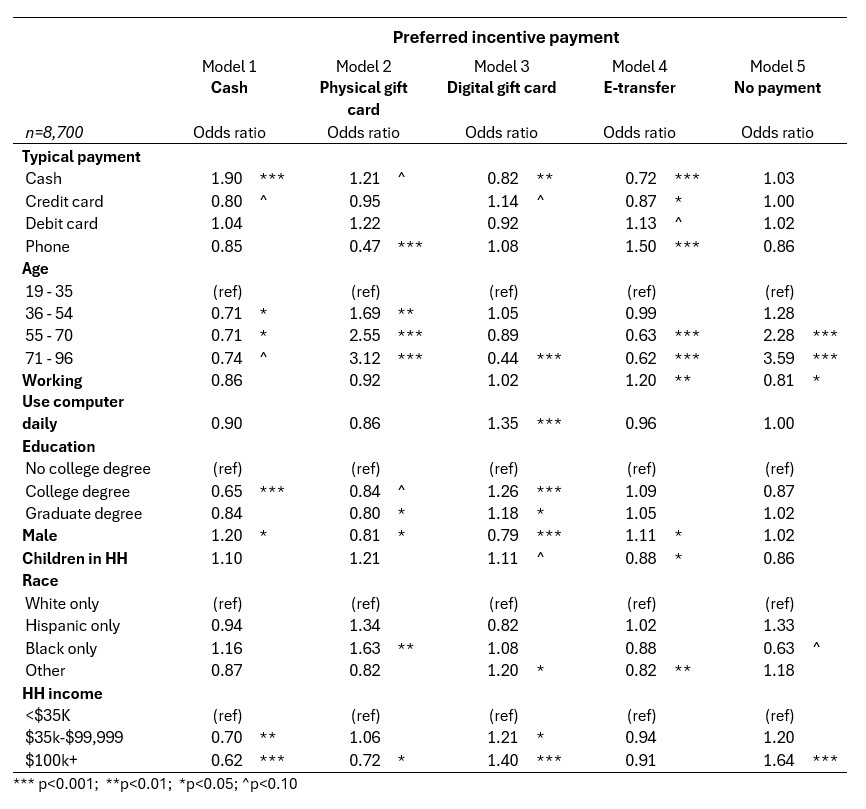
The logistic regression in Table 4 describes the small percentage of cases who preferred cash, for either incentive amount. Although both carrying and using cash were included in the model (see Sinibaldi 2026 for discussion), only using cash is a significant predictor. Another indicator of cash use, being paid money owed in cash, is also significant. Use of apps for payment or banking is a significant, but negative, correlate of choosing a cash incentive.
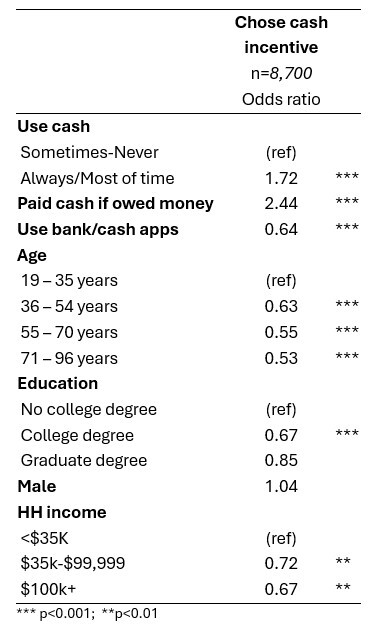
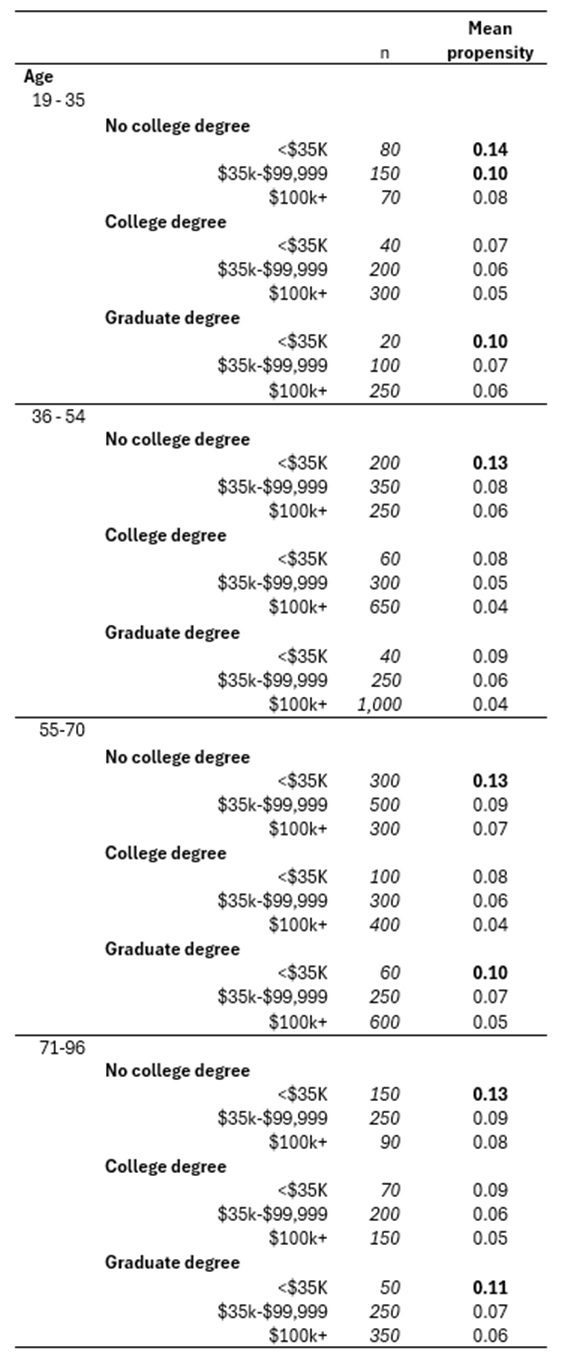
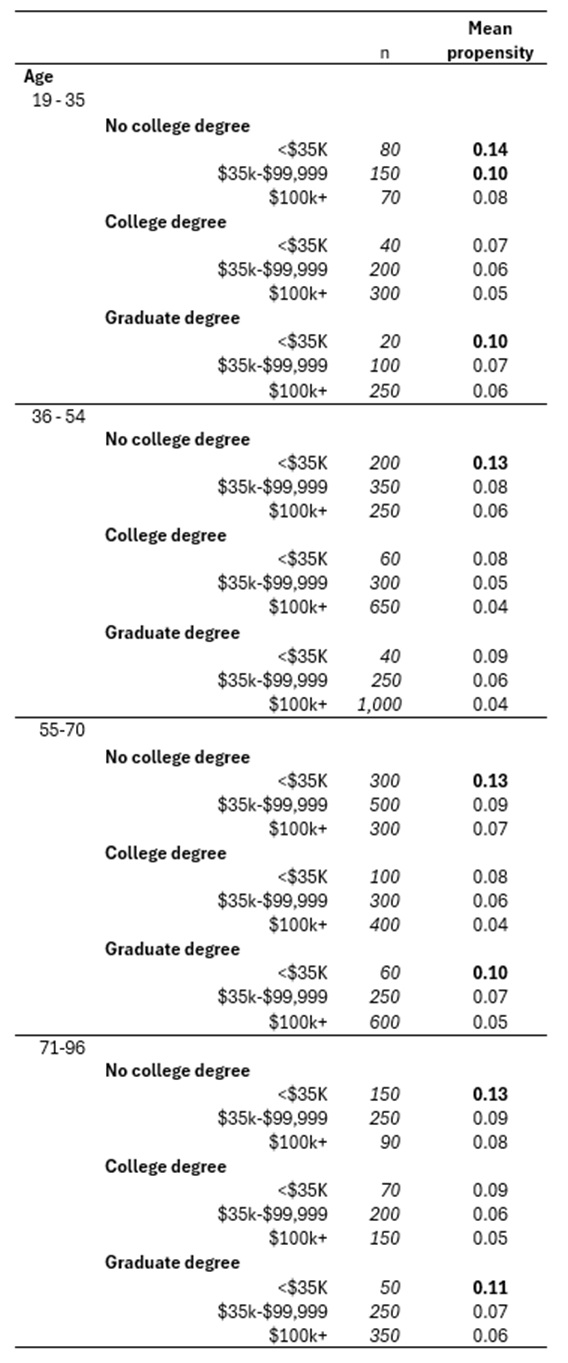
While older respondents were more likely to carry or use cash (Sinibaldi 2026), it is the youngest age group who is most likely to choose a cash incentive. People without a college degree are significantly more likely to choose cash than those with a degree. Those with the lowest household income (less than $35,000) are more likely to choose cash than people with higher incomes, as hypothesized. See Appendix C for propensity scores that characterize age, education, and income subgroups to more clearly identify (low) income as the consistent driver of this preference.
RQ3: Do payment behavior and incentive preference correlate?
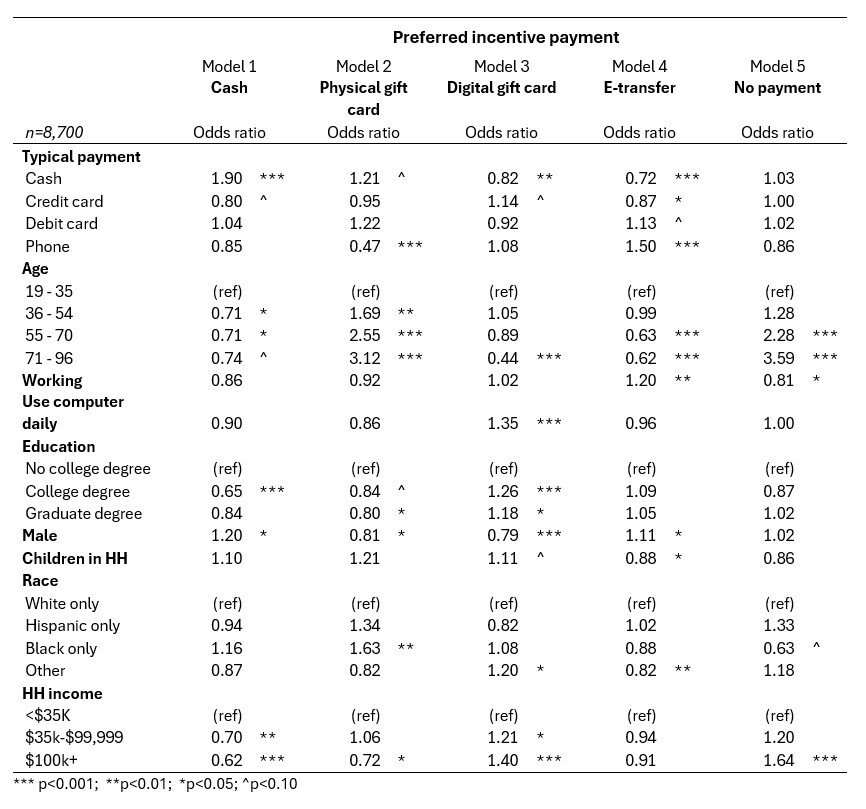
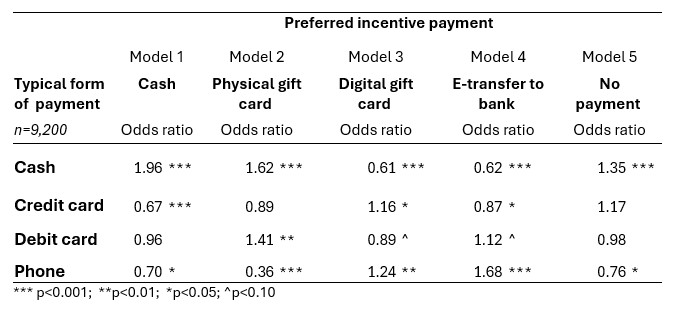
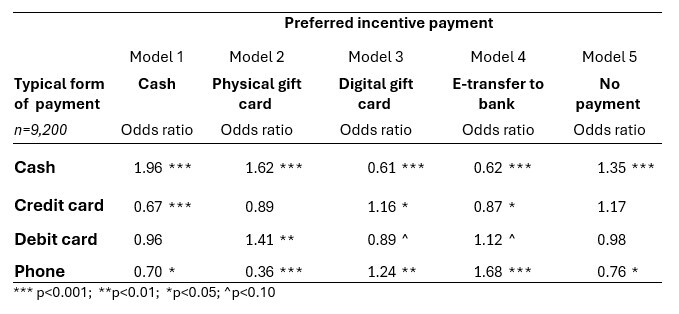
Adding to the findings that those who use cash most often are more likely to prefer a cash incentive, the analysis below incorporates other typical forms of payment besides cash. Forms of payment are used to predict both a cash incentive preference and the other incentive preferences. Simplified models using only the forms of payment to predict each incentive show some expected and unexpected relationships (see Table 5). Those who pay for common expenses with cash preferred not only the cash incentive but also a physical gift card. Conversely, they were significantly less likely to prefer digital incentives (bank transfer and gift card). Contrary to the hypothesis, credit card users were more likely to prefer digital gift cards and had no statistically significant preference for physical gift cards. Debit card users, however, did prefer physical gift cards, as hypothesized. Finally, people who use their phones to pay for common expenses were more likely to prefer the digital incentive types and less likely to prefer the physical incentives.
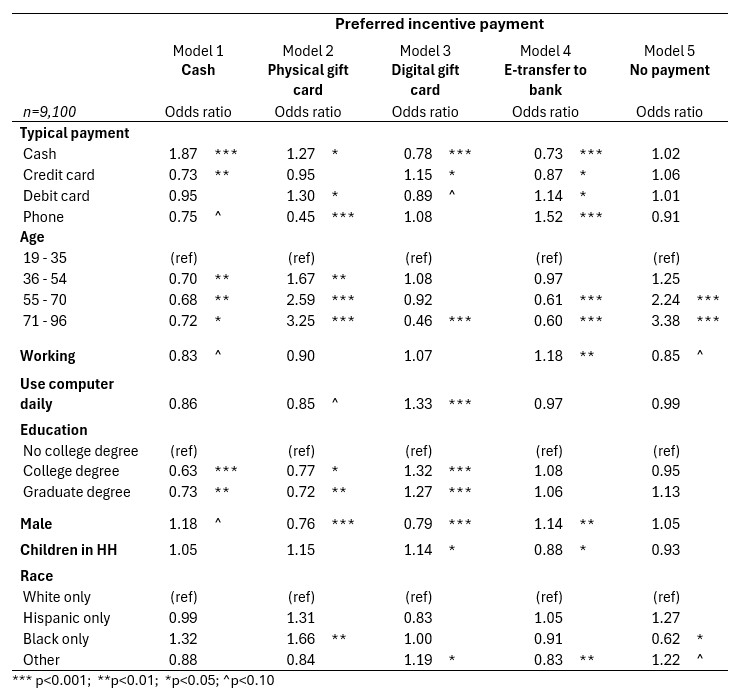
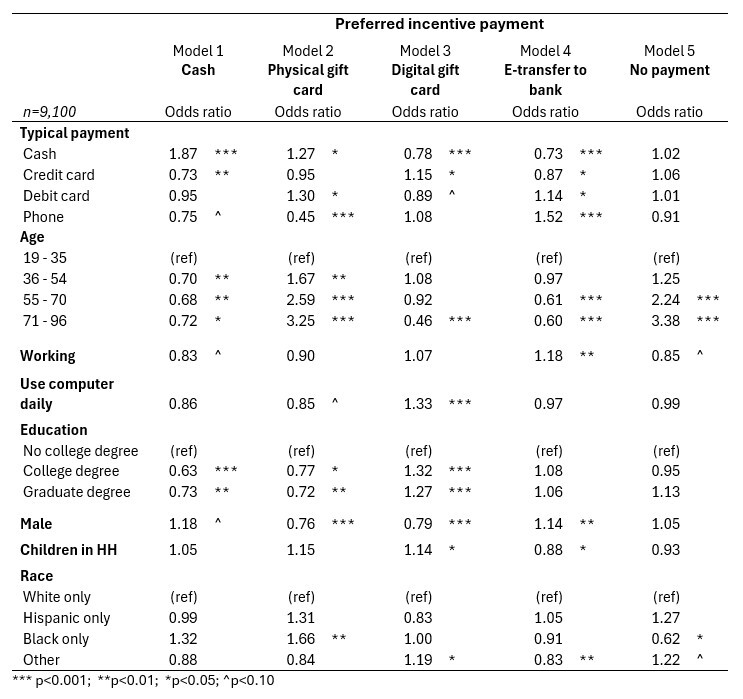
When demographics are added to the prediction models (see Table 6), all of these correlations remain significant except for the relationship between paying by phone and preferring a digital gift card. Looking at the significant demographic characteristics, one interesting pattern that may help survey practitioners is men’s aversion to gift cards (physical or digital). Instead, men slightly preferred bank transfers and cash (marginally significant) and these relationships were not explained by the addition of income in the model (see Appendix D). Older respondents were more likely to prefer a physical gift card — a relationship that grows stronger with each increasing age category. Respondents 55 and older were less likely to prefer bank transfers and more likely to not take payment for at least one of the incentive amounts.
Conclusion
As expected, receptiveness to a promised cash incentive was limited to a small number of people: 6% for $5 and 4% for $40. Instead, electronic bank transfers and digital gift cards were the most preferred, revealing the popularity of digital payments post-Covid. When respondents chose different incentive types for each amount, most often it was to refuse the $5 incentive. Payments that were secure or easy to use were the most important reasons why people chose a particular incentive type. Of those who preferred a cash incentive, they were more likely to be young, low-income, not have a college degree, and use cash often. Analysis of the propensity scores for different demographic groups revealed that being low-income was driving this preference.
People’s forms of payment for common expenses correlated with incentive preference. Those who pay for common expenses with cash preferred not only the cash incentive but also a physical gift card. They were not receptive to digital incentives. People who paid with credit cards, debit cards, or by phone were less likely to prefer cash incentives (although the relationship is not significant for debit card users) and all were significantly more likely to prefer at least one of the digital incentives (bank transfer or digital gift card), if not both.
This study provides clarification as to respondents’ preferences for receiving monetary incentives, post-Covid. Across these findings, there is repeated support for the hypothesis that cash is no longer king for all subpopulations. In fact, it appears to be attractive to only a small subset of people, as noted above. Digital money, however, is appealing (i.e., digital gift cards and bank transfers), fueling an update to the mantra that “Digital cash is king”, at least for promised incentives.
This study was conducted using vignettes on a convenience sample, warranting caution when generalizing the findings to the general population. Also, research has shown that results from hypothetical questions may not be the same as the responses of those who experience the treatment (Kaderabek and Sinibaldi 2022). A stronger design would capture true behavior by offering respondents their choice of incentive type as payment for their participation in a survey. Most survey houses cannot offer such a wide variety of incentive options though, and the researcher may also have to forego the contrast of $5 and $40.
Although this study was prompted by changes in payment behavior due to the Covid-19 pandemic, technology and the security of that technology are constantly evolving. Even without a shock like the pandemic, respondent preferences will likely continue to evolve. Also, this study may not have covered all forms of attractive monetary incentives (e.g., cryptocurrency was not an option). So, further work can be done to refine these findings. But for now, cash appears to be dethroned.
Corresponding author contact information
Jennifer Sinibaldi
US Census Bureau
4600 Silver Hill Road
Washington, DC 20233
jennifer.sinibaldi@census.gov
Disclaimer
Any opinions and conclusions are those of the authors and not those of the U.S. Census Bureau. The paper has been reviewed for disclosure avoidance and approved under CBDRB-FY26-CBSM003-011. Sample sizes and counts in both the text and tables are rounded in accordance with Census Bureau reporting requirements. These rounded values are italicized.