Introduction
Survey research has evolved dramatically over the past few decades with the onset of the Internet age. Technological advancements (e.g., the Internet) have made large populations easily accessible through a variety of means. However, perhaps as a consequence, response rates have plummeted, which has mandated increased scrutiny as to methods that may be employed to improve responsiveness among those surveyed since low response rates may jeopardize the generalizability of survey findings (Edwards et al. 2002; Singer 2002; Singer and Ye 2013). Nonetheless, high rates of nonresponse by no means guarantee substantial nonresponse bias, and low rates of nonresponse do not imply a lack of bias (R. M. Groves and Peytcheva 2008; Hedlin 2020; Leslie 1972).
All facets of the survey approach may affect response rates. Particular focus within the current literature is given to incentives (e.g., honoraria), which may be noncontingent (i.e., a preincentive) or contingent upon participation in the survey (i.e., a promised incentive). Research has conclusively shown that the use of incentives systematically yields higher rates of participation than the absence of incentives; however, most studies show only a marginal effect of the amount of the incentive (DeCamp and Manierre 2016; Godwin 1979; Hsu et al. 2017; James and Bolstein 1992; Jobber, Saunders, and Mitchell 2004). Furthermore, most researchers observe that noncontingent incentives yield higher response rates than contingent incentives (Church 1993; Edwards et al. 2002; Göritz 2006; Hsu et al. 2017; Martin, Abreu, and Winters 2001; Robbins et al. 2018); however, it is often assumed that noncontingent strategies will be less cost-effective since the incentive is sent to a multitude of nonrespondents. Studies have exhaustively searched for an optimal amount of preincentive (James and Bolstein 1990; Mizes, Fleece, and Roos 1984; Trussell and Lavrakas 2004), although findings can vary markedly across settings. Furthermore, researchers have struggled to illustrate circumstances where preincentives are more cost-effective (Cosgrove 2018; Dykema et al. 2015; Newby, Watson, and Woodliff 2003). Mercer et al. (2015) use regression modeling within a meta-analysis to claim that preincentives have the largest per-dollar impact on responsiveness among a variety of facets (including the use of promised incentives).
In addition, Singer and Ye (2013) outline several studies that failed to show that incentives affect data quality. Much research has shown that the use of preincentives will, if anything, reduce bias from nonresponse (Adua and Sharp 2010; Felderer et al. 2018; Robert M. Groves et al. 2006; Petrolia and Bhattacharjee 2009); however, Parsons and Manierre (2014) note a circumstance where preincentives exacerbate nonresponse bias among a random sample of college students.
Few studies compared small preincentives to larger promised incentives to see whether or not an optimal cost-effective strategy can be obtained by increasing the amount of the promised incentive. Researchers have considered combining small preincentives with larger promised incentives, but the findings are mixed (Dykema et al. 2011). Furthermore, the type of incentive (e.g., cash, personal check, gift card, lottery prize) may have a marked effect on response rates. Studies have shown that cash outperforms gift cards (Birnholtz et al. 2004; Brown et al. 2016), whereas lotteries are shown to perform relatively poorly (Warriner et al. 1996).
A wealth of literature has studied the effect of modes including in-person contact, phone contact, postal mailing, and emailing on response rates (Biemer et al. 2017; Dillman et al. 2009; Kaplowitz, Hadlock, and Levine 2004; Porter and Whitcomb 2003; Schaefer and Dillman 1998)—it is typically shown that in-person and phone contact perform superiorly. However, more nuanced characteristics, such as the delivery service, may have a pronounced effect on responsiveness as well. For example, Kasprzyk et al. (2001), in the context of a survey of physicians, show that sending the survey via FedEx yields higher response rates than the US Postal Service (USPS). However, this finding was contradicted by Doody et al. (2003), who failed to find an improvement from the use of FedEx over USPS in a survey of radiologic technologists. In addition, attention has been given to the manner in which letters are addressed, primarily relating to the degree of personalization (Dykema et al. 2019). Other factors considered within extant literature include questionnaire design (Dillman, Sinclair, and Clark 1993), confidentiality statements (Dillman et al. 1996), advance letters (Mann 2005), number and type of nonresponse follow-up contacts (James and Bolstein 1990; Rada 2005) and completion deadline (Roberts, McCrory, and Forthofer 1978).
Survey panels, wherein a sample from a population is recruited for participation so that they may be administered surveys at intermittent times, are becoming an increasingly popular manner of assessing public opinion (Bethlehem and Biffignandi 2011; Blom, Gathmann, and Krieger 2015; Callegaro et al. 2014; Cornesse et al. 2020; Stanley et al. 2020; Toepoel 2017; Yan, Kalla, and Broockman 2018). Although research regarding optimal methods for recruitment of individuals into survey panels is more sparse than analogous work for cross-sectional surveys, in general most of the previous findings appear to transfer to panels (e.g., Gritz 2004; Jäckle and Lynn 2008; Scherpenzeel and Toepoel 2012; Yu et al. 2017).
Assessing the opinion of educators in particular is of great interest to researchers and policymakers. Studies that evaluate the responsiveness of educators to surveys are comparatively rare (examples include Dykema et al. 2013; Coopersmith et al. 2016; Fraze et al. 2003; Jacob and Jacob 2012; Mertler 2002; Fraze et al. 2003; Robbins et al. 2018); however, indications are that educators (principals, in particular) are less responsive than the general public. Therefore, extra care should be afforded to the task of improving response rates among surveys of educators who are busy and therefore challenging-to-recruit via schools.
RAND Corporation’s American Teacher Panel (ATP) was established for the purpose of allowing researchers and policymakers an efficient tool by which the opinions and perspectives of teachers could be assessed in a robust and efficient manner. Here, we compare the efficacy of ten different recruitment strategies via an experiment that was performed in advance of a massive effort to expand the teacher panel during the 2016–2017 school year.
The recruitment experiment was designed to address the following four research questions:
(1) Are modest preincentives more effective than substantially larger promised incentives when recruiting teachers into survey panels?
(2) What mode of mailing (e.g., FedEx, USPS) is most effective for recruiting teachers into survey panels?
(3) What format of incentive (e.g., cash, check, electronic) is most effective for both pre- and promised incentives when recruiting teachers into survey panels?
(4) Can pre- and promised incentives be effectively used in tandem when recruiting teachers into survey panels?
The most effective strategy for recruitment is considered optimal with respect (1) response rates (i.e., what portion of contacted teachers enroll in the panel); (2) cost effectiveness (i.e., amount spent on recruitment activities per enrolled teacher); and (3) nonresponse bias (i.e., are there quantifiable differences between those who enroll vs. those who do not?).
Methods
The RAND American Teacher Panel is a standing survey panel of U.S. public school teachers. It is advertised as a “unique resource for obtaining [accurate responses on key issues from teachers] and measuring the evolving knowledge, attitudes, practices, and work conditions of educators nationwide.”[1] To facilitate administration of the Measure to Learn and Improve (MLI) surveys, the panel was marked to undergo a substantial expansion effort.[2]
Earlier recruitment efforts for the ATP involved scientific comparison of a limited number of strategies for recruitment via experimentation; these are outlined in Robbins et al. (2018).[3]
Despite the findings of Robbins et al. (2018), it was prudent to conduct an experiment to compare additional strategies given the size of the 2016–2017 recruitment effort and the desire to maximize response rates. Due to practical constraints, the experiment was administered within the first wave released on October 20, 2016. Ten separate strategies were considered within this experiment; these strategies were designed to address the research questions listed previously. Certain aspects did overlap in the strategies.[4]
The ten strategies, along with their scientific rationale for inclusion, are described below. Table 1 outlines the strategies (listing the types of incentives included and listing whether or not the recruitment package was sent via FedEx Next Day Delivery or USPS with a regular first class envelope). The first strategy (the “standard” strategy) represents the recruitment strategy that had proven to be optimal on the basis of the findings from Robbins et al. (2018). Preincentives were included in the recruitment package; promised incentives were sent upon enrollment in the panel.[5] All gift cards were pre-paid. Note that cash cannot be sent via FedEx; therefore, all strategies involving FedEx used USPS as the mode of contact. Strategies 2–10 had not yet been tested with teachers; these were each administered to a group of 250 randomly selected teachers. Since the standard strategy was known to perform acceptably, it was administered to the remaining teachers within the first wave of recruitment (n = 1,463).[6]
Relative Cost
We also wished to perform a cost-benefit analysis that would compare the cost per recruited teacher under each recruitment strategy used. Table 2 gives a categorical breakdown of the differential sources of cost for each category.[7] All costs (with the exception of costs related to promised incentives) are listed as dollar amounts incurred for each teacher contacted; for promised incentives, costs are incurred on the basis of each teacher who agrees to participate in the panels (i.e., per recruit). Our analyses excluded some other costs.[8]
Finally, we note that although the present study focuses on panel enrollment, similar analyses that involve participation in surveys administered to the panel yield analogous findings—these are omitted here for brevity given the breadth of surveys that have been administered.
Results
The strategies considered, along with the results of the experiment in terms of estimated response rates and costs per recruited panelist,[9] are illustrated in Table 3. The experimental strategies differ from the standard strategy only in ways described in the table and footnotes. Our results yield a wide variety of takeaways that will prove informative to survey methodologists across a variety of fields. Our key finding is that no strategy outperformed the standard strategy. Comparisons of the remaining strategies among one other potentially yield compelling results; however, these are often not statistically significant, perhaps due to the comparisons being underpowered. These takeaways indicate potential (untested) strategies that may outperform our preferred one. We discuss the results in detail with respect to each of our four primary research questions. Table 3 gives p-values for comparisons of the standard strategy (Strategy 1) to each of the other strategies; p-values for other comparisons are provided in the discussion below.
Are preincentives more effective than substantially larger promised incentives when recruiting teachers into survey panels?
By comparing recruitment Strategy 1 ($10 Target gift card as preincentive) to Strategies 4 ($40 Target promised) and 5 ($60 Target promised), we see that preincentives clearly outperform promised incentives of significantly larger amounts in terms of both response rates and cost effectiveness. Specifically, Strategy 1 had a 27.5% response rate, whereas strategies 4 and 5 had 16.0% and 19.6% response rates (p-values for tests of comparison: 0.000 and 0.007), respectively. Likewise, Strategy 1 is noticeably more cost effective than Strategies 4 and 5 (despite the first strategy involving “wasting” of gift cards that are sent to those who did not enroll): Strategy 1 costs $66.95 per enrollee, whereas strategies 4 and 5 cost $94.47 and $105.74 (with p-values of 0.001 and 0.000), respectively, per enrollee.
What mode of mailing (e.g., FedEx, USPS) is most effective for recruiting teachers into survey panels?
A comparison of Strategy 1 (FedEx) to Strategy 2 (USPS) indicates that using FedEx as a mode of contact outperforms USPS. That is, the FedEx strategy yields a notably higher response rate (27.5% vs. 18.0%; p-value = 0.002) and is estimated as being more cost effective, although the difference is not statistically significant ($66.95 vs. $84.44 per enrollee; p-value = 0.14), despite incurring a higher cost per contacted teacher.
What format of incentive (e.g., cash, check, electronic) is most effective for both pre- and promised incentives when recruiting teachers into survey panels?
We explore other, perhaps more nuanced, findings regarding the format of incentive. First, when comparing Strategies 2 (USPS + $10 gift card preincentive) and 3 (USPS + $10 cash preincentive), we do not see statistically significant evidence that the use of cash outperforms gift cards as a preincentive. However, the cash-based strategy is estimated as yielding a moderately higher response rate (23.2% vs. 18.0%; p-value = 0.151) and as being more cost effective ($65.52 vs. $84.44 per enrollee; p-value = 0.166).
The electronic gift card (Strategy 7) appears to perform the best among the strategies considered here that involved a gift card as a promised incentive. For instance, comparing its response rate and cost effectiveness to that of Strategy 4 ($40 Target gift card), we get p-values of 0.087 and 0.064, respectively, indicating statistical significance at the 10% level but not the 5% level.
Can pre- and promised incentives be effectively used in tandem when recruiting teachers into survey panels?
We see that the combination strategy (Strategy 8: $2 cash preincentive + $40 Target promised incentive) does not appear to outperform the analogous $10 USPS Target gift card preincentive strategy (Strategy 2); response rates are 19.6% vs. 18.0% (p-value = 0.647) and cost effectiveness is $78.82 vs. $84.44 (p-value = 0.459).
Finally, when comparing Strategies 1 and 10 (email-less), it appears that replacing six email follow-ups with two mail follow-ups did not notably hinder responsiveness (27.6% vs. 24.0%, p-value = 0.262) but did increase cost per enrollee ($66.95 vs. $101.88, p-value = 0.003).
Nonresponse Bias
Since the high rates of nonresponse observed among the various phases of recruitment have the potential to jeopardize the generalizability of findings from surveys that use the teacher panel, we are interested in studying nonresponse bias. The meta-analysis of R. M. Groves and Peytcheva (2008) concludes that nonresponse rates are a poor predictor of nonresponse bias, so the low response rates that we observe are not in themselves indicative of substantial bias. Nonetheless, we present diagnostics here that evaluate the potential for bias that stems from nonresponse at the recruitment phase. Specifically, we compare observable demographic-type characteristics of panel members to corresponding characteristics of nonrespondents (where nonrespondents include any recruited teacher who does not enroll in the panels). These analyses are repeated for all recruitment strategies considered. We examine individual-level characteristics including subject taught and gender. The remaining characteristics are descriptors of the teacher’s school. All characteristics are categorical—each characteristic is underpinned by at least two categories. In all, there are 27 categories underpinning the 8 characteristics.[10]
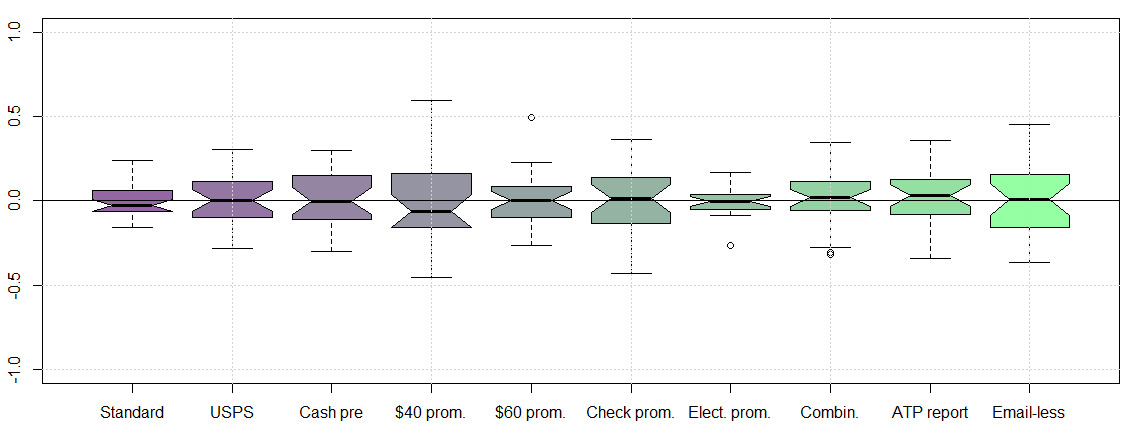
For each of the 27 categories (and each of the 10 strategies), we compare the portion of respondents who enrolled in the panel that fall into the respective category to the corresponding value for those who declined to enroll. For the purposes of standardization, the comparison is made using the quantity Cohen’s (Cohen 1988), where for two proportions and If for a given strategy, 50% of teachers who enroll are female, whereas 60% of those who decline to enroll are female, we would observe (which is commonly considered a small difference). We compare categorical frequencies for responders and nonresponders (instead of examining response rates within the various domains), as doing so allows comparisons across strategies that observe differing rates of response. Figure 1 shows box plots of the resulting 27 values of Cohen’s for each strategy.
_differences_between_empaneled_teachers_and_n.png)
To quantify the statistical significance of discrepancies observed, we report (for each strategy and each characteristic) a p-value of an omnibus test that assesses (jointly across all categories of a variable) the presence of differences in the categorical frequencies of panel members vs. nonresponders. These comparisons are performed using Fisher’s exact test; the results are shown in Table 4. However, some nonresponse bias may be unavoidable—perhaps the more relevant issue is whether or not the bias is affected by the strategy implemented. Hence, for each strategy used to recruit teachers, we report a p-value of an analogous test that compares enrolled panel members sampled using each strategy to enrolled panelists sampled using Strategy 1.
Figure 1 shows that most of the values of Cohen’s are small (77% of all the computed values observe although outlying values are present.[11] However, the vast majority of differences observed between enrollees and nonresponders for the other strategies are not statistically significant for all strategies, although tests for these strategies may be underpowered.[12] In addition, from Figure 1 and Table 4, there is no compelling evidence that the degree of nonresponse bias is affected by the strategy implemented.
Conclusions
Our study enhances the literature on surveying educators and recruitment into survey panels in general by establishing many interesting findings as a result of the experiment considered here. We illustrate that teachers respond at much higher rates when FedEx (in lieu of USPS) is used for mailing of recruitment materials; in fact, the increased response rate is more than enough to offset the higher costs. We hypothesize that the improvement is explained by a FedEx package appearing more official and being more likely to catch the attention of a recipient. Further, we establish that a reasonable preincentive ($10) is more successful at achieving higher response rates than promised incentives of a much larger amount (up to $60). In fact, the use of the promised incentive is shown to be less cost effective despite up to three quarters of the recipients of the preincentive failing to enroll.
Teacher recruitment for the MLI-related expansion was designed to take place over 16 waves during the 2016–2017 school year, wherein approximately 4,000 teachers would be contacted in each wave. The expansion effort (designed to develop state-level subpanels in 22 states plus New York City) resulted in the enrollment of 19,500 teachers. Approximately 63,000 teachers were contacted across the 16 recruitment waves. Further details regarding this expansion effort can be found in Robbins and Grant (2020).
To briefly summarize the findings in Robbins et al. (2018), five strategies were evaluated: (1) a $10 contingent gift card (10.5% response rate at a cost of $69.93/enrollee); (2) a $10 noncontingent gift card (21.2%, $77.92); (3) a $20 noncontingent gift card (22.8%, $116.32); (4) a $20 contingent electronic gift card (1.2%, $1,626.24); and (5) a $10 contingent gift card with phone follow-up (15.6%, $191.54). All strategies (except for the fourth) involved FedEx mailing, and all strategies involved email follow-up with nonresponders. In consideration of both response rate and cost effectiveness, the strategy involving the $10 noncontingent gift card was deemed preferable. The experimentation was performed between December 2014 and February 2015.
Each of the ten strategies involves the following. The targeted teacher is sent a recruitment package via FedEx or the USPS. The package contains a RAND recruitment letter that invites the teachers to join the panel, as well as a brochure that describes the panel. Further, endorsement letters from educator unions (this includes the National Education Association and the American Federation of Teachers) are included in the package. In limited cases (OK and NC), the package includes an endorsement letter from state education departments. Incentives are also included in the package, although this varies by strategy. Contacted teachers enroll in the panel by completing a brief 5-minute enrollment form online or returning their enrollment form (3 pages) via mail. (Approximately 87% of the forms returned as part of this experiment were submitted online.) Each recruitment package included a hardcopy teacher enrollment form and a RAND business reply envelop so that teachers were simultaneously given the option of enrolling into the ATP via mail or Internet. We also sent all teacher recruits an email invitation to enroll in the ATP. Unless otherwise noted, nonresponding teachers are sent weekly reminders by email for six weeks following the mailing of the initial recruitment package to encourage them to enroll in the ATP. The recruitment materials for all experimental groups were mailed on October 20, 2016. FedEx shipments were delivered the next day. Teachers who enroll in the ATP are then contacted via email and asked to participate in future online panel surveys (up to 4 per year) at later dates. Contacted teachers were also notified that they would be given gift cards for taking surveys administered as part of the ATP. (The amount of these gift cards depends upon the survey length; $25 is common.) Note that same cover letter was included in the recruitment package for all recruitment strategies; however, one paragraph in this letter was modified as needed to describe the incentive used (when an incentive is used).
Although earlier studies have shown that preincentives outperform promised incentives of similar amounts (e.g., Robbins et al. 2018), our goal here is to compare preincentives to notably larger promised incentives.
Contact information for teachers targeted for recruitment was purchased from a vendor. The information includes name, email, and school address and phone number.
These cost sources included purchasing the sampling list (i.e., the list of teachers purchased from a vendor), mailing recruitment packages (including the cost of shipping materials via FedEx or USPS, the cost of printing recruitment materials (brochure, enrollment forms, return envelopes, ATP report), the labor required to assemble the recruitment packages), and costs of pre- and promised incentives.
Costs excluded in this analysis include the fixed cost required to encode the demographic data collection in a Web portal, and costs for researcher time (e.g., time spent designing the survey instrument and recruitment tactics, time spent compiling and analyzing findings, etc.)—these costs can be harder to quantify and are mostly independent of the specific recruitment strategy employed. (That is, these costs do not influence comparative cost-effectiveness of the various strategies.)
Standard errors for costs per recruited panelist are approximated algebraically using the delta method; see the footnotes to Table 3 for details.
The eight characteristics (with the categories that underpin each of them in parentheses) are Subject (ELA/social studies, general elementary, math/science, other); Gender (male, female); Region (Midwest, Northeast, South, West); Percent Free/Reduced Price Lunch (0%–25%, 25%–75%, 75%–100%); Size (small, medium, large); Urbanicity (city, suburb, town, rural); Level (elementary, middle, high, other); and Percent Minority Students (0%–25%, 25%–75%, 75%–100%). Subject and gender are measured at the teacher level; other characteristics are at the school level.
Strategy 4 ($40 Target promised) observes a couple of outlying values; e.g., for this strategy, 20% of enrollees are at medium-sized schools vs. 47.6% of nonresponders (h=0.60), and 10.0% of enrollees are male vs. 27.1% of nonresponders (h=0.45). Table 4 indicates that these differences may be statistically significant. For Strategy 1 ($10 Target gift card as preincentive with FedEx mailing), which had the largest sample size, most of the values of Cohen’s h are small. However, we see some evidence that nonresponders differ from enrollees across the characteristics considered for this strategy. Specifically, enrollees in Strategy 1 are 15% male, whereas nonresponders are 21% male. Likewise, 4.5% of enrollees are from the Northwest and 12.1% are from schools with 0-25% free and reduced-price lunch; whereas, corresponding values are 10.7% and 18.1% for nonresponders. These differences show statistical significance at the 5% level.
Naturally, these differences do not appear as statistically significant when multiple testing adjustments, such as those of Benjamini and Hochberg (1995), are applied. (Details are omitted for brevity.)