Assessing the Problem and Defining Terms
In questionnaire design, close-ended questions (e.g., agree or disagree Likert scales, satisfaction ratings, preference rankings, frequency measures) are best used when a topic or construct is clearly defined, and the responses may be articulated in a few, simple pre-defined options. Open-ended survey questions, on the other hand, are more useful when asking about complex or “fuzzy” constructs—topics that are not well defined or may solicit a variety of responses that cannot be easily captured in one or more closed-ended questions.
Open-ended questions can be used as follow-ups to closed-ended questions, where the respondent is invited to expand on a particular topic or respond to a question in their own words in an unaided, freeform way (e.g., the classic “Please Specify” following selection of the “Other” option in a closed-ended question). They can also stand on their own as primary questions on a topic where closed-ended questions may not capture the information needed. Unlike closed-ended questions, open-ended questions can encourage respondents to share details about their experiences that the researcher did not anticipate, potentially sharing information more openly when the topic is sensitive or relates to personal matters (Allen 2017). By soliciting authentic feedback and highlighting the diversity of responses, open-ended responses often capture the “why” that complements quantitative results, helping to tell a more nuanced story with the data.
The one commonality of all open-ended questions is that they do not prescribe how the respondent should answer, beyond the specific instructions or question phrasing. There may be character or space limits, but what the respondent shares is up to them. In addition to “Other (Specify)” questions scattered throughout a questionnaire, surveys often place general open-ended questions at the end of a questionnaire as a way to “wrap up” and provide respondents with an opportunity to share any final thoughts. The all-encompassing prompt “Is there anything else you would like to say?” at the end of a structured questionnaire is a common example of this (O’Cathain and Thomas 2004). While much has been written about how to write quantitative survey questions (e.g., Dillman and Dillman 2000; Fowler 1995; Tourangeau, Rips, and Rainki 2000) and report on them (Heeringa, West, and Berglund 2017), much less has been said in our field about how to ask and analyze open-ended questions. Their place as a qualitative metric in an otherwise quantitative survey often makes them not quite substantial enough for a fully qualitative study, but not quite measurable enough to be useful for quantitative analysis.
Thematic analysis using a coding system to organize information in a way that allows researchers to draw reasonable and meaningful conclusions from the data is a widespread method for qualitative analysis (Suter 2012). At the same time, quantitative researchers who choose to include open-ended responses in their surveys do not always make full use of the resulting qualitative data, either because they do not have an explicit analytical strategy, or because of limited time, resources or expertise in how to analyze and present the findings (Decorte et al. 2019). When quantitative researchers do present open-ended data alongside quantitative results, approaches may be perfunctory at best—such as selecting a few quotes to exhibit, or word clouds—and can reduce the value and depth of the information, ultimately devaluing the time and effort respondents may have taken to provide a response (Singer and Couper 2017). This is not entirely the fault of individual researchers. It is widely acknowledged that techniques for qualitative visualization are less developed than for quantitative analysis (Evergreen 2020).
Despite potential challenges that researchers may associate with analysis and reporting on open-ended survey responses, our goal is to highlight simple data visualization techniques available through basic software that can transform these data into a visually compelling story. The qualitative data presentations in this article were all created using Microsoft Office products such as PowerPoint and Excel, which have incredibly powerful visualization capabilities that can make visualizing qualitative data more accessible than it once was. The remainder of this article highlights how data visualization can be used as a tool to enhance our understanding of open-ended survey responses and to complement or augment the broader narrative derived from quantitative data.
Simple Methods for Tackling Open-ended Data Analysis
Coding the Data
Open-ended survey responses should be used to enhance, confirm, or refine the story told through quantitative data. For example, if survey respondents generally rate a program favorably, the open-ended feedback may highlight the specific aspects of the program that participants appreciate the most. Similarly, a follow-up open-ended question can add important nuances to the quantitative items that precede it. For example, in a survey related to willingness to receive a new COVID vaccine, open-ended feedback may shed light on why respondents may be willing or unwilling to get vaccinated. Qualitative data may also be used to highlight weaknesses or inconsistencies in the quantitative data itself. Using the vaccine hesitancy example, before COVID vaccines became widely available, many Americans were reluctant to definitively say whether they would or would not get vaccinated, instead reporting that they “didn’t know” or were “unsure.” News reports that focused on the proportions that would get the vaccine thereby showed relatively low levels of acceptance (Neergaard and Fingerhut 2020) strategically-crafted open-ended follow-up question could have shown that most of these respondents simply needed more information (and what kind) or preferred to wait and see. Open-ended data could therefore have reframed the narrative that took hold from the survey results.
The first step in exploring responses from open-ended questions is to review the raw responses and begin the process of preliminary data coding using a combination of deductive codes drawn from the research questions and inductive codes generated by the data. As the coding progresses, the initial codes are grouped into categories while attributes emerge, forming new codes (Saldana 2015). Throughout this process, patterns in the data begin to take shape, forming the outlines of a story or stories that will add richness to the results.
Specific visual presentations may require that the codes and categories be organized in unique ways, and the process is inherently dynamic. For example, researchers may want to consider the number of codes, the use of primary and secondary codes, or the connections between codes to prepare for different types of visualizations. Importantly, the storytelling approach, subject matter and target audience for both the quantitative and qualitative items in the survey drive the amount of context needed or the level of complexity, and ultimately will inform the choice of visualization.
Assessing Your Toolbox of Visualization Strategies
Data visualization is the practice of translating information into a visual context. The goal of any data visualization is to make the most important findings easier for a viewer to extract, and ideally, to help drive decision-making (Berinato 2016). According to Gestalt principles for data visualization, there are psychological and perceptual roots to how people perceive visual stimuli and make meaning from it; essentially, how the brain understands visual information (Knaflic 2015). These principles—proximity, similarity, closure, connection and enclosure—serve as a data visualization “toolbox” (Betzendahl 2020; triva79 2019). While these principles are most often applied to quantitative data, they can be used to transform qualitative data as well.
Applying Gestalt Principles to Qualitative Data Visualization
Once a survey’s open-ended responses have been thematically coded in some meaningful way, they can be visually represented using the following Gestalt principles:
Color and shape can be used to highlight commonality among respondents or topics. This may include visualizations such as a heat map or a spectrum display. While these are both commonly used for small-sample interviews or focus groups, they can be adapted to qualitative survey data to convey how respondents may be grouped together, for example, highlighting differences in opinions among different demographic groups who completed the survey.
Weight or size can display importance of information or a hierarchy of findings. While word clouds may be the most commonly used version of this (and arguably the least informative or valuable), a packed bubble diagram can be used to highlight notable themes while also displaying a second dimension. For example, in a survey of parents returning to work after COVID-19, the majority may say that they are “uncertain or nervous about their return.” However, open-ended survey responses may highlight differences in the reasons behind this uncertainty between male and female respondents. Each bubble can capture important nuances of the responses; for example, the size of the bubble can convey how frequently the response was selected, the placement can convey how it relates to other responses (such as clustering related responses), and the color can display key demographics such as who was more likely to support that sentiment.
Proximity and connection may be used to highlight the interconnection of ideas such as a process chart or a Venn diagram. In interviews or focus groups, this may be through a description of cause and effect. When it comes to open-ended survey data, proximity may highlight how different themes interrelate, with topics or themes that are closely related placed visually close to each other in the visualization, and loosely or unrelated topics placed further apart.
Examples from Two ICF Data Sets
This section demonstrates the principles discussed previously by applying them to open-ended responses from two surveys conducted by the research and consulting firm ICF. Both used the Surveys on the Go® smartphone-based nonprobability panel to collect quantitative and qualitative data from respondents.
-
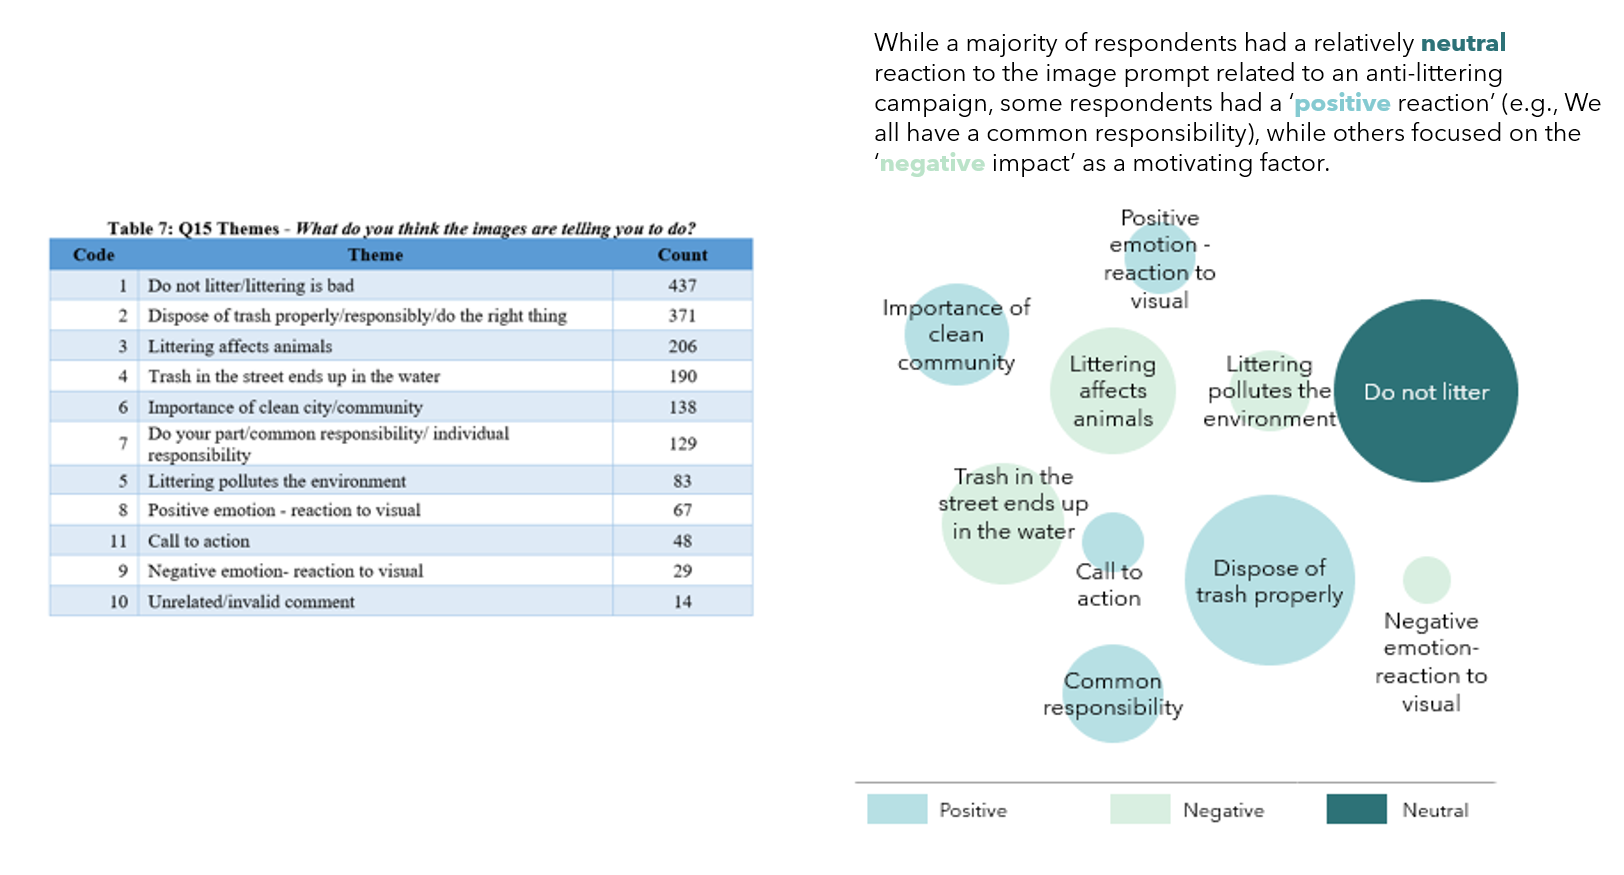
Anti-littering Campaign (New York City): Respondents were asked about their opinions and attitudes about trash and littering, their littering behavior, and reasons why they litter. They were also asked to assess images from an anti-littering campaign, and whether they had seen those images around New York City. The results described in this article are based on 1,000 completed questionnaires collected in 2018. After viewing an image, respondents were asked to provide feedback to the following question: “What do you think the images are telling you to do?” All responses were coded into 10 thematic categories[1] and presented in descending order.[2]
-
COVID-19 Monitor Survey (US): Using a Census-balanced, national sample of approximately 1,000 adults from the same panel vendor, this survey asked respondents about their experience with and opinions about COVID-19, such as the government’s response to the virus, personal financial impact, and the effect of lockdowns on mental health.[3] The results shown in this article are based on three waves of the study, which fielded in May, June, and July 2020. Respondents who indicated that they were unwilling to receive a COVID vaccine as soon as it became available were asked to identify the reasons why; these freeform statements were then assigned one of 10 categories, after the process of grouping similar codes together.
Figure 1 highlights two versions of the same data gathered as part of the Anti-littering Campaign (n = 786). The first is a traditional table with the counts associated with each category in descending order; the second is a packed bubble chart, created in Excel, which uses the Gestalt principle of size to portray the importance or frequency of each category in relation to the others (i.e., the largest circle was the most common response). By applying a secondary principle, color, the figure also indicates a secondary dimension, in this case the “tone” of the comment. Generally, people responded in one of the following three ways:
-
They were neutral in their feedback and understood that the image was telling them “not to litter.”
-
They generally conveyed a positive tone or impact related to community (i.e., a shared responsibility or call to action)
-
They pointed to the negative impact of littering (e.g., it harms animals or pollutes the environment).
These nuances are incredibly valuable for assessing motivating factors and potentially tapping into these themes for future messages. By effectively using color and size, the open-ended data now adds value to the interpretation of survey results.

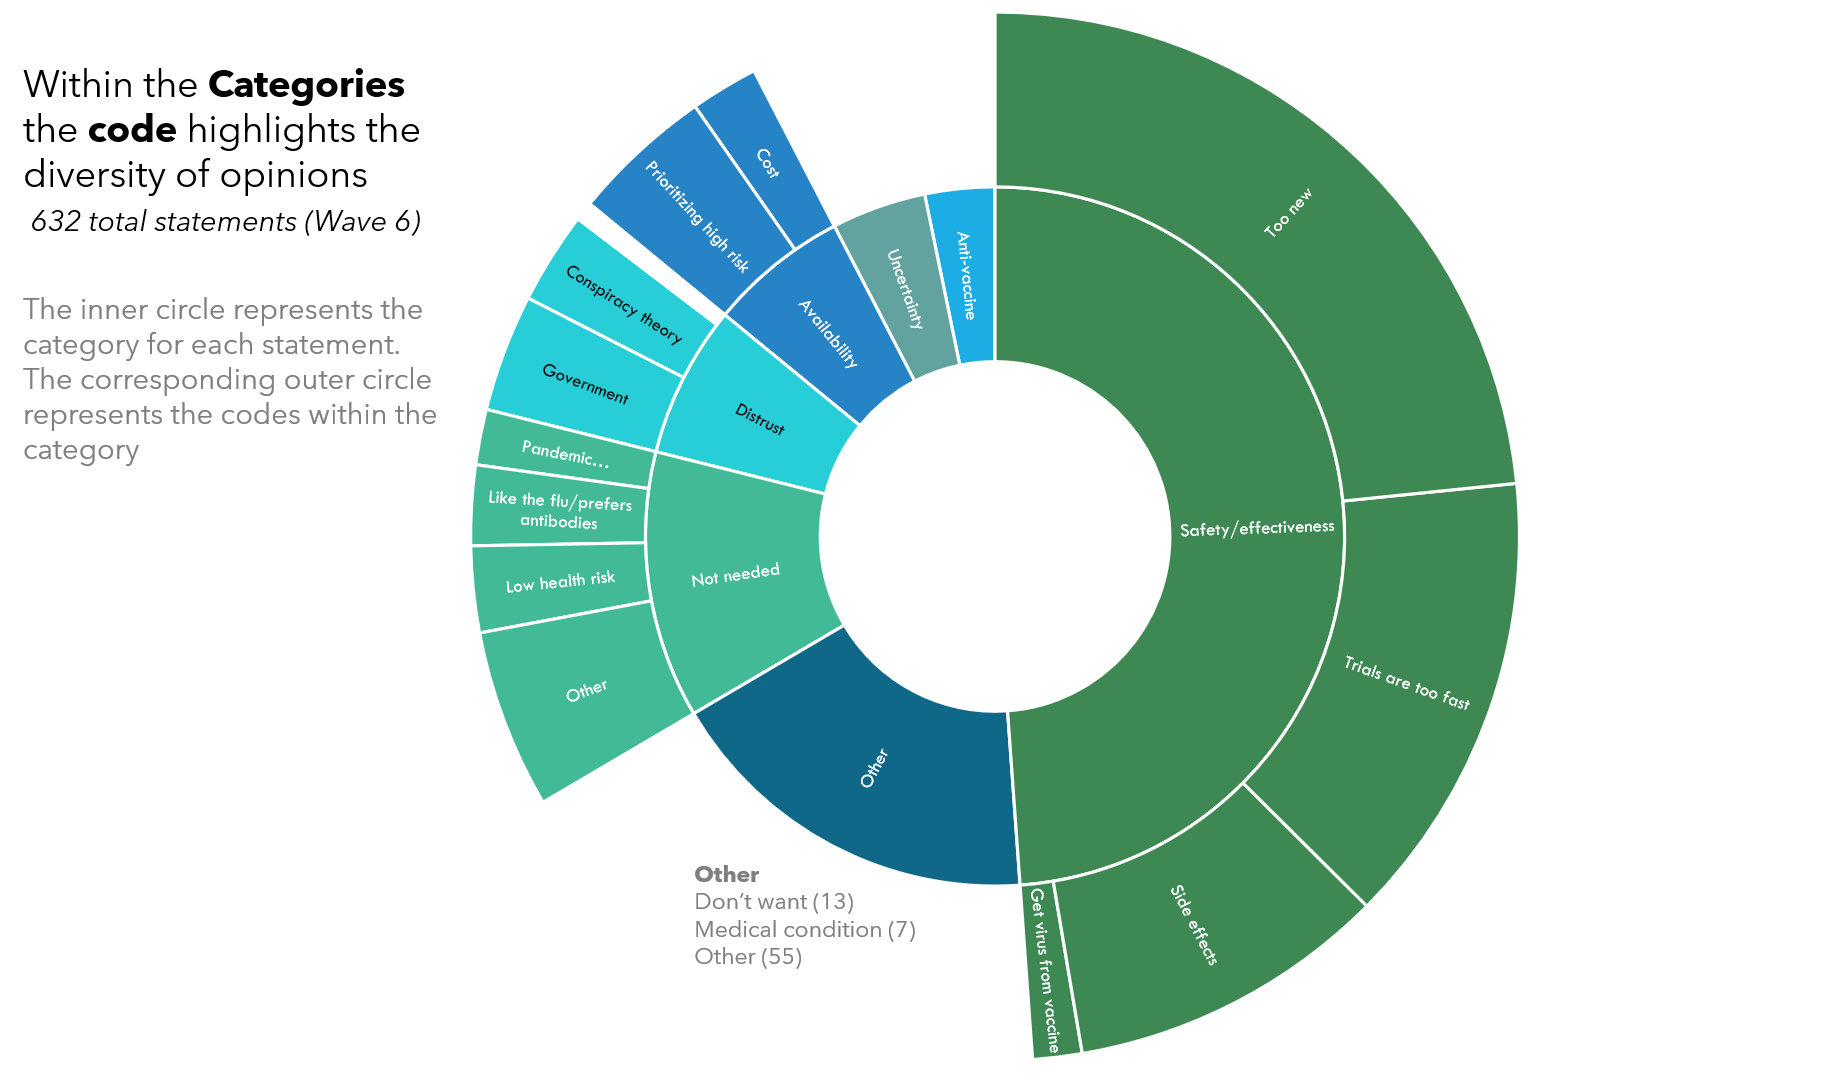
Another important principle is that of connection, specifically the way in which multiple layers of meaning within open-ended responses may overlap. Figure 2 presents a sunburst graphic, which illustrates the relationship between the different units of qualitative analysis: the inner circle summarizes the broader category, and the outer circle summarizes any individual codes applied to the data at a more granular level. Each circle should be read like a doughnut plot or pie chart with the amount of space taken up by the “slice” of the donut or pie reflecting the relative frequency or percentage of that concept (i.e., the size principle). While pie and doughnut charts themselves have received well-deserved criticism (e.g., Kosara and Skau 2016; Tufte 2006), we find this specific application to be useful for showing the layers of meaning contained in the qualitative data. For example, within the broader category of vaccine safety and effectiveness concerns, the coders identified attributes that appeared to leave the door open to reconsidering the vaccine when more information became available (i.e., it was “too new,” or that the clinical trials were too fast).

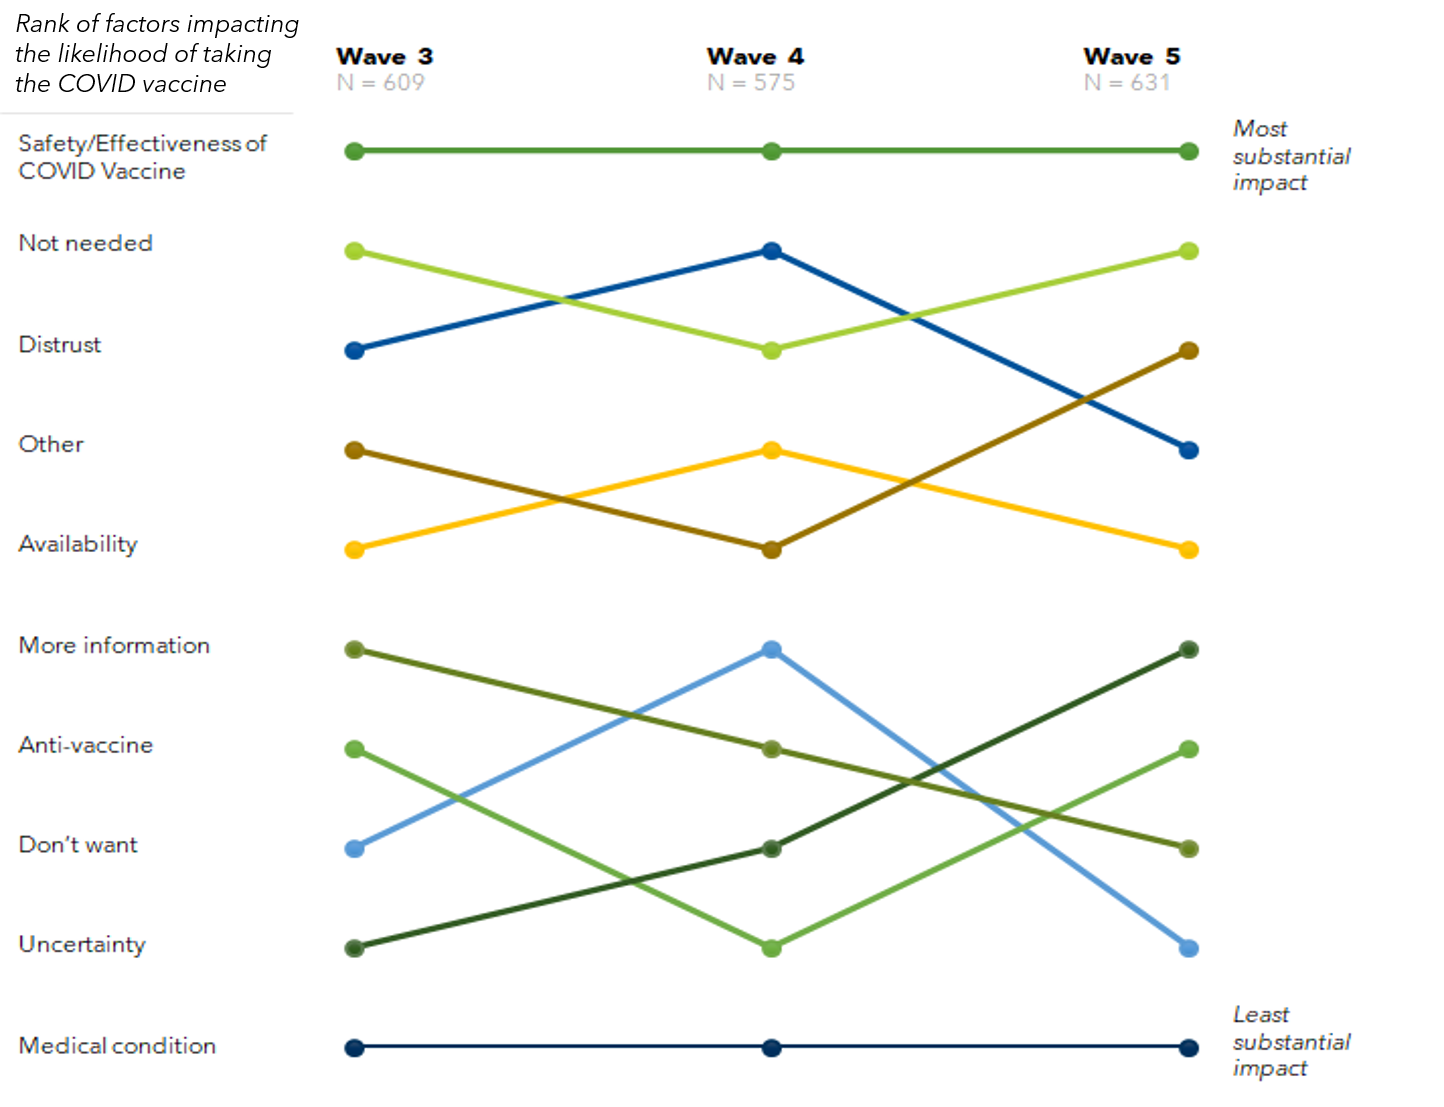
If the coding process identifies a hierarchy of concepts, there are ways to display that information in a way that retains this ranking or illustrates how it may change over time. Figure 3 is a dot plot of three waves of data. By applying the principle of proximity, the graphic identifies the change in importance for each of the 10 categories. While the categories that were most substantial (safety/effectiveness of the COVID vaccine) and least substantial (medical condition) remained consistent, the importance of the other eight in impacting the likelihood of getting the vaccine varied across waves. For example, uncertainty generally increased as a factor over time relative to other factors, while the need for more information decreased in importance.
Reflection on Open-ended Data Visualization in Practice
Due to a range of practical considerations (e.g., cost, time, and staff availability), researchers often must pick between quantitative and qualitative data, and fail to recognize the potential of using a few carefully-selected open-ended questions within quantitative instruments. Since respondents have spent time and effort to provide this data, there is often a desire on the part of study team to “do something” with it, but too often, the open-ends fall by the wayside—usually becoming a word cloud or a table in the appendix of a report. We strongly believe that qualitative data, when visualized in creative ways, can provide context and nuance that can enhance and illuminate the quantitative findings, adding depth, rationale, or even just a telltale example to the data-driven narrative. When combined with the quantitative data, open-ended responses can be transformed into dynamic data stories told through simple visualization techniques.
An eleventh category reflected responses that were unrelated or invalid. This was a small fraction of the total responses and is not particularly helpful for analysis.
It is worth noting that some respondents provided an answer that did not directly address the original question. While respondents were asked “What do you think the image is telling you to do?”, many responses were more broadly about “What message do the images convey as to why you should not litter?”
See: https://www.icf.com/insights/health/americans-reluctance-covid-vaccine