What are LASSO Models and How are They Constructed?
Over the last twenty years, the LASSO - or Least Absolute Shrinkage and Selection Operator (Tibshirani 1996) - and its variants like Adaptive Lasso (Zou 2006), and Bayesian Lasso (Park and Casella 2008), have become a core part of the machine learning toolkit. The LASSO is a method that can be applied to ordinary least squares (OLS) or logistic regression problems, among others, where there is an interest in estimating the relationship between either a continuous or categorical outcome and a set of predictor variables. By applying shrinkage factors to regression coefficients, the LASSO method can more effectively perform subset selection (or feature selection) and optimize the form of the regression model more efficiently than other common OLS subset selection methods. LASSO is aptly suited for so called “sparse data” situations - in which many possible predictors are available, but only a few are assumed to be related to the dependent variable. Examples of feature selection in sparse data problems include finding the one or two gene markers (among hundreds or thousands) that predict a particular type of cancer, identifying which topographic variables predict tree canopy cover (McConville et al. 2017), or using census block group data appended to address-based samples to predict the likelihood of survey response.
The LASSO method can be used to model both categorical and continuous outcomes with a mix of predictor types. Regardless of the outcome type, LASSO-based methods fall under a class of models called “penalized regression” models because they impose constraints on the estimated coefficients. These constraints tend to shrink the magnitude of the regression coefficients, often eliminating regressors entirely by shrinking their coefficients to zero. This property of the LASSO makes it naturally suited for variable selection: nonzero coefficients are estimated for true predictors, whereas the coefficients for irrelevant variables are zeroed out. Under certain conditions, LASSO estimates may not be consistent (Zou 2006). The adaptive LASSO (Zou 2006) is an extension of LASSO, where the constraints for the regression coefficients are weighted. Adaptive LASSO (ALASSO) estimates have the “oracle property.” Zou (2006) shows that ALASSO estimates are not only consistent but as efficient as if we only included relevant predictor variables. In practice, this means that researchers can include numerous predictors without suffering the inefficiency that accompanies irrelevant variables.
As previously mentioned, (A)LASSO techniques are especially suited for situations where there are numerous potential predictors, but where we think only a few are likely relevant. This can arise in different ways. The most common is when we think the relationship between the outcome and the predictors is straightforward - e.g., linear with no interactions - but we have many plausible predictor variables. A hundred genetic markers, only one or two of which increase the risk of cancer, would be an example of this.
Another situation that can give rise to numerous potential predictors - and the one that we focus on here - is when we have a limited set of covariates, but we think they may be related nonlinearly to the outcome variable, possibly with interactions. In this case, (A)LASSO can be applied to a “basis expansion” of the predictor variables. Basis expansions generally refer to a set of nonlinear transformations of the predictor variables, such as a polynomial expansion, splines, or radial basis kernels (see Hastie, Tibshirani, and Friedman 2009, 139–90). The idea motivating this is relatively simple - we approximate nonlinearities in the relationship between the outcome and the predictors using polynomial terms and interactions of our predictors (see, for example, Kmenta [1986, pp. 449–450]).
As a simple example, suppose we have three continuous covariates
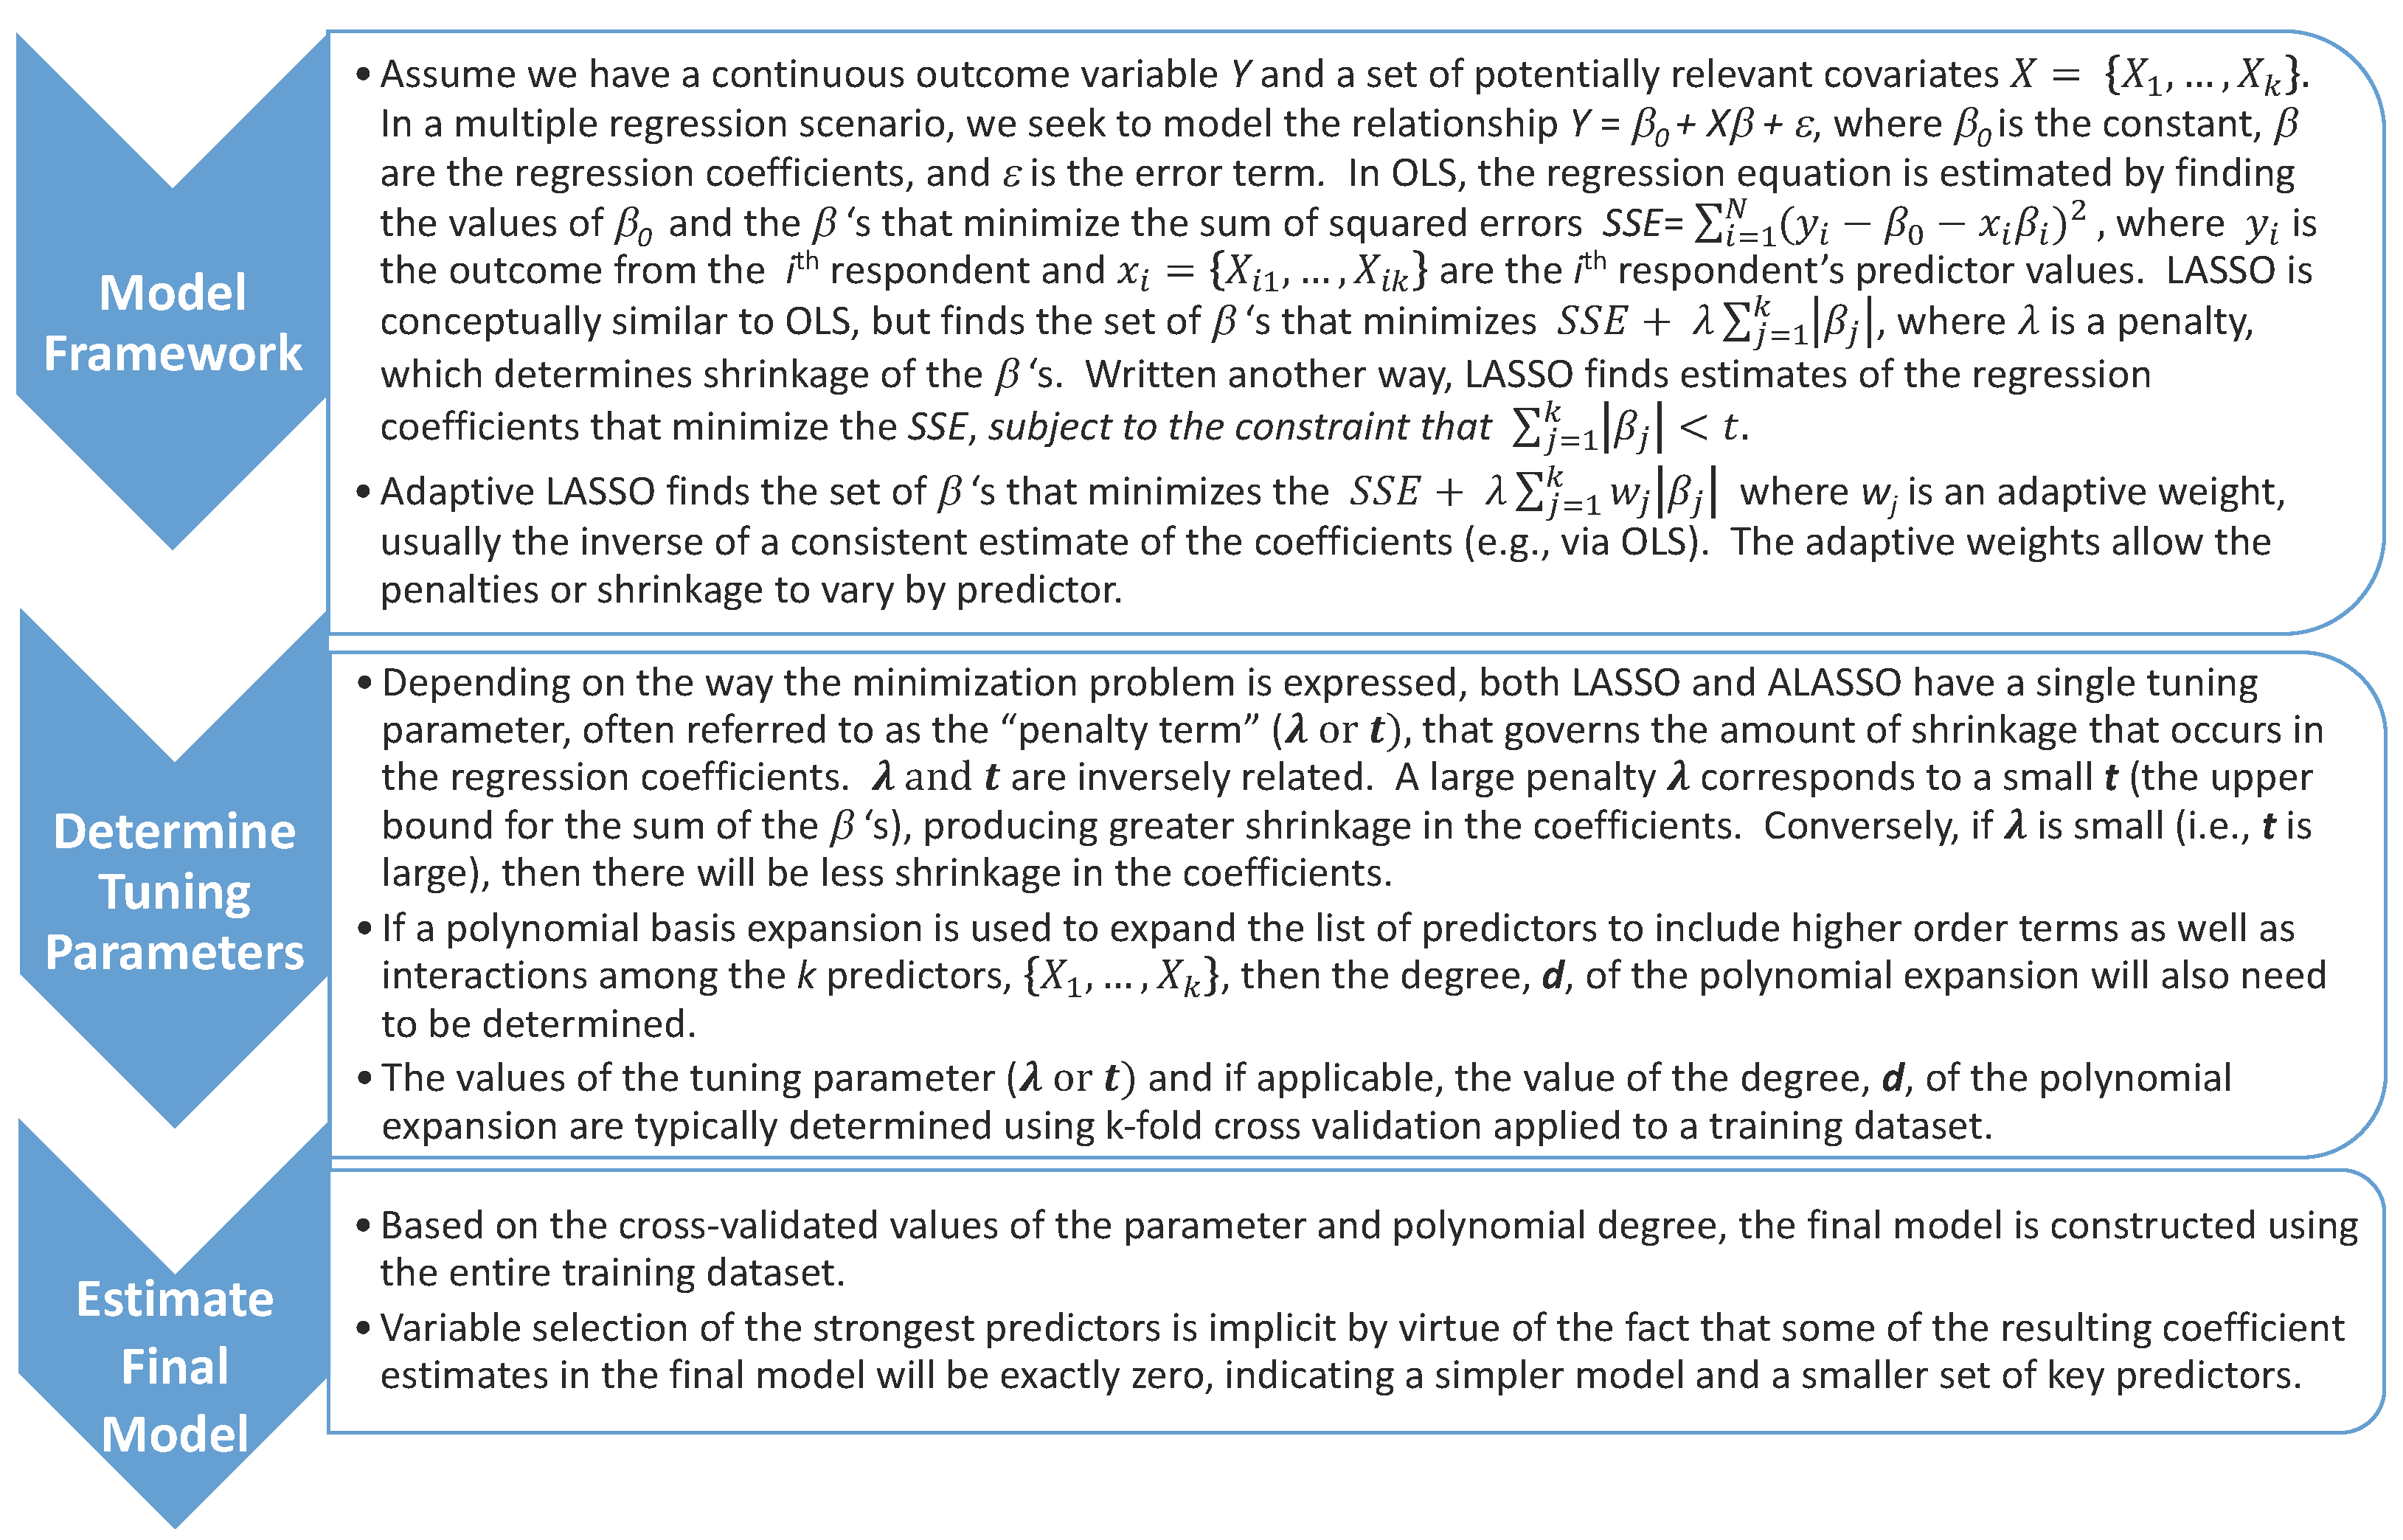
that we think might (or might not) be nonlinearly and interactively related to If we wanted to regress on a second-order polynomial expansion of we would include as predictors plus a constant. A third-order expansion of would produce 19 regression terms, not including the constant: everything in the second-order expansion, plus cubes of the original covariates, the three-way interaction, and interactions of the squares with the first-order terms. While tractable for three predictors, basis expansions quickly create sparse data scenarios as the number of predictors increases. In situations with even 10 predictors, the number of terms in a third-order polynomial basis expansion jumps to 285. Unless the sample size is very large, techniques such as OLS and logistic regression will produce highly inefficient estimates when faced with numerous, correlated, irrelevant predictors or may experience convergence issues related to quasi-complete separation (see, for example, Clarke 2005 on the inefficiency of including irrelevant variables).[1] On the other hand, both the LASSO and ALASSO techniques have been developed specifically for these situations. In Figure 1, we provide an overview of how models are estimated using both the LASSO and ALASSO methods within the multiple linear regression framework, and in Table 1, we highlight a few popular R packages for estimating LASSO and ALASSO models with and without polynomial expansions.

Advantages and Disadvantages of LASSO-based Methods
One of the most appealing aspects of LASSO-based methods involves their ability to perform subset selection with sparse data. While there are other approaches in the class of penalized regression methods that shrink regression coefficients, LASSO-based methods can shrink the estimated coefficients to exactly zero. Selecting only those predictors with estimates that are nonzero provides an implicit approach for subset selection. Despite this great advantage, LASSO-based methods may not produce stable subset selection if the predictors are highly correlated. Other major advantages and disadvantages for LASSO-based methods are summarized in Table 2.
How Have LASSO-based Methods Been Used in Survey Research?
LASSO-based techniques might be particularly useful for survey researchers investigating substantive or methodological topics that involve a large number of predictors. Examples include regression-based imputation or modeling unit nonresponse using a wide range of paradata and administrative data. For the latter, researchers frequently choose demographic variables using logistic regression with main effects to generate weights for the purpose of nonresponse adjustment (e.g., Brick 2013). LASSO-based techniques can aid researchers in these instances to identify relevant variables that are related to the survey response. Moreover, using LASSO-based methods with basis expansions may more efficiently and adequately represent a complex underlying model of survey response compared to a model that uses only main effects or main effects and pairwise interactions. Furthermore, logistic regression relies on a set of modeling assumptions that might be too restrictive and are sensitive to misspecification (Da Silva and Opsomer 2009). Weights derived using these models might not be able to reduce nonresponse bias as well as models that perform better in capturing the true underlying, potentially more complex relationships (Bethlehem 2002, 282). Most recently, McConville et al. (2017) described how LASSO and ALASSO could be used in the context of survey regression estimators to improve the estimates of survey totals in a scenario where extensive auxiliary variables are available. They note that in these situations there are likely many irrelevant predictors that could be eliminated from the survey regression models by LASSO-based methods to improve the efficiency of estimating survey totals.
Classification Example
Using the National Health Interview Survey (NHIS) example training dataset, we estimated a main effects logistic regression and an ALASSO regression with a polynomial expansion of the covariates. The binary outcome variable is survey response. The covariates consisted of demographic variables: age, sex, race, region of country, income, ratio of family income to the poverty threshold, telephone status, education level, and type of employment. Both models were developed using the training dataset and applied to the test dataset to evaluate various performance metrics including percentage correctly classified, sensitivity, specificity, area under the ROC curve, and a measure of balanced accuracy - defined as the mean of the sensitivity and specificity measures. The tuning parameter for the ALASSO method along with the degree of the polynomial expansion were both estimated using 10-fold cross-validation applied to the training data set.[2] Cross-validation error was minimized for a penalty of 1.14 and a polynomial degree of 3. The final ALASSO model uses these values for the tuning parameters.
Table 3 presents the confusion matrix for predicting response status using logistic regression and ALASSO, computed by applying the models to the test data. The correctly classified cases fall along the main diagonal of the confusion matrix, while the misclassified cases fall along the off-diagonal. As can be seen from Table 3, both models correctly predicted the response status for a majority of cases.
Table 4 presents various performance statistics for both of the models. Specifically, Table 4 shows that ALASSO outperforms the main effects logistic regression model considerably: ALASSO correctly classified almost 79% of all sample members in the test data, whereas logistic regression only classified 70% of the sample members correctly.[3] Table 4 also shows that the true positive rate (i.e. correctly classifying actual respondents) is considerably higher for the ALASSO compared to the logistic regression model (logistic: 50%; ALASSO: 60%), whereas the true negative rate for the ALASSO is moderately higher compared to the logistic regression model (logistic: 83%; ALASSO: 91%).
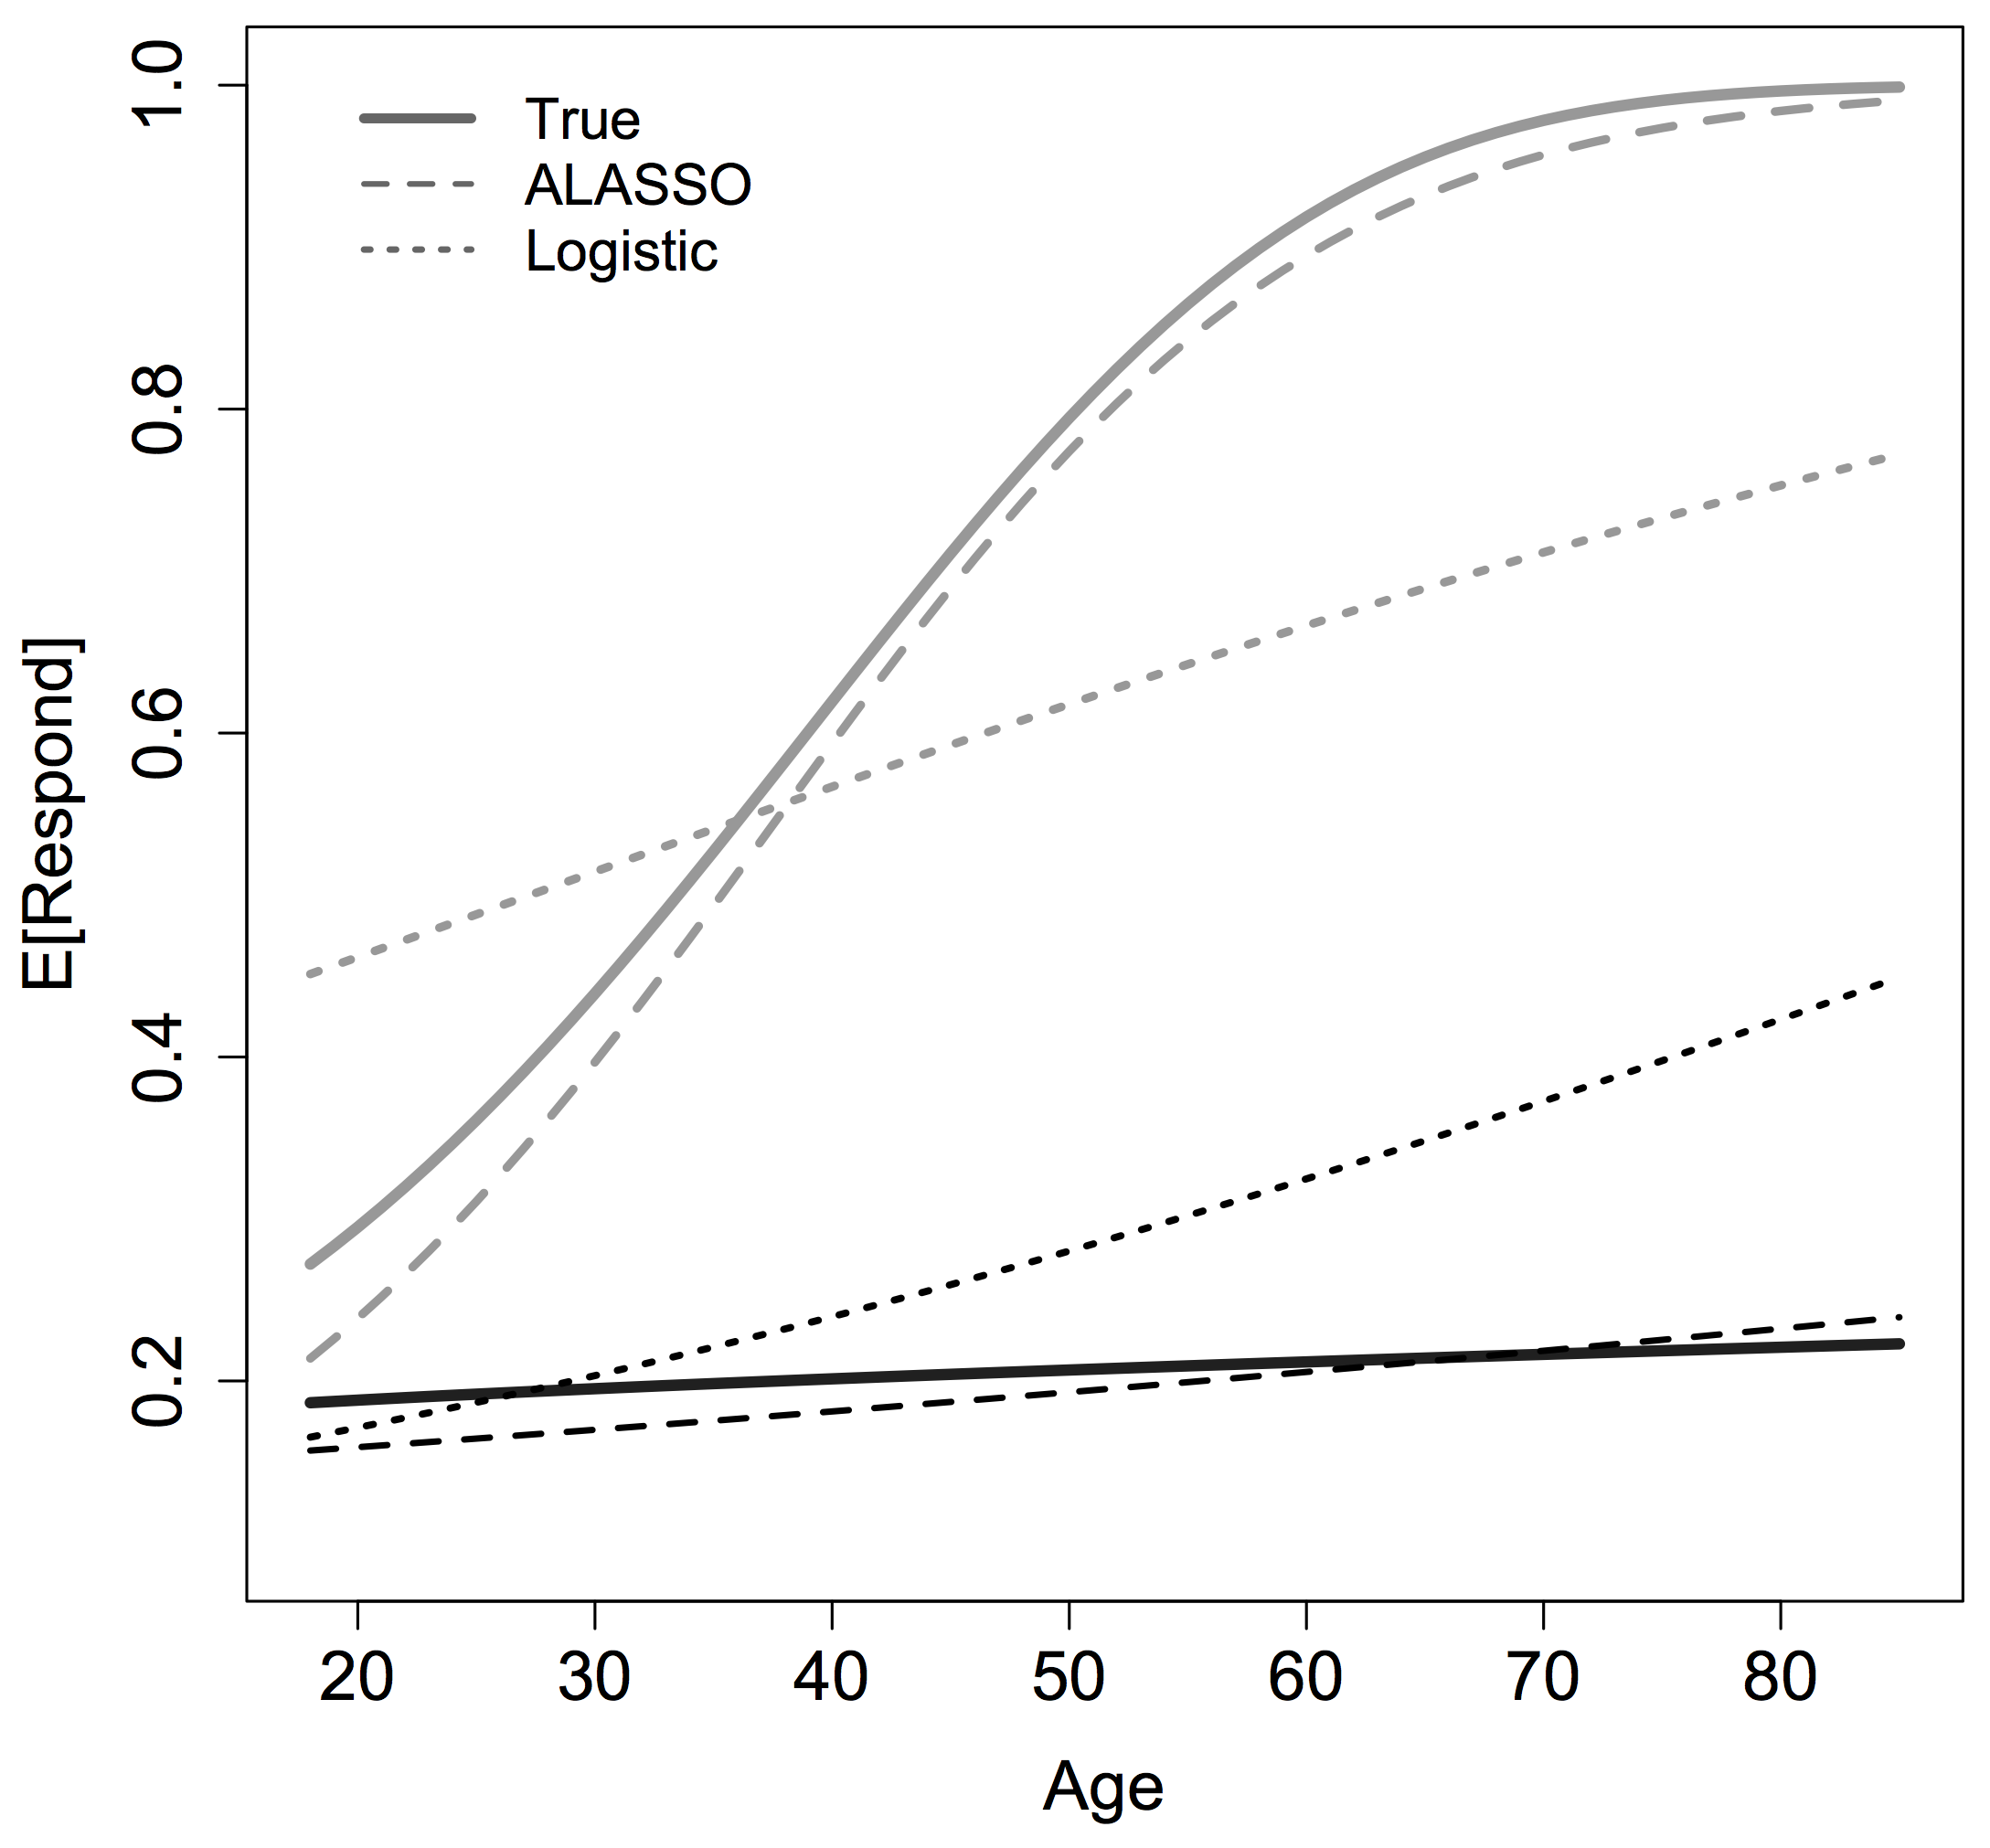
Figure 2 illustrates why the ALASSO model (with a third-order polynomial expansion) better classifies survey response than the main effects logistic regression model. Figure 2 displays the relationship between the probability of responding and a person’s age and education. Two scenarios are presented: In the first scenario, all covariates (except age) are held constant at their median values. The median categories correspond to a white, non-Hispanic, 47-year-old female with a high school education or below, working for a private company with access to both a cell phone and a landline and a family income of up to $35,000. The black lines toward the bottom of the graph reflect this scenario, showing the true relationship (solid), the ALASSO estimated relationship (dashed), and that estimated using logistic regression (dotted). As the figure shows, the ALASSO estimated relationship is very close to the true relationship. Holding all else constant at the median values, the logistic regression fits well for younger respondents, but overpredicts response for older sample members. The differences shown by the grey lines toward the top part of the graph are more dramatic. In this scenario, we continue to hold all variables at their median values, except for education, which is now held at a “bachelor’s degree (or higher).” Again, the nonlinear ALASSO model (grey, dashed) fits the true relationship very well. The logistic regression (grey, dotted), with no higher order or interacted terms, does not.

Centering (or demeaning) the covariates will help reduce some, but not all, of the correlations between the polynomial expansion terms.
By default, cv.polywog() conducts cross validation for first-, second-, and third-order polynomial expansions.
Calculating the proportional reduction in error (PRE) yields a classification error reduction of 30.0% when using ALASSO compared to logistic regression where the PRE is calculated as the difference between the MSE using logistic regression and the MSE using ALASSO divided by the MSE using logistic regression.