Introduction
Qualitative research shows that people living below the poverty line are vulnerable to experiencing transportation insecurity, which Gould-Werth, Griffin, and Murphy (2018) define as a condition in which a person is unable to regularly move from place to place in a safe or timely manner due to the absence of needed resources for transportation. For example, low-income individuals who depend on unreliable public transit, unreliable vehicles, or their social networks to get around (as well as those unable to pay for the cost of public transit fares) have been shown to miss or delay medical appointments (Abramson 2015; Syed, Gerber, and Sharp 2013), forego trips (Seefeldt 2016), and have difficulty regularly visiting family and friends (Briggs, Popkin, and Goering 2010). Car owners who cannot afford car repairs have been found to experience “spontaneous breakdowns” that can leave them stranded on the side of the road and prevent them from accessing destinations (Hamer 2011, 70). In the absence of alternative ways to get around, low-income individuals who are forced to walk or take public transit report being surveilled by police (Rios 2011), exposed to harsh weather conditions (Klein 2020), and fearing for their safety (Hamer 2011). Finally, numerous studies describe what Lowe and Mosby (2016, 6) call the “time tax” of getting around while in poverty. People dependent on public transit, taxis, and social networks endure long travel times, spend a long-time coordinating travel, and find themselves arriving to destinations early or waiting to be picked up because of the schedules of their rides (Clifton 2004; Edwards 2018; Klein 2020; Lowe and Mosby 2016).
Scholars from a wide range of disciplines draw upon a variety of measures as proxies for transportation insecurity. These include measures of car ownership (Smart, Klein, and Mineta National Transit Research Consortium 2015) and neighborhood accessibility (Grengs 2012) as well as some or all of the “five As of access” (i.e., availability, accessibility, accommodation, affordability, acceptability) (Sagrestano et al. 2014). However, as we argued in previous work (Gould-Werth, Griffin, and Murphy 2018), while some of these measures may be correlated with transportation insecurity, they do not always accurately identify people who experience transportation insecurity as described in qualitative research. For example, car owners experience transportation insecurity when they are unable to pay for gas or car repairs (see e.g., Blumenberg and Agrawal 2014), and individuals living in neighborhoods defined as accessible experience transportation insecurity if they are unable to use the available public transit because they cannot afford it or do not feel it is safe to do so (see e.g., Lubitow, Rainer, and Bassett 2017). Lacking a single, valid measure of transportation insecurity, scholars, policymakers, and planners are unable to understand how many people—and which demographic groups—in the United States experience this condition, what causes it, what its consequences might be, and what role it might play in the reproduction of poverty. To enable scholars to investigate these important questions, we advanced a preliminary Transportation Security Index (TSI): a measure that captures the experience of transportation insecurity at the individual level, regardless of geography or mode of transit.
As described in Gould-Werth, Griffin, and Murphy (2018), we developed the preliminary TSI by using the Food Security Index as our model. We drew on ethnographic and interview data (n=187) from three unique studies conducted between 2009 and 2016 across three states to develop 23 items that directly measure the symptoms of transportation insecurity. In 2016, we administered these items to members of an online panel purposively sampled to exhibit variable levels of transportation insecurity. Using an exploratory factor analysis (EFA), we identified a preliminary 16-item measure (TSI16) and determined that a two-factor solution best fit the data. The first factor captured the material manifestations of transportation insecurity: problems getting from place to place in a safe or timely manner because of transportation issues (e.g., being unable to leave the house). The second factor captured the relational manifestations of transportation insecurity: social strains caused by transportation problems (e.g., feeling left out).
The present study aims to determine whether the TSI16 can be replicated and validated in a larger nationally representative sample. Our results show that a slightly modified TSI16 is an effective tool that can be used to uncover transportation insecurity across different samples. They also suggest that, counter to the results of our previous study, transportation insecurity is a unidimensional condition that is experienced both materially and relationally. Together, these findings represent a significant advancement in the study and measurement of transportation insecurity.
Methods
Questionnaire design. The questionnaire (see Appendix A; items comprising the TSI16 are in bold font) we administered was designed to replicate, refine, and extend our previous analyses. Accordingly, we drew heavily from our previous questionnaire (see Appendix A in Gould-Werth, Griffin, and Murphy 2018) but made two minor modifications to the 16 items that comprise the TSI16 (see Table 1 for a comparison of the original and revised items).
First, we modified the response scales. Our EFA results for the preliminary TSI16 supported extracting two factors differentiating between items assessing the material and relational manifestations of transportation insecurity. The two substantive factors identified were also perfectly differentiated by their response scales: items assessing material manifestations used a five-point scale (never, rarely, sometimes, often, very often) and items assessing the relational manifestations used a dichotomous yes/no scale.
In theory, conducting factor analyses on correlation matrices (vs. covariance matrices) neutralizes any difference in response scales (i.e., differences in item means and variances). However, we could not rule out the possibility that the response scales—and not the substantive differences between the material and relational manifestations of transportation insecurity—drove our results.[1] Therefore, we conducted a small split-ballot experiment (details and results available upon request): half the sample received the original five- and two-point response scales and half received a simplified three-point scale (never, sometimes, often). We used this simplified three-point scale because, as indicated by the item response distributions observed in Gould-Werth, Griffin, and Murphy (2018), using the dichotomous yes/no scale for all items would result in the loss of meaningful variability for some items and using the five-point scale for all items would result in the introduction of unmeaningful response variability for other items. We estimated an EFA for each half sample. When two different response scales were used, the EFA recommended extracting two factors. However, when one response scale was used, the EFA recommended extracting only one factor. Concluding that the two-factor solution we initially identified was likely a methodological artifact of the response scales used and that the simplified three-point response scale provided sufficient and meaningful variability, in the current study, we proceeded with this single three-point response scale.
Second, we made small tweaks to the question stems with the goal of simplifying the wording and making it consistent across questions. In the preliminary study, some questions were of the form, “How often have you had to…,” whereas other questions were of the form, “How often did you have to…” (emphasis added here). Therefore, we revised all similar questions so that their structures were of the same form. In addition, as mentioned previously, questions that originally asked whether or not the respondent had a particular experience were revised to ask how often the respondent had the particular experience. We also, as a matter of personal preference, replaced the more informal someplace with somewhere. Last, for Question 5, we simplified from “how often have you been late” to “how often were you late” and removed the reference to “typical week” so as not to confuse the respondent given the question’s 30-day reference period.
In addition to the 16 items that comprise the TSI16, the questionnaire also included questions necessary for evaluating the validity of the TSI: measures of car ownership (i.e., whether someone in the household owns or leases a car for personal use); having a license; the ability to afford needed transportation; household income; disability status; and material hardship.[2]
Data collection methods. When validating a measure using a new sample, it is important to maintain consistency in mode of data collection to ensure that any observed differences in results are not driven by differences in data collection procedures. For this reason, when we collected new data (using a nationally representative sample) to validate the results from our 2016 survey (which did not use a nationally representative sample), as in our preliminary study, we contracted with the GfK group to administer our questionnaire to their online panel (“KnowledgePanel®”). KnowledgePanel® members are recruited using probability-based sampling and an address-based sample frame. Panel members are provided with Internet access and a Web-enabled device, if necessary. The KnowledgePanel® sample frame’s coverage of minority racial and ethnic groups and low-income households is better than coverage in most random-digit-dial samples (Dennis 2010). Further, KnowledgePanel® data have been demonstrated to align with benchmarks from gold-standard Census data (Yeager et al. 2011).
In May 2018, we administered our questionnaire to a KnowledgePanel® subsample (N=4,627) that was nationally representative of adults aged 25 years or older[3] and that included an oversample of people living in households at or below 100% of the federal poverty line. Of the 2,447 panel members who completed the survey (completion rate = 52.9%), 2,011 met the eligibility criteria[4] for inclusion in the sample. Because 12 eligible respondents did not complete the 16 items that comprise the TSI16, they were excluded. Thus, our final analytic sample consisted of 1,999 respondents (43.2% of those originally sampled). As shown in Table 2, respondents were diverse in terms of their demographic characteristics and whether someone in their household owned or leased a vehicle for personal use. Further, when the data are weighted to account for the complex survey design, unit nonresponse, and sample stratification, respondent characteristics are generally comparable to gold-standard benchmarks (e.g., the Current Population Survey and the Panel Study of Income Dynamics). There are two exceptions to this, however: our sample is somewhat more likely to be high income and somewhat less likely to have a vehicle in the household compared to these benchmarks.
Analytic approach. We began by examining descriptive statistics of the 16 items, including individual item response distributions and the correlation matrix. Next, to determine whether the original two-factor structure could be replicated, we compared solutions to one- and two-factor categorical confirmatory factor models. Last, we evaluated the scale’s reliability and validity by estimating Cronbach’s alpha and the degree to which the TSI16 distinguished among groups expected to differ in levels of transportation insecurity (known-group validity).
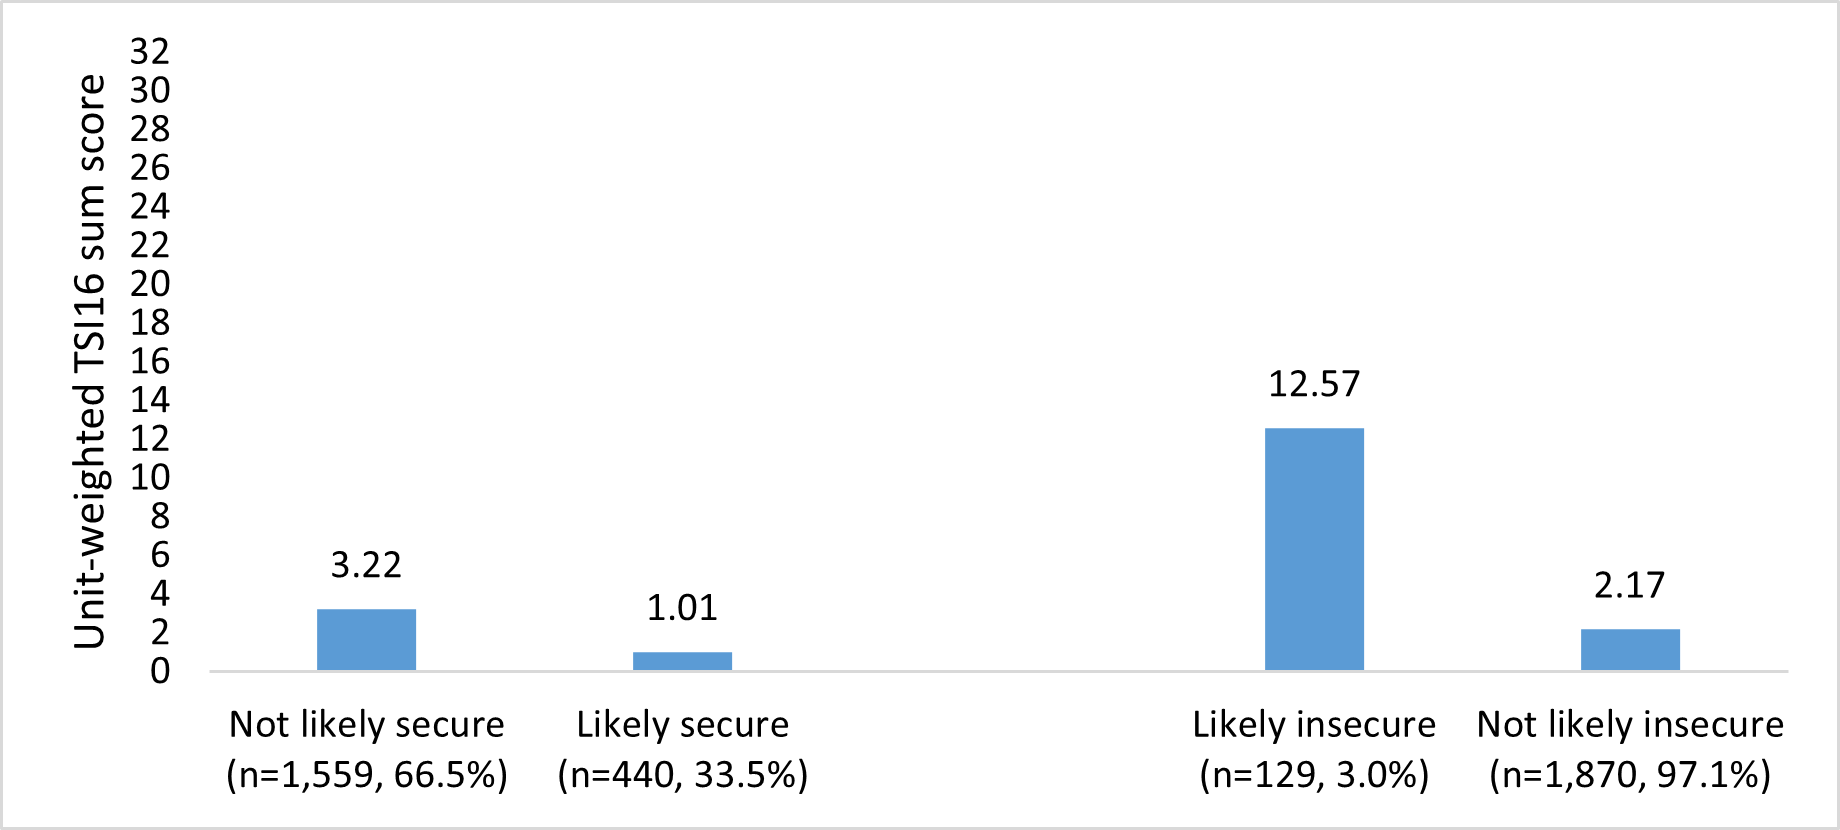
In a replication of an analysis conducted in our preliminary study, we used available survey items that were not included as part of the TSI16 to define the following two groups: (1) respondents who are likely secure, which we define as people who report a household income >= $75,000; have a car for personal use; have a valid license; and do not have a disability (n=440, 33.5%) and (2) respondents who are likely insecure, which we define as people who report problems paying for transportation and at least one of (a) trouble paying for rent, mortgage, or utility bills or (b) disconnection of utilities or telephone service (n=129, 3.0%).[5]
We hypothesized the following:
-
Respondents who are likely secure have lower transportation insecurity scores than those who are not classified as likely secure using this variable.
-
Respondents who are likely insecure have greater transportation insecurity scores than those who are not classified as likely insecure using this variable.
All of our analyses are weighted and, unless otherwise specified, are conducted using Stata 15.1 (StataCorp 2017).
Results
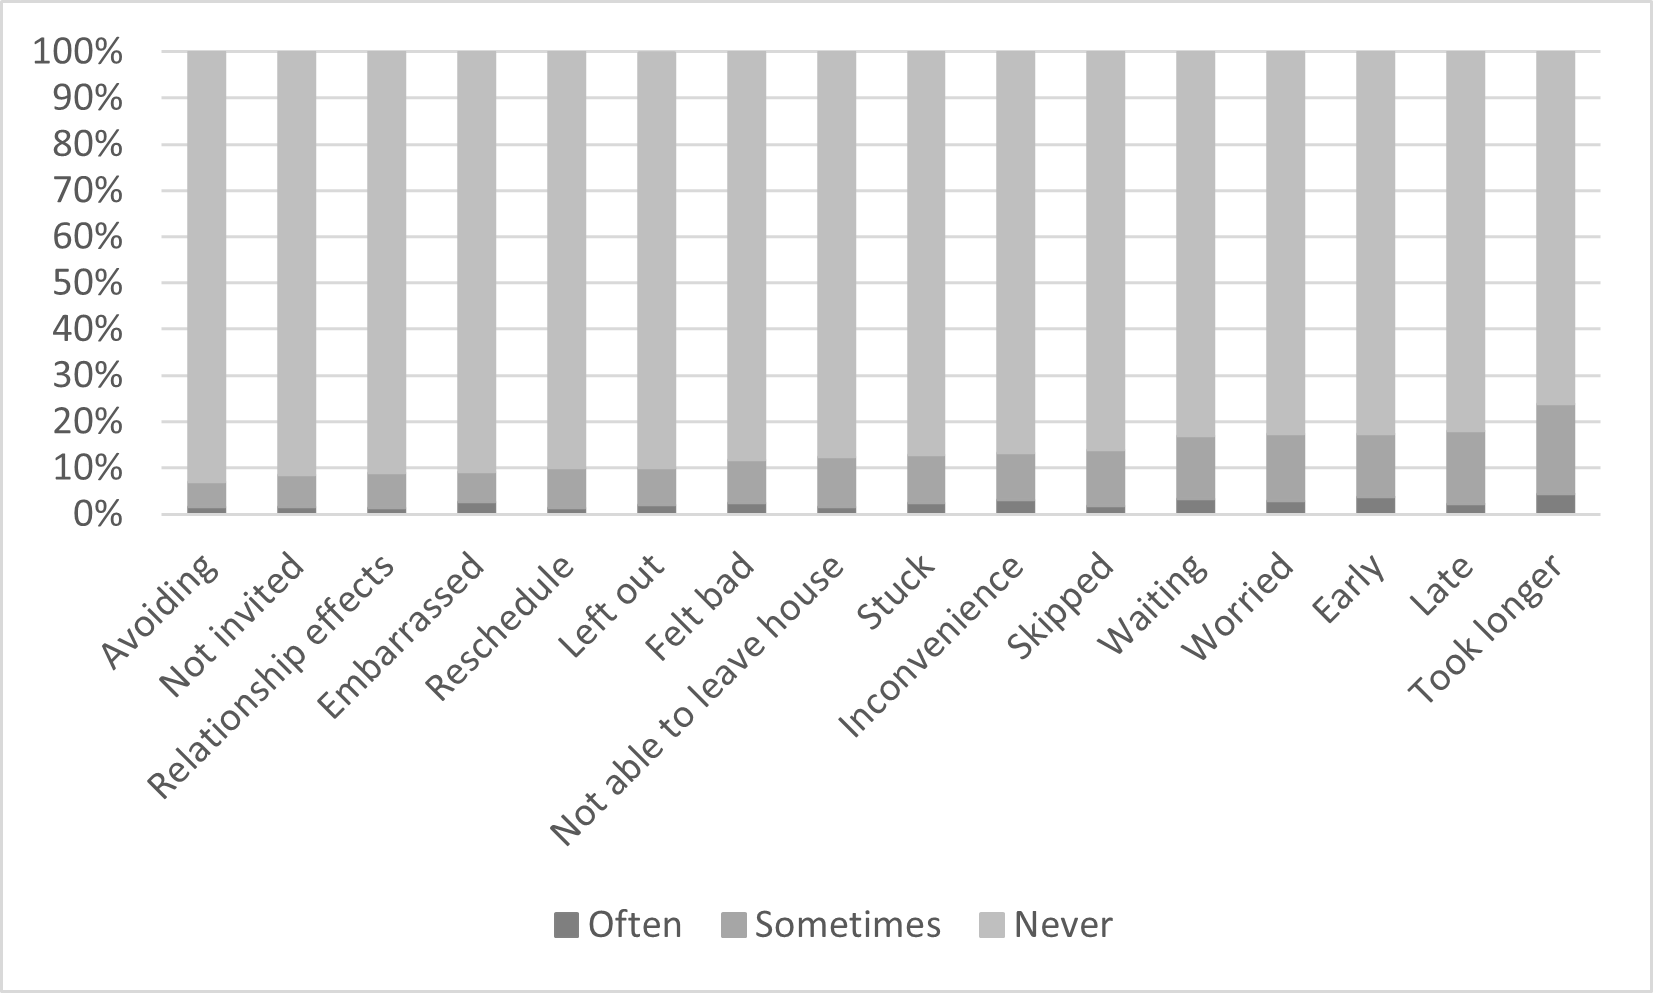
Descriptive statistics. As outlined by DeVellis (2017), items comprising a scale should exhibit relatively high variance (thereby discriminating among respondents with different levels of transportation insecurity) and be highly interrelated (but not redundant). To that end, we began by examining the individual item response distributions and correlation matrix for all 16 items. As illustrated in Figure 1, there is sufficient variability in how frequently each item was endorsed. Specifically, the most frequently endorsed item was took longer, with nearly 25% of respondents reporting that, at least sometimes, in the past 30 days, it took them longer to get somewhere than if they would have had different transportation. Conversely, the least frequently endorsed item was avoiding, with 7% of respondents reporting that, at least sometimes, in the past 30 days, they felt like friends, family, or neighbors were avoiding them because they needed help with transportation. Furthermore, the items were sufficiently interrelated, but not redundant. Specifically, each item was highly correlated with at least 5 other items (r >= 0.7) (see Table 3), and all items had corrected item-scale correlations[6] of at least 0.62. The most highly correlated items were left out and avoiding (r = .93), and the least correlated items were inconvenience and late (r = .58).[7] Notably, removal of any single item from the scale does not improve the scale’s reliability.

Confirmatory factor analysis. To evaluate the two-dimensional factor structure identified in our preliminary study, we compared solutions to one- and two-factor categorical confirmatory factor models. Both the one- and two-factor models were identified by constraining any factor mean to 0 and any factor variance to 1 so that parameter estimates include item intercepts, item factor loadings, and item residual variances. Both models were estimated using mean/variance-adjusted weighted least squares estimation (specifically designed for ordinal data) in Mplus Version 6.1 (Muthén and Muthén 1998-2010).
As illustrated in Table 4, all items load highly (factor loadings > .7) onto a single factor in the single-factor solution and onto their respective latent factors in the two-factor solution. Further, as illustrated in Table 5, both models fit the data well. However, the two factors estimated in the two-dimensional model were very highly correlated (r=0.944), indicating that 89.1% of variance was shared between the two factors. This level of correlation was much higher than the correlation between the material and relational dimensions in our preliminary study (r=0.753, which equates to 56.7% shared variance). Further, as determined by the nested model comparison (χ2(1)=64.775, p<.001), restricting the model to two factors significantly worsens model fit. Given these limitations to the two-factor solution and the fact that the one-factor solution had a high level of internal consistency (Cronbach’s alpha of the results from the confirmatory factor analysis strongly suggest that a one-factor solution more accurately captures the underlying properties of the data: transportation insecurity is a unidimensional condition involving a range of material and relational manifestations. Conceptually, this is consistent with our qualitative observations: when individuals are unable to travel from place to place easily, they often experience both the material and relational manifestations.
Validity. To determine whether the revised unidimensional TSI16 distinguishes among groups we have observed, qualitatively, to have different levels of transportation insecurity, we compared the average unit-weighted TSI16 sum score among the various groups. Sum scores were generated by summing the numeric value associated with the responses to each of the 16 items (0=never, 1=sometimes, 2=often; observed and possible range: 0-32; weighted mean=2.5, SE=0.14). Group differences were determined based on the adjusted Wald test estimated after a weighted regression of the sum score on the group membership variable. As illustrated in Figure 2, our two hypotheses were confirmed. That is, mean transportation insecurity was lower among respondents thought to be likely secure than among the rest of the sample [1.01 vs. 3.22; F(1,1998)=86.07,[8] p<.001] and greater among respondents thought to be likely insecure than among the rest of the sample [12.57 vs. 2.17; F(1,1998)=56.05, p<.001]. These results indicate that the TSI16 distinguishes among respondents within a new sample as expected and in a manner consistent with our previous findings.
.png)
Discussion
Measurement development and validation is an ongoing process (DeVellis 2017). For example, refinements to the well-known Food Security Index, first developed in 1995, continue to this day (Coleman-Jensen 2015; Nord 2012). In this paper, we successfully replicated the desirable psychometric properties of a slightly modified TSI16 in a nationally representative sample and demonstrated that a one-factor solution best captures the underlying properties of transportation insecurity. This is an important step in further developing the TSI16, which we hope will be adopted by scholars across academic disciplines, policymakers, and planners and deepen our understanding of the relationship between transportation insecurity and poverty.
Our analysis also marks an important theoretical development. Scholars have long recognized that people who have problems with transportation often experience its material manifestations, for example, having to skip trips or enduring long commute times (Giuliano 2005; Kain and Meyer 1970; Ong and Blumenberg 1998); however, its relational manifestations are often overlooked or considered to be less important (but see Hamer 2011; Klein 2020; Lowe and Mosby 2016). Importantly, our analysis identifies a relational aspect of transportation insecurity and finds it to be an outgrowth of the same latent condition that causes material symptoms. Transportation insecurity is experienced materially and relationally; our measures should reflect this empirical reality.
Although validating the TSI16 is an important step, additional work remains. New data will need to be collected to determine how the TSI16 performs with other data collection modes and populations. We need to determine whether the current question ordering is most effective and whether priming questions affect responses. As our understanding of transportation insecurity and its measurement develops, topic- or population-specific modules could be considered.
As currently presented, the TSI16 is a continuous measure that conceptualizes transportation insecurity as occurring along a continuum—higher scores reflect greater insecurity (or less security) and lower scores reflect less insecurity (or greater security). Although this conceptualization is useful for many analytic inquiries, a categorical measure lends itself more readily to estimates of prevalence. Therefore, our most immediate next step is to identify cut points that will not only meaningfully differentiate between respondents experiencing transportation insecurity and those who are not but will also differentiate among transportation insecure respondents who are experiencing different levels of transportation insecurity (e.g., low, moderate, severe). In the interim, for those interested in using the TSI16, we recommend using a continuous weighted sum score.
Finally, recognizing that a 16-item measure is too long for inclusion in many surveys, we will be developing a short form TSI. We will also examine how the TSI performs compared to measures that are more commonly used in the social sciences (e.g., car ownership) by comparing their average marginal effects to that of the TSI.
Corresponding author information
Alexandra K. Murphy
Department of Sociology
University of Michigan
500 South State Street, Room 3115
Ann Arbor, MI 48109
734.763.6887
Acknowledgements
We are grateful to Mike Bader, David Pedulla, Karina McDonald-Lopez, and an anonymous reviewer at Survey Practice for their useful comments on earlier drafts of this paper. We thank Jeffrey Morenoff and Elisabeth Gerber for including our index questions on their Detroit Area Metropolitan Community Study (DMACS) survey so that we could conduct the split-ballot experiment described in this paper. We are also grateful to the following agencies whose financial support made this publication possible: the National Science Foundation (NSF) (OIA09936884); Stanford University’s Center on Poverty and Inequality (through funding provided by grant number H79AE000101 from the U.S. Department of Health and Human Services); and the University of Michigan’s Poverty Solutions, College of Literature, Arts, and Science, Office of Research, and Department of Sociology. Any opinions, findings, and conclusions or recommendations expressed in this material are those of the author(s) and do not necessarily reflect the views or official policies of the NSF or HHS.
For a discussion of this and other method biases, see Podsakoff et al. 2003.
These questions were adopted from existing surveys, including the Panel Study of Income Dynamics Main Interview and the National Household Travel Survey.
We selected this lower bound because we did not want our results to be affected by the unique transportation behaviors of college-aged young adults.
An oversample of adults with a household income at or below 100% of the federal poverty line was targeted using information that GfK had on file. Because household income is subject to fluctuation and because our index items have a 30-day reference period, we wanted to make sure that we screened people using current household income. Therefore, GfK agreed to re-administer their standard household size and income questions at the beginning of the survey. Any oversample panel members who did not meet the desired oversample threshold based on those survey responses were screened out.
For the purposes of measurement development, we identified a group of “likely insecure” respondents whom we are relatively confident experience transportation insecurity given their difficulty paying for transportation and other necessary expenses. However, our qualitative research shows that experiences of transportation insecurity fall along a continuum. Given that we classified 33.5% of our sample as “likely secure” and 3% as “likely insecure,” the majority of our respondents fall between these two extremes, some of whom are likely to experience some level of transportation insecurity. The percentage of “likely insecure” people who we identify thus represents the very lower bound of people experiencing transportation insecurity and is not an approximation of the prevalence of transportation insecurity in the United States.
The corrected item-scale correlation is the correlation between a single item and the remaining items in the scale.
Item wording of the most highly correlated items are as follows: (Q16) In the past 30 days, how often did you feel left out because you did not have the transportation you needed? (Q15) In the past 30 days, how often did you feel like friends, family, or neighbors were avoiding you because you needed help with transportation? Item wording of the least correlated items are as follows: (Q20) In the past 30 days, how often did you worry about inconveniencing your friends, family, or neighbors because you needed help with transportation? (Q5) To get to the places they need to go, people might walk, bike, take a bus, train or taxi, drive a car, or get a ride. In the past 30 days, how often were you late getting somewhere because of a problem with transportation?
Adjusted Wald test here and elsewhere.