Introduction
This article describes a new survey method to study media use.[1] The media landscape has changed vastly over time. Today, media content can be accessed by traditional mass media devices (e.g., radio, television), but also by computer, smartphone, and tablet. Moreover, these devices can be used for a variety of activities. For example, a smartphone serves as phone but can also be used to watch videos, listen to music, browse news, and so on. Such media convergence allows for a growing range of (parallel) activities. Due to these technological developments, media play a central role in many people’s daily routines, affecting all life domains. Therefore, it is both increasingly important and difficult to provide an accurate picture of media use. In our view, existing surveys are no longer suited to map the full scope of media use, which may result in misperceptions about its dynamics and effects.
Time diaries – in which respondents record their daily activities over a period of time – are a preferred measure to get reliable insight into people’s time allocation (Robinson and Godbey 1997). Other methods to measure time use are stylized questions (asking people how much time they spent on particular activities) and observational approaches (observing people’s activities instead of relying on self-report). Stylized questions are relatively inexpensive, but among its drawbacks are the overreporting of socially desirable activities, recall problems and neglect of activities that occur simultaneously. Observational studies are very accurate but tend to be intrusive and expensive (Ver Ploeg et al. 2000).
The Netherlands have a long tradition of time-use research using time diaries. The first representative time diary study dates back to 1953, focusing on radio use (CBS 1954). In 1970, the first general time-use study was conducted (Intomart 1970), including a broad range of activities such as work, personal care, and media use. Since 1975, the Netherlands Institute for Social Research (SCP) has commissioned a time-use study (TUS) every 5 years. In 2006, this research was aligned with the Harmonized European Time Use Survey (HETUS) guidelines (Eurostat 2009). For media use, the regular time-use study no longer suffices. First, the open coding method obstructs systematic details about media use. To illustrate, respondents could report Internet use, without specifying what they were doing (e.g., searching information, watching videos, visiting social network sites) and on which device (e.g., laptop, tablet, smartphone). Second, the survey allows a maximum of two activities per time interval, which precludes a thorough investigation of (media-)multitasking.
To overcome these issues, an innovative time-use survey (Media:Time) was designed by SCP, Netherlands Public Broadcasting, and the organizations responsible for audiences measurement services: Dutch Television Audience Measurement Service (SKO) for television, Research into Radio Listening Behavior of Dutch People (NLO) for radio and National Readership Survey in the Netherlands (NOM) for readership. This article primarily describes details of the survey design, but we also present a selection of data quality outcomes and main results.
Survey Design
The first wave of Media:Time was conducted among Dutch aged 13 years and older in the fall of 2013 as a follow-up survey to a readership survey that used a random probability sample (n=40,463) of not specifically named persons. Respondents from the readership survey who were willing to take part in future research (13,380 out of 17,494 respondents of the readership survey) were invited to participate in the Media:Time survey. Those who agreed (n=4,637) were asked to fill out a starting questionnaire. Respondents who completed this questionnaire (n=4,296) received a confirmation letter, instruction materials, and part of the response incentive (5 Euros gift voucher). They were asked to report at least 4 – but preferably all 7 – days of the week in the time diary, starting on a randomly assigned day. Those who completed the minimum of 4 diary days (n=2,989) received the remaining incentive (30 Euros gift voucher). In summary, the participation rate based on the invitees of the follow-up survey sample (i.e., respondents willing to participate in future research) was 22.3%, and the American Association for Public Opinion Research response rate 1 based on the original sample was 7.3%. To correct for a slight underrepresentation of lower educated people, males, and people without Internet access in the final sample, a weight factor was calculated for the analyses of media use.
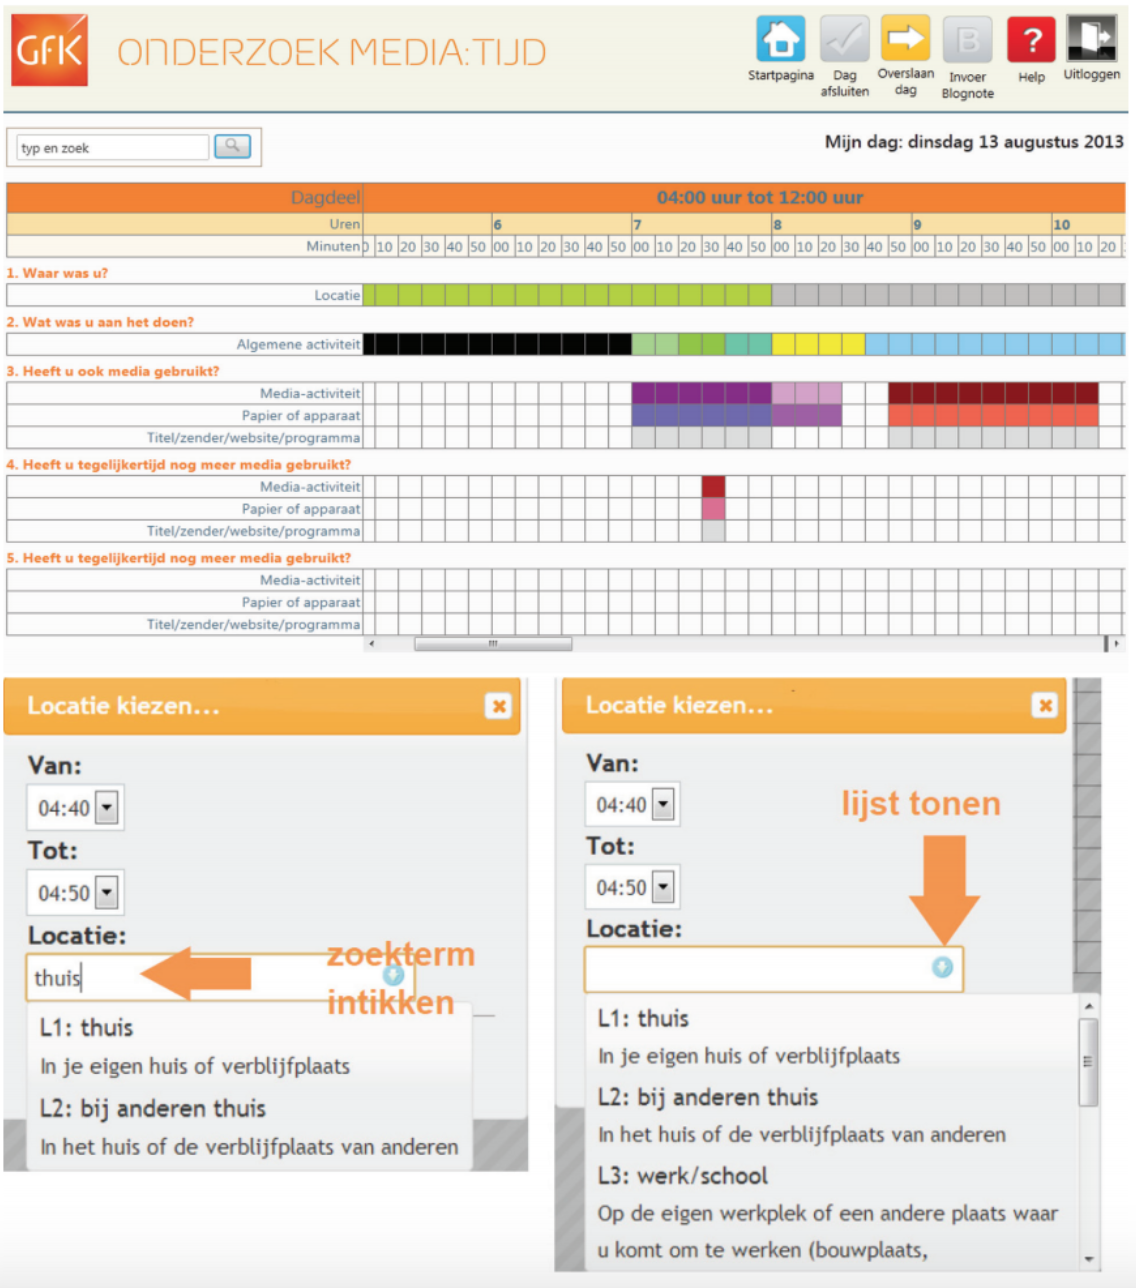
Respondents filled out their time-use in an online diary or were called by interviewers who filled out the online diary for them. The diary was pretested with 10 qualitative interviews and usability tests, after which the design was optimized (see Figure 1). The Media:Time diary consists of 10-minute intervals, for each of which respondents reported their location (at home, at other people’s home, somewhere else) and general activity (from a list of 35 activities, grouped in 10 overarching categories such as travel, personal care, and paid work). Furthermore, respondents could record up to 3 media activities per time interval.[2] For each media activity, they specified the type of activity (from a list of 31 activities, grouped in 7 overarching categories: listening, watching, reading, communicating, gaming, web browsing, and other) and the device (from a selection of 15 devices, such as smartphone, television, e-reader, but also paper). This results in a large number of unique combinations of activity and device.[3] For some media activities, details about the content were recorded (television program, radio station, newspaper/magazine title, website genre).
._after_selecting_a_time_frame__respondents_cou.png)
Translation bottom figure, left: Choose location. From: 04:40, Until 04:50. Location: Home (type search term). L1: home, in your own home or residence; L2: at other people’s home, in the home or residence of others.
Translation bottom figure, right: Choose location. From: 04:40, Until 04:50. Location: Home (show list); L1: home, in your own home or residence; L2: with other people, in the home or residence of others; L3: work/school, at your own workplace, or another place where you come to work (building area, […].
In comparison, the regular Dutch time-use survey (TUS) also uses 10-minute intervals, but in line with HETUS guidelines, respondents use their own words to describe their time use. Professional coders translate these descriptions into numeric codes of 10 overarching categories (e.g., personal care, education, mass media) that all have several lower-level category codes, which can be used only when the diary entries of respondents allow for such specification. TUS totals 35 media codes, but these do not all reflect unique media activities. The same activity receives a different code depending on mode or device (e.g., a phone conversation via a fixed line has a different code than via smartphone). Compared to TUS, Media:Time is better equipped to handle the complex media landscape. First, respondents can record 3 instead of 2 parallel media activities, and they provide more details about the type of activity, the device, and content. Second, due to the closed coding system, this level of detail is guaranteed across responses. Third, the number of unique media activity codes – in combination with the device used for the activity – far exceeds that of the regular time-use survey. Fourth, with data collection every 2 years, Media:Time keeps closer track of media developments than the TUS with its 5-year cycle.
Survey Evaluation
Of all respondents who started the time-use diary (n=4,296), nearly 70% completed the required minimum of 4 days (n=2,989) (see Table 1). A large majority (90%) filled out the diary online, while the remaining 10% were interviewed via telephone. The drop-out rate (starting the diary, but not finishing at least 4 days) was similar for online (31%) and offline participation (30%). Most offline respondents were interviewed for 4 days (93%) to reduce cost and effort, whereas 90% of online respondents followed the request to fill out 7 days.
The diaries were checked on two criteria: (1) the last entry should not have taken place 12 hours or longer before or 48 hours or longer after the day’s end, and (2) the number of general activities should not deviate more than 3 standard deviations from the mean. When both rules were violated on at least 1 day, cases were excluded from the dataset (n=34), as well as when diaries contained only one general activity on at least 2 days (n=8). A final dataset of n=2,947 remains, including 2,634 online and 313 offline respondents. There were 81% that filled out 7 diary days, with a quite even distribution across the weekdays (see Table 2).
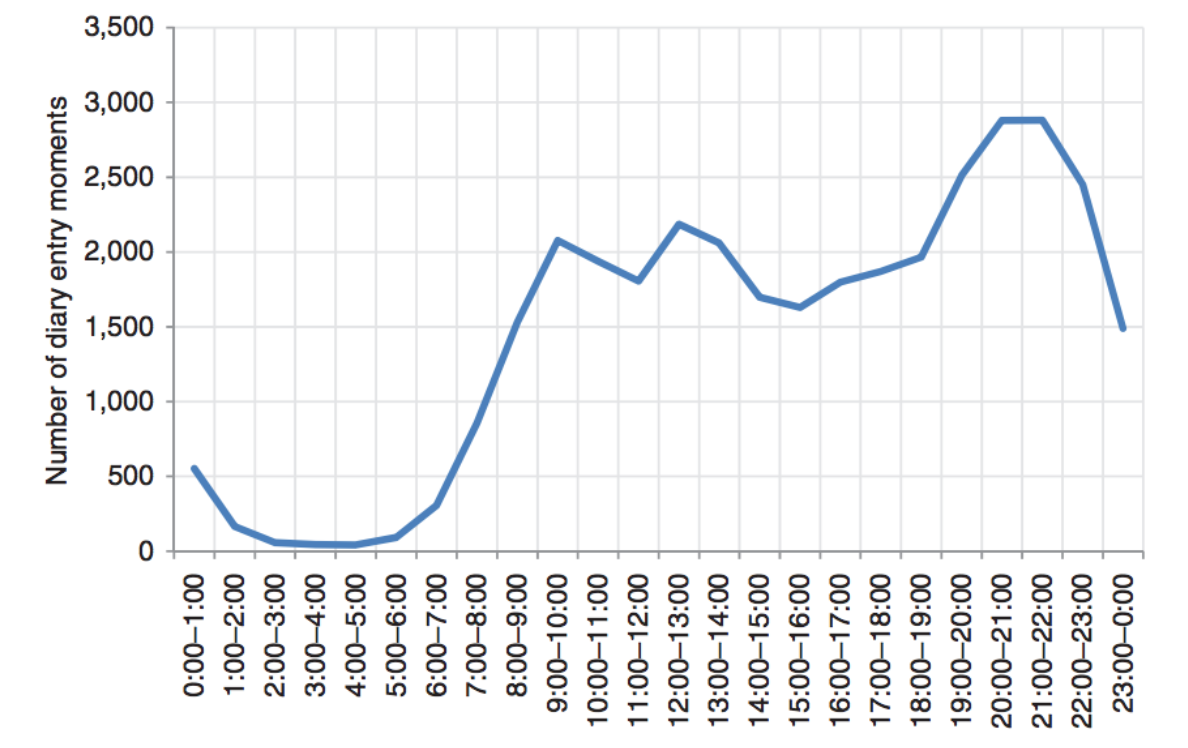
Ideally, respondents record activities shortly after they took place. The longer the delay, the higher the chance of memory problems. To prevent recall bias, respondents received a paper diary and access to a mobile application to take notes. Furthermore, the diary could be filled out online in real-time. Forty five percentage of online respondents (n=2,676) recorded a full diary day at once. As illustrated in Figure 2, most online diary recording occurred between 20:00 (8 pm) and 22:00 (10 pm), in mornings, and during lunchtime. On average, diary days were completed 16 hours after the diary day’s official end (04:00; 4 am), in the evening of the next day.
.png)
On average, the 2,989 respondents that completed 4–7 days reported 2.1 locations, 8.7 general activities, and 4.3 media activities per day. The average number of locations is the same for online (M=2.1; SD=0.5) and offline (M=2.1; SD=0.6) respondents. Most notably, offline respondents recorded significantly fewer media activities (M=4.0; SD=1.9) than online respondents (M=4.4; SD=2.4), whereas offline respondents recorded significantly more general activities (M=8.8; SD=2.1) than online respondents (M=8.6; SD=2.4). This is not surprising, since the telephone interviews were developed to include people who were not willing or able to fill out the diary online. Instead of data quality differences, this outcome likely reflects differences in time-use patterns of offline and online respondents.
Media Use Results
Here, a selection of results is presented that reflect the unique features of this new survey. To illustrate the additional advantage of Media:Time, we first describe media use from the perspective of the regular Dutch time-use survey (TUS) (see Table 3). In 2011, the total time spent on media (i.e., watching television, listening to audio/radio, reading print media, and using the computer/Internet) recorded in the TUS amounted to 2 hours and 59 minutes per day (Cloïn 2013). This is a conservative measure, because it only includes media as main activity and does not include mediated communication such as e-mail, chat, or phone. The total media time rises to 3 hours and 12 minutes per day when mediated communication as main activity is included. Media use as side or secondary activity counts for another 1 hour and 1 minute per day. In total, TUS records an average of 4 hours and 13 minutes spent on media per day.
Media:Time does not differentiate between main and side activities. Instead, people could report up to three parallel media activities (alongside another general activity). Furthermore, the survey includes an extensive list of potential media activities. As a result, the Media:Time survey captures more media behavior than the regular time-use surveys. On an average day, respondents recorded an average of 7 hours and 23 minutes of media use, exceeding the outcome of the regular time-use survey by more than 3 hours. This gap is mainly explained by above-described methodological differences. The main difference concerns the recording of (media-)multitasking (see Table 3). The Media:Time survey allows for a detailed investigation of parallel activities. Of the total media time, 2 hours and 52 minutes are spent on a single media activity (singletasking), such as watching television without performing another activity at the same time. For 4 hours and 30 minutes, media is use is combined with other activities. Of this combined media time, 3 hours and 25 minutes media use takes place alongside a general activity, for example watching television while eating (multitasking), and the remaining 1 hour and 6 minutes is spent on multiple simultaneous media activities (media-multitasking), such as watching television and e-mailing at the same time.
The closed coding system of Media:Time allows for a detailed outline of the media that people use. (For a complete report in Dutch with an English summary of the outcomes, see Sonck and Haan 2015.) Most of the media time is spent on watching and listening, followed by communicating, reading, and other Internet use. Note that the activity and the device on which the activity is performed are disentangled and can both be described at a high level of detail. For example, “watching” contains viewing television programs (at the moment of broadcasting, or at a later time), but also streaming videos or watching downloaded video content. When focusing on these underlying activities, an interesting picture emerges: traditional media activities still dominate. For example, television and radio programs are accessed primarily at the time of broadcasting. The same picture emerges for media devices. Television is by far the most popular watching device, whereas paper is still preferred for reading. Mobile devices are upcoming for accessing audio, but they do not (yet) exceed the use of fixed radio and audio sets.
Conclusion
This article aims to demonstrate how today’s complex media use can be measured by means of an adapted time diary method. By using a closed coding system, allowing the recording of up to three media activities per time interval, and measuring the type of media device and content, a detailed picture of people’s media use can be provided. The results allow for a study of different types of activities, and media singletasking or multitasking behavior.
The survey is quite demanding and the overall response rate relatively low. Still, a majority of respondents who started the survey continued to complete the minimum of 4 diary days. Importantly, the evaluation shows that the survey can be completed both online and offline. To conclude, with this innovative time-use survey, we can present a more comprehensive and yet more detailed account of today’s media use.
Acknowledgments
The authors would like to thank all collaborating parties: the Netherlands Institute for Social Research (SCP), the Netherlands Public Broadcasting (NPO), the Dutch Television Audience Measurement Service (SKO), Research into Radio Listening Behavior of Dutch People (NLO), and the National Readership Survey in The Netherlands (NOM), as well as the Foundation for Internet Advertisement that was part of the initial collaboration but ceased to exist. We would like to thank GfK Market Research (GfK) for conducting the survey.
In this article, we use a broad definition of media use, including all media and communication activities that involve a media device, such as a television, computer, smartphone or tablet, but also paper as a device for newspaper and magazine reading.
No distinction was made between main and side activities, because media activities are often performed side by side other (general or media) activities, without a clear hierarchy in main and secondary activity.
Theoretically, there are 465 unique activity-device combinations (31 media activities multiplied by 15 devices), but in reality, this number is somewhat lower, because not all devices are applicable to all activities.