Introduction
Since the advent of the Internet in the 1980s, its use has become exponentially more popular within the United States and across the globe (Leiner et al. 2016). Documentation provided by the U.S. Census Bureau stated that the households with computer ownership increased from 8.2% in 1984 to 83.8% in 2013 (File and Ryan 2014). Elsewhere around the globe, the median computer ownership was 38% with most developed countries well over 50% while developing countries averaged 25% or less (Pew Research Center 2016). Among U.S. households, 18% used the Internet in 1997, but by 2013, this percentage has grown to 74.4, with 73.4% reporting they had accessed via a high-speed connection (File and Ryan 2014). Across the globe, the average portion of the population using the Internet was 46.4% in 2015 with North America having the highest population penetration (87.9%) and Africa the lowest (28.6%). Between 2000 and 2015, global Internet use has grown 832.5% (Internet World Stats 2016). Email has enjoyed steady growth, with an annual growth rate in email account holders of 6% from 2013 to present. Daily email traffic has also risen significantly from 182.9 billion in 2013 to a projected 201.4 billion in 2016 (Radacati and Levenstein 2013). The use of the Internet and email has become ubiquitous among groups of individuals often sought in survey research such as students, employed persons, employment groups/memberships (Dillman, Smyth, and Christian 2008).
This proliferation of Internet access and use has driven researchers to leverage the widespread availability of potential respondents from this population. The ease of use and low cost of Internet access, as well as dynamic available technologies, has brought forth a rapid rise of the use of electronic means in survey research. Although marketing firms have quickly adopted online means for conducting a variety of surveys, polling companies, agencies, and academic researchers have also been quick to utilized such methods (Fan and Yan 2010; Feinberg, Kinnear, and Taylor 2013; Ison 2010). As a result of this escalation in use, there has been a significant amount of effort put forth by marketing firms and research literature investigating the advantages and disadvantages of pursuing respondents online and how to maximize response rates (Fan and Yan 2010; Nulty 2008).
While the Internet and email have given researchers unprecedented access to a broad survey audience simultaneously, there has been a momentous increase in malicious and unwanted email traffic. These undesired messages often referred to as “spam,” are problematic for a variety of reasons such as deception of readers, the inclusion of offensive materials, reduced productivity, server speed degradation, consumption of computing power and memory, and the slowing of Internet transaction speeds. As such, significant effort has been employed to reduce the burden of spam by email providers, Internet users, and corporate or institutional technology stakeholders (Attar, Rad, and Atani 2013; Caruana and Li 2012; Ison 2010). As is evident upon occasionally checking one’s spam folder, there are times when spam protection systems are overly cautious. Thus, there are times when legitimate messages are erroneously blocked with some email arrangements never allowing users to see or access such emails. It is therefore possible, if not likely, that survey prompts sent via email could never reach the intended sample. Because surveys rely on favorable response rates and online surveys typically have lower response rates than other methods of research (e.g., telephone or paper), each and every response that researchers can collect becomes ever more critical. Unfortunately, little research exists on the potential problem of spam filtration as a barrier to response. Moreover, even less has been explored on how to mitigate the potential for nonresponse at the hands of email protection systems or how to best avoid such conundrums (Sauermann and Roach 2013; Schoenherr, Ellram, and Tate 2015).
The purpose of this research was to identify potential obstacles to online survey delivery from a spam filtration perspective so that researchers can take actions to avoid such preventable limitations. Ex post facto analysis of survey response from a study on higher education faculty is provided as an example of how response rate can be effectively improved if researchers are proactive in delivery method and design. Also, a priori spam testing software is presented to assist in the reduction of nonresponse risk so that researchers can reduce the chance of their survey ending up being labeled as spam. Data indicated in this study shows that researchers can ensure that their survey reaches the most individuals through response monitoring, careful email construction, and certain delivery techniques.
Method
This study outlines an example case in which spam filtration significantly impeded delivery of a survey and the tact the researcher utilized to circumvent the issue to boost response rate. This is illustrated by ex post facto analysis of the process. Additional examples of a priori email testing procedures to minimize spam scores to potentially augment the efficacy of survey requests in research are provided.
Participants
The original research from which this example has been extracted was a survey of full-time higher education faculty members. The research essentially was a census of faculty who were members of a specialized membership organization. A total of 329 faculty were initially culled from the membership list. Those who had left their position or who were part-time faculty were removed, leaving a total of 293 individuals. The email testing portion of this research outlines examples that were from the aforementioned research, a sample drawn from an online spam message database, an example created by this researcher.
Procedure
A survey was created using the Survey Monkey platform and was delivered via the automated email distribution system of the provider. To maximize response rates, the tailored approach advocated by Dillman, Smyth, and Christian (2008) was utilized (e.g., multiple contacts). The first message was sent about a week before the survey distribution to inform potential respondents that a survey request was pending. A second message was sent which included a link to the survey embedded in the message (see Appendix A). Following the distribution of the survey, it became immediately apparent that one particular institution with a large percentage of potential respondents had a suspiciously low response rate. Contact was made with three colleagues known to the researcher about the status of the email. These individuals noted that the message had ended up in their junk folder which few at the institution viewed.
As a result, and through consultation of the literature on spam filtration, a specialized email request was generated and sent (see Appendix B) (Brown 2007; Mail Chimp 2016; Qualtrics 2016). Within it was a URL for a new website, created specifically for those who previously did not respond, which would direct them to the survey. The link to the survey was inactive (i.e., there was no hyperlink embedded). A password was created to prevent unauthorized respondents. Each email was manually personalized and sent individually so as not to trigger filtration.
For the email testing portion of this research, a series of example emails were analyzed by two available online spam testing systems. These examples show the impact of various types of suspicious content that should be avoided or minimized in survey requests.
Results
The primary survey request was sent to the 293 individuals identified to be qualified to take the survey. Among these, 83 (28.3%) appeared to be blocked or filtered even though none of these were returned (i.e., bounced) nor were there any other indications made known to the researcher. The majority of nonresponse was isolated to a specific institution, leading to suspected email blockage. This fact was confirmed through contact made with individuals at the institution at which most of these lost emails were sent. The addresses that were suspected to be blocked were recontacted following the special procedure outlined previously (individualized emails and expressly designed email). From this second contact, 69 (83.1% of the recipients suspected of being blocked) responded. At the closing of the survey, there were 193 (65.6%) usable responses. Without the special intervention, the response rate would have been 42.3%.
The original email (Appendix A) was tested using Isnotspam (2017) and Mail Tester (2016) free online spam checking software. These filters were chosen due to their easy use and availability. More sophisticated proprietary options (e.g., Mail Chimp or Litmus) are available and would be recommended for larger or higher stakes survey evaluation. This message was identified as spam (legitimate) by both checks. With Isnotspam, the system runs a series of tests, totaling scores to gauge suspicious content, with scores closer to 10 being marked as likely spam. The first message was deemed legitimate with a score of 4.7. In Mail Tester, it received a spam score of 7.5/10 which is passable, but with some issues. Some of the problems identified during the testing were that the message contained HTML, that freemail was used (in this case Gmail), the IP address was blacklisted in the CASA-CBLPLUS IP listing (one of 22 common blacklists), and both systems showed some level of mistrust based on a Bayesian filter (means of determining probabiliy a message is spam). Scores were affected positively by valid DomainKeys Identified Email (DKIM) or DomainKeys (DK) signatures from author domain (these prevent forged sender email addresses which are typically added by legitimate email servers/providers) and that the sender URL was whitelisted (meaning it is a verified, trusted site and occurs at the specific request of or agreement with the sender).
The second email (Appendix B) was tested using the same two systems. With Isnotspam, the message received a score of 3.2. In Mail Tester, it received an excellent score of 9/10, likely because the reduction in embedded HTML content.
Next, a typical spam message extracted from Antespam.co.uk (n.d.) which advertised for adult entertainment services. While the message passed both testing systems, it clearly received a higher spam suspicion rating in Isnotspam (8.8) and a score of 0/10 in Mail Tester. Last, an egregious example of possible spam attributes was created with an all caps subject, overuse of exclamation points, references to money and pharmaceuticals, an image, and replacement of letters with numbers in one word. This message received a 9.4 score in Isnotspam while Mail Tester gave a score of 1.2/10. Both tests indicate that the message was unlikely to bypass a spam filter. The worst offenders, according to Spam Assassin (an embedded test), were the references to pharmaceuticals (−2.221) and the subject being in all caps (−1.625). Also, obfuscation of words was noted as a deficiency (−2.24).
Discussion
While the exact reason why the original email did not make it to planned participants, evidence from the literature indicates that it may likely have been due to tripping the spam filter of the particular institution where most recipients failed to respond. The likelihood of this was confirmed by the fact that, upon checking the spam folder, the invitation was discovered. Some reasons why the message was labeled as spam can be gleaned from the spam tests, especially the one noting a difference in “trustworthiness” between the original and improved email. Researchers should aim for the best possible scores and send test messages, if feasible. This type of situation brings to light the importance of intelligent response monitoring in that researchers pay close attention to patterns in replies and make adjustments as necessary. Moreover, any suspected anomalies must be quickly investigated to maximize response rate. This brings into question any online research with low response rates as one has to wonder if the researchers took into account the technological barriers that may exist to properly ensure that emails are, in fact, delivered. It also is apparent that it is important to test messages as thoroughly as possible using multiple testing platforms, altering the email message as needed, to seek the lowest possible level of spam suspicion. It is important to note that while available tests may be helpful, their utility is maximized if the message is sent exactly how the research intends to send the message (i.e., through Survey Monkey or another platform). This can confirm that the sending system or server is not problematic or if large to address lists that may trigger spam filtration.
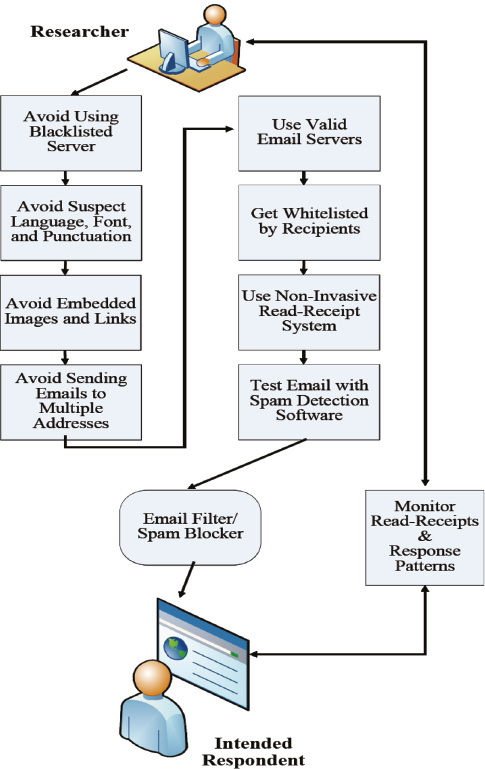
These findings along with the outlined literature advocate for a proactive design, planning, and delivery process in which researchers carefully craft the entire survey process to maximize response rates. A recommended nonresponse mitigation system is presented in Figure 1. This process specifies the necessary steps to avoid research requests from being labeled spam.
.__http___www.radicati.c.jpg)
Ideally, you should get whitelisted by your recipient, although this may be impractical in many cases, this could potentially be helpful in cases of surveying a large number of individuals at a specific company or institution. To ensure that a researcher can actually know who receives and reads messages, they may wish to include a nonintrusive received/read receipt tool. It would be wise to perform a test of the arrangement through spam testing. Of course, when the researcher is at a point when he or she is ready to send his or her message, multiple spam tests using a variety of available testing tools should be conducted. This should eliminate any surprises when it comes to survey distribution. Last, the researcher must monitor the read-receipt and response patterns. Problems with survey delivery can typically be identified relatively quickly, though, in some cases, a deeper inspection of response patterns may be necessary to hone in on the source of the defect.
Conclusion
This study sought to provide insight into methods to reduce survey nonresponse that is controllable and can be influenced by researchers. If researchers do not undertake careful, considerate plans to conduct surveys, they may end up with low response rates, hampering the validity, quality, and utility of findings. Especially because online surveys typically have lower response rates compared to other methods and that these rates appear to be getting smaller due to survey fatigue or other reasons, it is more important than ever that researchers take every action possible to retain reasonable response rates.
While, in general, there is a shortage of literature on how to manage nonresponse regarding email delivery barriers, this study provided substantial guidance on how to minimize or avoid the pitfalls that can occur in online survey research that are mostly or entirely in control of the researcher. In an era where online survey research continues to become more popularized, it is necessary for researchers to exploit available guidance and tools to evaluate the consequences of choices made during the survey design and delivery process. Armed with this critical information, such as that presented in this study, researchers can avoid difficulties common in survey research as a result of careless or flawed email construction and distribution.
Appendix A

Department of Educational Administration
141 Teacher College Hall
Lincoln, NE 68588
DATE, YEAR
Joe Pilot
700 Airport Road
Auburn, AL 36830
Dear Dr. Pilot,
I am writing as a fellow aviation faculty member to ask for your assistance in a dissertation study of aviation faculty members. This study seeks to learn more about the career and educational pathways that have led such faculty to the aviation professoriate.
I am contacting aviation faculty teaching at four-year University Aviation Association (UAA) member schools. It is my understanding that you are a member of this cohort.
Because little research has been conducted specifically on aviation faculty such as ourselves, the results of this study will provide critical insights into who aviation faculty are and how they make their way into academics. This study aims to provide a comprehensive analysis of the characteristics and career paths of aviation postsecondary faculty.
Please be assured that your responses will be kept confidential. The final results of this survey will be a summary of findings in which no individual responses will be identifiable.
Your participation in this survey is voluntary. However, it would be extremely beneficial if you could share your experiences about your path into the aviation professoriate. If you do not want to participate, please respond via email stating that you would like to abstain from completing the survey.
To enter the survey please click on the following link: http://surveymonkeylink
If you should have any questions or comments about this study, I would be very interested in talking to you. Please do not hesitate to write to the address on the letterhead above, call XXXX or email link.
Thank you very much for participating in this important study.
Sincerely,
Appendix B
University of Nebraska - Lincoln
Department of Educational Administration
141 Teacher College Hall
Lincoln, NE 68588
Dear Professor Pilot,
About two weeks ago you received an email about an upcoming aviation faculty survey. This survey was sent out Monday of last week. Unfortunately, some university/college email systems treated the message as Spam and/or placed it in a Junk folder.
I truly need your assistance in completing this survey. Your inputs are highly valued. Therefore I can offer several options to take the survey if you are interested in helping further research on aviation faculty like you and I.
Option 1:
Go to www.aviationfacultysurvey.com
This site has a link to the survey.
The password to enter the survey is 4321.
Option 2:
I can make an appointment to call you and we can complete the survey on the phone.
Please reply to this email if you would like to take the survey in this manner.
Option 3:
I can mail you a paper copy for you to complete at your leisure.
Please reply to this email if you would like to take the survey in this manner.
Thank you so much for your time! I look forward to receiving your inputs and responses.
If you have any questions, feel free to reply to this email.
Sincerely,