


Introduction
Background
With the decrease in the use of landline numbers among young persons and minorities and the increase use of cellphones by these populations (Blumberg et al. 2013; Lu et al. 2014), dual-frame designs that utilize both the landline and cellphone frames are essential. However, cellphones must be dialed manually, which increases the cost of completing cellphone interviews. Until recently, most dual-frame surveys allocated a small proportion of the total sample to the cellphone frame in order to minimize costs while ensuring full coverage of the target population (see e.g., California Health Interview Survey 2014; Ohio Medicaid Assessment Survey 2012). Yet, as key demographic groups shift more to cellphone only use the need to increase the allocation to the cellphone frame has become essential (Lu et al. 2014; Peytchev and Neely 2013).
With surveys increasing the proportion of interviews coming from the cellphone frame, the sample vendors – Market Systems Group (MSG) and Survey Sampling International (SSI) – have developed pre-field screening services to identify cellphone numbers that are active at the time the sample is drawn. For example, MSG has developed cellular working identification number service (Cell-WINS) which classifies a cellphone number as active (i.e., currently a number being used) inactive (i.e., a nonworking number); or unknown activity status (i.e., had previously been identified as working, but no activity has been observed in the past few months) (Dutwin and Malarek 2014). The Cell-WINS activity flag is based on a proprietary algorithm developed by MSG which examines billing and usage data to determine the status of the number. Similarly, SSI has developed the Wireless Phone Activity Flag. Like Cell-WINS, this flag assigns cellphones into three categories: active, previously active, and inactive/unassigned. In this paper, we focus on the accuracy of the MSG Cell-WINS status flag.
Motivation
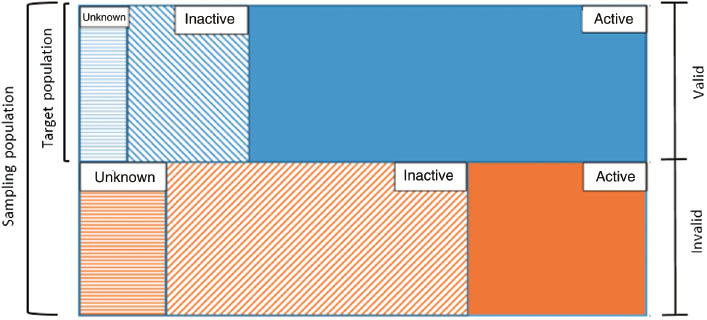
Screening landline numbers to determine whether the number is assigned and working has been done for years and relies on automated dialing equipment and telephone contact signal processing. This approach is not available for cellphone screening because of limitations in the Telephone Consumer Protection Act of 1991. While new activity flags based on billing and usage data hold promise to mimic the screening process used on the landline frame, they have not been fully vetted, and the consistency across geographic areas, even with a single state, is not fully known. The sampling population for a cellphone frame consists of all 1,000-blocks assigned to cellphone exchanges. Within a 1,000-block, a telephone number can be valid or invalid. Invalid telephone numbers consist of nonworking or otherwise inactive telephone numbers. The inclusion of invalid telephone numbers in the sampling population can greatly increase data collection costs since each cellphone number needs to be manually dialed. If an activity flag is accurate, it can greatly reduce data collection costs without introducing coverage bias. Figure 1 illustrates the potential relationship between the vendor activity flags (e.g., Cell-WINS active, inactive, or unknown) and the actual status of a telephone number (valid or invalid) in the sampling population. If the vendor flags are accurate, then the set of valid numbers (i.e., target population) would consist of vendor identified active numbers while the invalid set of numbers would consist of vendor identified inactive numbers. However, the vendor flags are likely not perfectly accurate and therefore vendor flag inactive numbers belong in the set of valid cellphone numbers and vendor flag active numbers belong in the set of invalid cellphone numbers. This is the situation depicted in Figure 1.

If the Cell-WINS status accurately identifies invalid cellphone numbers, then (1) data collection costs can be greatly reduced by excluding Cell-WINS inactive numbers, and (2) the sampling population consisting of telephone numbers identified as Cell-WINS active will accurately identify the target population because all active numbers are included in the sampling population. However, if Cell-WINS is not accurate, its use may cause serious coverage bias issues.
Study Purpose
In this paper, we have two main goals:
- Assess the accuracy of the MSG Cell-WINS flag in the state of Ohio and determine if the accuracy differs by population density of an area
- Determine the cost efficiency of the flag whereby assessing if the cost of purchasing the flag is worth the loss in coverage
Through these goals, we build on the Dutwin and Malarek (2014) paper by determining if the under coverage rates differ across metropolitan, suburban, and urban counties. Moreover, we assess if the cost efficiencies found by Dutwin and Malarek are similar in our study.
Methods
Experimental Design
In order to assess the MSG Cell-WINS flag, an experiment was incorporated into the 2015 Ohio Medicaid Assessment Survey (OMAS). OMAS is a periodic survey of residents in the state of Ohio measuring the rate of health insurance coverage among adults and children and access that each have to medical services. Because these outcomes of interest vary across the state, it is important that any method introduced to reduce data collection costs does not disproportionately impact one part of the state more than another.
Under the experiment, a random sample of 372 cellphone sample replicates (approximately 18,500 telephone numbers) were selected. In order to not disproportionately select replicates in more urban areas, the experiment sample was stratified by county type. In Ohio, county type is a county classification that classifies a county as predominantly metropolitan, suburban, rural non-Appalachian, or rural Appalachian. Because county type is based on the population density within the county, the counties within the same county type are not necessarily contiguous. Based on this design, 75 of the 88 counties had at least one replicate (approximately 50 cellphone numbers) in the experiment.
Once selected, the telephone numbers from the replicates included in the experiment were sent to MSG to have their Cell-WINS flag assigned. This assignment was made as close to the start of data collection as possible in order to ensure maximum accuracy of the Cell-WINS assignment. Figure 2 presents the activity status of the sampled numbers by county type. The percentage of number assigned to each Cell-WINS classification varies across area type. For example, the range of telephone numbers assigned as inactive is 24.8 percent (rural Appalachian) to 36.6 percent (suburban).

Once the Cell-WINS status was assigned to each number, all telephone numbers, regardless of activity status, were released to the field. Each replicate was fully worked to completion. This included at least five call attempts to each telephone number (unless the disposition was finalized sooner). The field period for the experiment replicates went from December 2014 to February 2015.
Once finalized the final disposition status of each number was categorized into valid or nonworking/invalid. Valid numbers included any number that connected to a person regardless of response status. Nonworking or invalid numbers included any number that appeared to be nonworking including ring-no-answer telephone numbers and disconnected numbers.
Analysis Methods
Assessing Accuracy
To assess accuracy of the Cell-WINS flag assignment the cross-classification of the Cell-WINS assignment and the final disposition assignment was compared. Within each Cell-WINS type (active, inactive, and unknown), the number of valid and non-working/invalid numbers was determined using the final disposition obtained during data collection. Using these counts, the inaccuracy rate (IR) was determined for each Cell-WINS type using the formula:
IRj=NINC+NI
for j = i, a, or u representing inactive, active, and unknown, respectively; where NI is the number of telephone numbers incorrectly assigned (e.g., Cell-WINS assignment as inactive, but with a final disposition of valid) and NC is the number of telephone numbers correctly assigned. For Cell-WINS inactive numbers, the IRi represents the proportion of Cell-WINS assigned inactive numbers that are valid (i.e., a part of the target population). For Cell-WINS active numbers, the IRa and IRu represents the proportion of Cell-WINS assigned active and unknown telephone numbers, respectively, that are invalid (i.e., a part of the sampling population, but not a part of the target population).
The under coverage rate (UCR) due to excluding Cell-WINS inactive telephone numbers and over coverage rate (OCR) due to the inaccuracy of Cell-WINS active numbers (excluding the Cell-WINS inactive numbers) were then calculated using the IR for inactive numbers using the formulas:
UCR=Ni×IRiNi×IRi+Na×(1−IRa)+Nu×(1−IRu)
and
OCR=Na×IRa+Nu×IRuNa+Nu
To determine whether the under coverage rate varied by geographic area, the under coverage rates were calculated by county type and Medicaid region. Bivariate tests (i.e., t-tests) were conducted to determine if the under coverage rate due to excluding inactive numbers varied by geographic area within the state of Ohio.
Cost Efficiency
To determine the cost efficiency of excluding Cell-WINS inactive telephone numbers, a cost efficiency model was developed taking into account the cost of purchasing the Cell-WINS status flags and the cost of calling inactive assigned telephone numbers. The cost efficiency model was defined as:
CECW=CCWDCT+DCT−I−DCTDCT
where CECW is the net percent cost efficiency of removing the Cell-WINS inactive telephone numbers relative to total data collection costs, CCW is the cost of purchasing the Cell-WINS status flag for all sampled telephone numbers, DCT is the total data collection cost when all telephone numbers including the inactive assigned numbers are fielded, and DCT−I is the data collection costs when the Cell-WINS assigned inactive cases are excluded (i.e., as if not fielded). Under this formula, when CECW is a negative percentage then excluding the Cell-WINS assigned inactive numbers increases the cost efficiency (i.e., the data collection costs saved due to calling fewer telephone numbers outweighs the cost of purchasing the flag assignments) of the study while a positive percentage decreases the cost efficiency.
Results
Accuracy of Cell-WINS Flag
Assessing Overall Accuracy
To assess the overall accuracy of the Cell-WINS flag, the Cell-WINS activity status was compared to the final disposition in order to examine any inconsistencies between the two assignments. Figure 3 presents the final disposition status by Cell-WINS assignment. Overall, the large majority of numbers flagged as inactive by Cell-WINS were truly non-working or invalid numbers with an inaccuracy rate of 3.7 percent. However, 32.3 percent of Cell-WINS assigned active numbers were deemed to have a non-working or invalid final disposition. While Cell-WINS unknown made up a small proportion of the sampled numbers, they predominately ended up being non-working or invalid numbers with an inaccuracy rate of 96.4 percent.

Coverage Rates
The amount of under coverage incurred as a result of excluding telephone numbers identified as inactive was determined to be minimal with an overall rate of 2.4 percent. This finding is in-line with the findings of Dutwin and Malarek (2014) which found an under coverage rate between 5 percent and 6 percent nationally. Conversely, the amount of over coverage incurred among telephone numbers identified as active was 36.1 percent.
The under coverage rates were further examined by county type and Medicaid region in order to assess the consistency in the level of the accuracy of the Cell-WINS flag. Figure 4 presents the under coverage rate when telephone numbers flagged inactive by Cell-WINS are excluded by county type. The largest amount of under coverage incurred due to the exclusion occurred in rural Appalachian with an under coverage rate or 3.7 percent. This under coverage rate was statistically significantly different from all other county types (metro, rural Non-Appalachian, suburban) at the 95 percent confidence level. One potential cause for the increased inaccuracy rate in rural Appalachia is a higher propensity of prepaid cellphone users. Berzofsky et al. (2015) found that in rural Appalachia a significantly higher proportion of cellphone users were on prepaid plan. In contrast, in the metro and suburban county types, a significantly higher proportion of cellphone users were not prepaid which may partially explain the lower under coverage rates. Therefore, it is possible that Cell-WINS is not changing the status of newly activated prepaid telephone numbers at the same rate new telephone numbers are being activated.

Cost Efficiency
Among the experiment replicates, 108,000 call attempts were made. Of those call attempts, 15,009 were made to numbers flagged as inactive by Cell-WINS. Had these inactive cases been removed prior to data collection, the data collection cost associated with attempting to call these numbers would decrease by 13.9 percent. However, there was an additional 1.9 percent increase in the cost of data collection in order to obtain the Cell-WINS activity flag. Using the cost efficiency model presented in “Cost Efficiency” section, the percent cost efficiency was determined to be −12 percent, indicating removing the inactive cases prior to data collection reduces the data collection cost by 12 percent. This finding is less than the 20 percent reduction in data collection costs that Dutwin and Malarek (2014) found.
CECW=1.9%+(−13.9%)=−12%
Conclusions
After addressing our research questions, we attempted to compare the demographic characteristics of respondents with a Cell-WINS inactive status to respondents with a Cell-WINS active status to determine if there were any differences. While there did not appear to be any, the sample size of respondents among numbers assigned as Cell-WINS inactive was too small to make credible statistical comparisons. (The percentage of Cell-WINS inactive status numbers that led to a completed interview was only 4.2 percent.) Therefore, in the absence of any differences in the respondent characteristics, based on the results of our experiment, the trade-off of an overall under coverage rate of 2.4 percent for an increased cost efficiency of 12 percent was deemed acceptable.
Our findings found that the MSG Cell-WINS activity status yielded a lower under coverage rate than what Dutwin and Malarek (2014) found nationally (2.4 percent vs. 5 percent). That said, our paper was able to show that these under coverage rates are not consistent across county type. More rural counties have higher under coverage rates than more metro and suburban counties. Furthermore, while our study found Cell-WINS to improve cost efficiency, the gains were not as great as the 20 percent gains found by Dutwin and Malarek.
While we believe that the Cell-WINS flag proved accurate enough for Ohio, it is important to note that, just as the flag accuracy varied within Ohio, it could vary in different parts of the county. Therefore, we recommend a similar type of experiment be conducted in the geographic area of interest prior to excluding Cell-WINS assigned inactive telephone numbers. Furthermore, additional research could be conducted to determine if the characteristics of persons with a Cell-WINS inactive assigned telephone number are different from persons with a Cell-WINS active assigned telephone number.