Introduction
Inviting survey participants through emails is one of the most widely used methods in data collection. Several studies have tested different ways of drafting the email in order to maximize the survey response rate. An earlier study examined the impact of personalization, the email address of the sender, the authority of the email signatory, and the profile of the requesting office on response rate and found that none of them had significant impact (Porter and Whitcomb 2003). In another study, however, personalization was shown to improve the email click rate and completion rate (Heerwegh 2005). Another study by Whitcomb and Porter examined the impact of background color (white vs. black) and the use of header (simple vs. complex) and found that a white background and simple header had higher response rates than other conditions (Whitcomb and Porter 2004). Mentioning the purpose of an email (requesting for survey participation) and the sponsor of the survey in the email subject line also had an impact on survey participation (Porter and Whitcomb 2005). Several other factors, including the length of the email, placement of the URL, and the estimated time of the survey, have also been explored in survey experiments in order to improve survey participation and response rate (Kaplowitz et al. 2012; Keusch 2012; Trouteaud 2004).
In this study, we report findings from a web survey experiment on a new design feature for email invitations. As described below, we included the first questions of the survey inside the email invitation we sent out to the survey participants. We evaluated the success of the experiment on several matrices, including email click rate, completion rate, and response to the first question.
Methods
The experiment was conducted using the SurveyMonkey platform and among a group of SurveyMonkey customers who agreed to participate in research projects and provided their email addresses. In total, some 8,876 emails were sent to invite customers to participate in a research project (i.e., responding to a survey) on July 27, 2016. A reminder was sent out four days after the initial invite. The content of the reminder was identical to the initial email. The survey was closed on August 8, 2016. An identical survey was sent out to all participants. The survey contained 13 questions, asking about customers’ experience with the survey platform, satisfaction, and additional features.
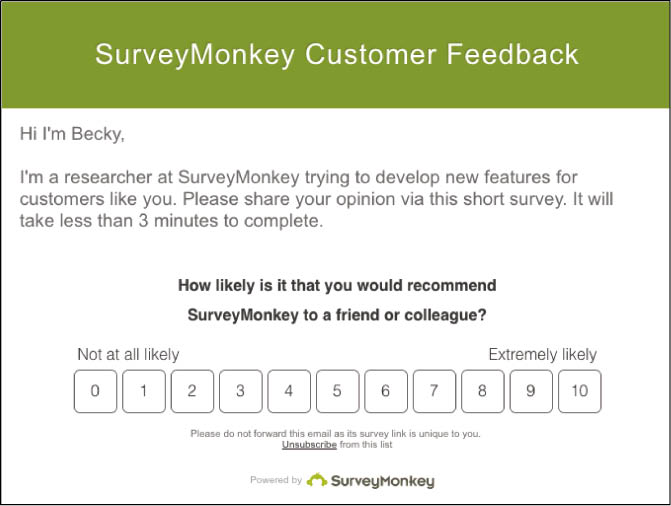
The participants were randomly assigned to one of two email conditions. In Condition 1, the email started with a short message requesting participation in a customer feedback survey (Figure 1). Immediately following the message, the first question was also presented in the email. The question asked “How likely is it that you would recommend SurveyMonkey to a friend or colleague?” using a scale of 0 (Not at all likely) to 10 (Extremely likely). The question is usually referred to as a Net Promoter Score (NPS) (Reichfield 2010). By clicking on one of the answer options, respondents would be directed to the survey webpage, with the answer to the NPS questions registered already.

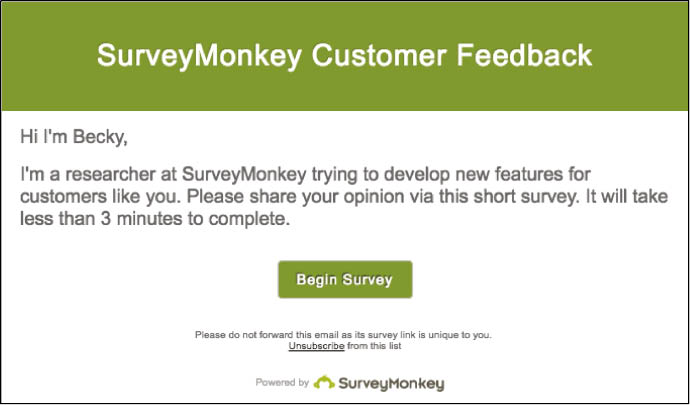
Condition 2 is the standard email invite (Figure 2) with the same short message as Condition 1. However, the NPS question was not included in the email invite. Instead, the respondents had to click on the “Begin survey” button to start the survey on the survey webpage.

Results
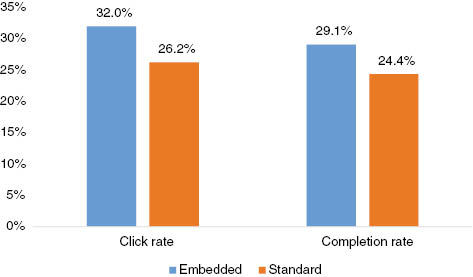
For the embedded email condition, 4,436 emails were sent and 103 of them were invalid (opted out or bounced), which resulted in 4,333 valid emails. For the standard condition, 4,440 emails were sent and among them 93 were invalid. As a result, there were 4,347 valid emails for this condition. As Figure 3 shows, the email invite click rate for the embedded condition was 32.0 percent and for the standard condition it was 26.2 percent, and the difference was statistically significant (t=5.93, p<0.001). This means that the respondents in the embedded condition were much more likely to click on the embedded question and start the survey than the respondents in the standard condition to click on the “Begin survey” button.

Figure 3 also shows the final completion rate for the two conditions. The completion rate for the embedded condition was 29.1 percent, significantly higher than the completion rate for the standard condition, which was 24.4 percent (t=4.99, p<0.001).
In addition, we also examined the completion rate among those who clicked on the survey email invite and started the survey. The rates for the embedded and standard conditions were 90.8 percent and 92.8 percent, respectively (t=1.78, p=0.07). This means that about 2 percentage points of respondents in the embedded condition were more likely to drop out from the survey than the standard condition.
Lastly, we examined the response to the first NPS question by condition. NPS has 11 response options (0–10). Typically, respondents are grouped into three categories, namely promoters (9–10), passives (7–8), and detractors (0–6). Then, the NPS score is calculated as follows:
\[{\rm{NPS (\% Promotor }}-{\rm{\% Detractors) = }} \times {\rm{ }}100\]
We are not able to release the NPS score for this proprietary data. However, the ratio of the two NPS scores between the embedded and standard email invites was 0.98, suggesting the two responses to the first question were almost identical for the two conditions.
We also compared the response to the first question in a more standard way, that is, by examining the distribution between the two conditions. We calculated the ratio of the two conditions for each category. The ratio for the promoters is 0.976. The ratios for the passives and detractors are 1.089 and 0.911, respectively. A chi-square test showed that the distributions of this question were not significantly different between the two conditions (χ2=1.85, p=0.39).
Discussion
In this study, we reported findings from a survey experiment testing whether embedding a survey question in the email invitation can improve the survey response rate. In the embedded condition, the first question showed up in the email invite. Both the survey click-through rate and the completion rate increased in the embedded condition more than the standard condition. There is a slight increase in the drop-out rate in the embedded condition as well, but it was very small and not significant. The responses to the first question (embedded question) were very similar for both conditions, suggesting that embedding the question did not change the question measurement. Given these findings, an embedded survey question in an email invite improves the survey response rate without any apparent disadvantages. One additional advantage of embedding the question in the email was that even if respondents drop out from the survey, their answers to the first question will be recorded in the embedded condition. In the standard condition, if respondents drop out before completing the first page, all data will be lost.
In addition to the practical implications, this study also opens up a few other research opportunities. First, this study only embedded one question in the email. Future studies should explore the impact of the number of questions in the email on the survey participation. Second, survey length may interact with the effect of embedding questions, and this should be examined through experiments. Third, other question types of the embedded question should also be examined in future research. Fourth, the survey population is very unique in this study. Future research should replicate it among other survey participants.
Disclaimer
The research was conducted when Mingnan Liu was at SurveyMonkey, before he joined Facebook.