
Background
The purpose of this study was to further expand upon Ohio University research conducted and originally published in Survey Practice in 2010 (Preece, Johanson, and Hitchcock 2010). This original study investigated lottery incentives and online survey response rates specifically related to benefits of using multiple smaller rewards (the chance to win one of four $25 Visa gift cards) or a single larger reward (the chance to win one $100 Visa gift card). Preece et al. concluded: “In short, it would seem that the influence of lotteries with single larger prizes compared to lotteries with multiple smaller prizes may well depend on a number of factors one of which is likely the financial need of the participant.”
Although with every passing year more research appears concerning online survey response rates and use of incentives, the bulk of the literature concerning incentive use is still focused on mail surveys. The aim of this study was to either corroborate the results found by Preece et al. with a different audience or provide different results to add to the accumulating body of knowledge on best practices for incentive use to encourage online survey participation.
In addition to Preece et al. other investigators have worked to determine advantages regarding use of incentives in surveys including: the effects of incentive amount and conditional lottery incentives (Porter and Whitcomb 2003) or conditional incentives (DeCamp and Manierre 2016), prepaid incentive amounts and their relationship with demographic variables of the respondent (Szelenyi, Bryant, and Lindholm 2004), use of both pre- and post-paid incentives on response rate (Coopersmith et al. 2016), the effects of conditional lottery incentives and gender on web survey response rates (Laguilles, Williams, and Saunders 2011), and even conditions where the use of survey incentives might be tantamount to coercion (Singer and Bossarte 2006).
Population of Interest
Corporate members of the National Investor Relations Institute (NIRI) generally are individuals who work in publically traded companies in the area of investor relations and closely related fields. These members are surveyed on a regular basis throughout the year on a variety of best practice topics for their field. Continual monitoring and respondent feedback from two decades of both qualitative and quantitative studies have revealed that due to their profession, they are consistently en route to and from meetings throughout the week, rather than at their desk in an office, so it has been found that online surveys formatted for mobile are met with the best response. Consequently, they are very familiar with taking surveys online through their desktop computers, mobile phones, or portable readers (like an iPad or Kindle). Due to declining survey response rates, lottery incentives (along with other techniques designed to ease respondent burden) were instituted sporadically since 2014, and on a regular basis since 2016, with noted success in boosting response rates in this particular population. Although lottery incentives specifically for Amazon gift cards have been successfully utilized in past research efforts with this population, this would be the first attempt at testing for any differences in open rate and survey completion rate (response rate) based on lottery incentive amounts and likelihood of winning an incentive.
Methods
An experiment testing lottery amounts was implemented in the NIRI Earnings Process Survey – 2016 effort in April of 2016. Members of the sample for the online instrument were randomly assigned to one of two groups (Group A or Group B). Each group was presented with an identical email cover letter subject line, and email cover letter invitation body message about the survey. One sentence in the email cover letter invitation differed between those randomly assigned to Group A or Group B. Those randomly assigned to Group A received a sentence in their cover letter stating that, upon completion of the survey and entering of their email address they would be entered into a random drawing to win one of five $20 Amazon gift cards, while those randomly assigned to Group B received a sentence in their cover letter stating that, upon completion of the survey and entering of their email address they would be entered into a random drawing to win one of one $100 Amazon gift cards. The total dollar amount distributed to respondents for each group totaled to $100, for a combined total distributed of $200. A copy of the email subject line with cover letter language that was sent to the survey population is included as Appendix A.
All corporate members with a valid email address on file comprised the population invited to participate in the effort (N=2,283). The survey task involved responding to multiple items related to various tasks of an investor relations officer related to public release of a company’s earnings information. There were a total of 39 items in the online survey, none of which were required. The total sample (2,283) was randomly split into two groups of comparable size. The first sample was assigned to the first incentive group (Group A=1,122) and was offered the chance to win one of five $20 Amazon gift cards; the second sample was assigned to the second incentive group (Group B=1,161) and was offered the chance to win one $100 Amazon gift card. There was no obligation to participate in the survey to enter the lottery, but respondents did have to include their name and email address in the last fields of the survey to be entered into the lottery. Participants were sent one initial survey invitation, one week later they received a reminder email follow-up, and a week after that, one final email requesting participation and notifying when the survey would close. All three emails included a link to take the survey and the incentive lottery amount ($20 or $100) and number of incentives available (five or one).
Respondents in the two groups did not differ substantively in their demographics (mean year started working in investor relations, market cap size of company, gender, and base salary) from each other. Table 1 compares the demographic characteristics of Group A and Group B.
Findings/Results
After three contacts, the total number of responses across both groups was 408, 206 responses from Group A (51 percent) and 201 responses from Group B (49 percent). The true overall response rate for this effort was approximately 18 percent. Response rates were calculated using the American Association for Public Opinion Research Response Rate Calculator, which can be found here: http://www.aapor.org/Education-Resources/For-Researchers/Poll-Survey-FAQ/Response-Rates-An-Overview.aspx. Data indicate that respondents and the population were quite similar with respect to key variables of interest. Differences, where they existed, were not substantive.
This experiment focused on the following:
- Comparison of click-rate (or click-through rate) of the survey link for survey invitations offering the chance to win one of five $20 Amazon gift cards (Group A) versus click-rate of the survey link for survey invitations offering the chance to win one of one $100 Amazon gift cards (Group B), and,
- Comparison of partial survey response rates (or survey drop-out rate) for invitees being offered the chance to win one of five $20 Amazon gift cards (Group A) versus partial survey response rates for invitees being offered the chance to win one of one $100 Amazon gift cards (Group B).
- Comparison of completed survey response rates for invitees being offered the chance to win one of five $20 Amazon gift cards (Group A) versus completed survey response rates for invitees being offered the chance to win one of one $100 Amazon gift cards (Group B).
These questions were addressed using univariate and bivariate descriptive statistics (e.g. percentages and cross-tabulations with chi-square test for independence).
- A chi-square test of independence was calculated comparing the frequency of click-rate of those in Group A to those in Group B. No significant interaction was found, (χ2 (1)=0.004, p<0.952). This indicates no increase in the click-rate for the five $20 Amazon gift card incentive condition (Group A, 17.8 percent) compared with the click-rate for the one $100 Amazon gift card incentive condition (Group B, 17.7 percent). Figure 1 presents survey link click-rate percentages for both experimental groups.
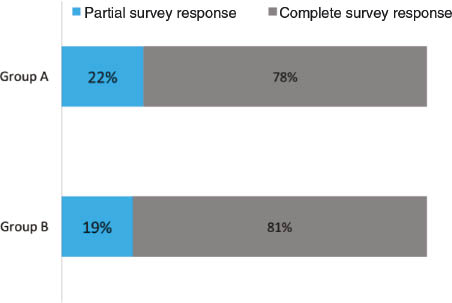
- A chi-square test of independence was calculated comparing the frequency of partial survey responses (or, survey drop-out rate) of those in Group A to those in Group B. No significant interaction was found, (χ2 (1)=0.543, p<0.461). This indicates no significant differences in the frequency of partial responses for the five $20 Amazon gift card incentive condition (Group A, 22.4 percent partial response) compared with the frequency of partial responses for the one $100 Amazon gift card incentive condition (Group B, 19.4 percent). Figure 2 presents partial survey response rates for both experimental groups.
- A chi-square test of independence was calculated comparing the frequency of completed survey responses of those in Group A to those in Group B. No significant interaction was found, (χ2 (1)=0.543, p<0.461). This indicates no significant differences in the frequency of completed responses for the five $20 Amazon gift card incentive condition (Group A, 77.6 percent completed response) compared with the frequency of completed responses for the one $100 Amazon gift card incentive condition (Group B, 80.6 percent). Figure 2 presents complete survey response rates for both experimental groups.


Discussion
Similar to the hypothesis posed by Preece, Johanson, and Hitchcock (2010) concerning no apparent difference between survey response rates when utilizing smaller multiple incentives as opposed to one larger incentive among professionals, our results of this randomized study assist in confirming this statement. Preece et al. found that “…when our sample was almost entirely professional, there was no advantage to either condition” (2010). Our conclusion further strengthens this position, as our sample population was comprised solely of working professionals with comparable demographic backgrounds and characteristics.
It would seem that amongst our sample of professional members there was no greater attraction to the higher chance of being randomly selected to win a smaller survey incentive, than to the smaller chance of being randomly selected to win one larger incentive. This would indicate that perhaps the advantages for the surveyor laid out by Goritz (2004) that the offering of fewer, larger incentives might hold true for those researching populations consisting of adult working professionals with above average salaries.
Appendix A: Email Subject Line and Email Survey Cover Letter Copy
Subject Line: NIRI Earnings Process Survey – 2016: Your Participation is Requested
Dear <First Name><Last Name>,
As a valued NIRI corporate member, we would like to invite you to participate in our first Earnings Process Survey.
<Group A sentence>As a thank you for your time, each participant who completes the survey will be entered into a random drawing to win one of five $20 Amazon gift cards.
<Group B sentence>As a thank you for your time, each participant who completes the survey will be entered into a random drawing to one $100 Amazon gift card.
Due to the highly interconnected nature of quiet periods, earnings guidance, the earnings release, and the earnings call, NIRI has combined these four previously separate research efforts in order to provide the most holistic and up-to-date information on current practice.
Typically, the survey will take 10 minutes to complete. Participation is strictly voluntary and once the survey is started, you may elect to stop at any point. Results will be used in summary form only, and will be announced in an upcoming NIRI Analytics report.
If you have any questions or comments, please contact Ariel Finno, Director-Strategic Research and Evaluation at research@niri.org, or call 1-703-562-7700.
Thank you for your time and input. You are helping NIRI articulate on a subject of great importance to investor relations professionals.
Sincerely,
Jim Cudahy, CAE
President and CEO
National Investor Relations Institute
703.562.7700