


These reports from the field make clear that we are seeing an unprecedented drop in response rates, particularly in the past decade. But many questions remain unanswered: What specific changes in telephone dispositions are causing the drop in response? Are trends in RDD response rate moving in lockstep for landlines and cell phones? And what is the net result of the drop in response rate on effort and cost of RDD telephone surveys?
As part of the American Association for Public Opinion Research (AAPOR) Future of Telephone Surveying Task Force, I volunteered to lead an effort to gather data to document the response rates of a number of polling firms, and in addition to gather data on specific response rate outcomes in order to investigate the questions posed above.
Data were requested from a number of well-known firms. In order to attain relatively equivalent data, the request was constrained to RDD dual-frame surveys of the general population that, if not full trend studies, are nevertheless repeated cross-sectional in which the method is consistent from year to year. An example would be Pew political surveys or ABC polls, and although the topic varies by study, place great importance on maintaining a consistent methodology from study to study. Also important was that each study utilized a dual-frame RDD telephone methodology from at least 2009, so that trend data could be analyzed separately for each frame.
Overall, 15 large and prestigious research firms[1] were asked if they could provide detailed dispositions by year and by frame, preferably from 2007 to 2015. Eight firms reported that they did not have data that fit our criteria and the remaining provided what information they had available. The net result is data from seven firms, whose data are summarized below in Table 1.
Because not every firm provided data for every year and because of the small sample of companies, the analyses must be interpreted with some caution, and indeed, we provide graphs that show in the background results from each individual firm, and make note of trends that go against the norm of other firms, as well as document the impact on the overall trend if outlier firms are excluded. As well, some firms utilize scrubbing procedures for their samples while others do not. Again, we make note of when such data impact the overall trend. Finally, the reported trend begins in 2008 since only two firms provided data for 2007 (mainly because most firms did not begin large-scale cell phone dialing until 2008).
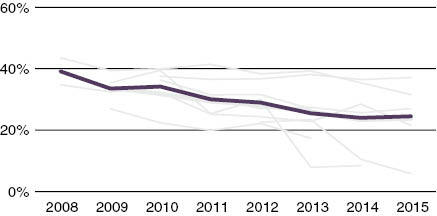
Of course, the first step is to confirm that response rates are in fact declining for the firms in the study. Response rates are provided in Table 2, and indeed, they are declining during the study time period. Landline rates decline from an average of 15.7 percent in 2008 to 9.3 percent in 2015 (a relative decline of 41 percent), while cell phone response rates decline at the same rate, from 11.7 percent to 7.0 percent (a relative decline of 40 percent).[2]
Having confirmed the expected drop in response rate in the data, we turn to trends in dispositions. We report four principal statistics. The first is a traditional refusal rate, AAPOR REF3 [R/((I+P)+(R+NC+O)+e(UH+UO))] (AAPOR Standard Definitions 2016). Second is a combined no answer/answering machine rate which is defined as [(NA+AM)/total sample]. The nonworking rate is simply nonworking sample/total sample, and the yield is total sample/completed interviews.
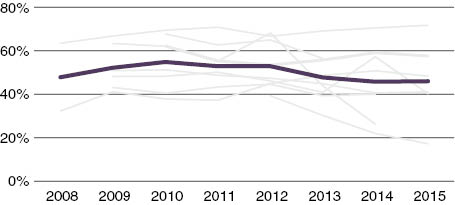
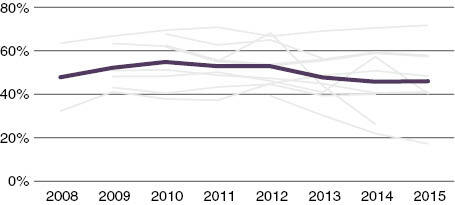
First are REF3 refusal rate trends; see Figures 1 and 2:
Perhaps surprisingly, there is evidence of only a small increase in refusals for landlines, and, in fact, a decline on cell phones. Data from each firm is largely linear and consistent with other firms.
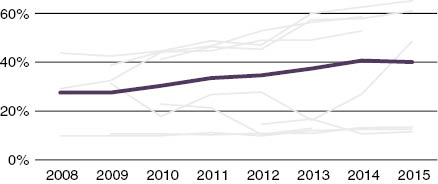
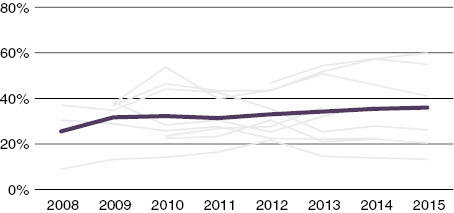
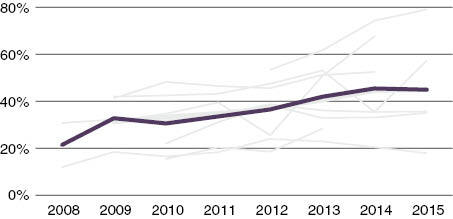
On the other hand, as shown in Figures 3 and 4, there is some upward trending of no answer and answering machine rates. Specifically, no answer/answering machine rates have increased 10 percentage points in the past 8 years for landlines and 24 percentage points for cell phones. There is a notable drop in this metric in one firm for 2014, but elimination of this data point does not impact the 2015 trend and does not significantly affect the overall pattern. Generally, firms were again largely consistent with one another in their trends, though the actual reported percent of no answer and answering machine dispositions differed significantly.
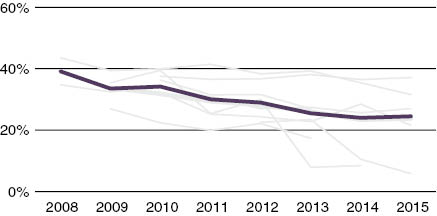
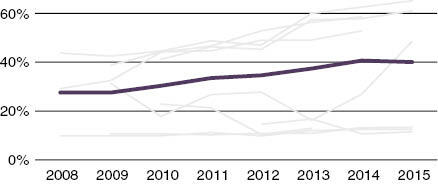
With regard to nonworking rates, as shown in Figures 5 and 6, the trends on each frame are moving in opposite directions. The nonworking rate on landlines has increased from 28 percent to 40 percent in the study timespan (a relative increase of 43 percent), while on cell phones, the rate has dropped from 39 percent to 24 percent (a relative decrease of 38 percent). There was considerable variance in the individual reports on nonworking numbers, unsurprising given that some firms utilize at least business purging on landlines and others do not. Because the nonworking rates of the NBC and RTI data were inconsistent with other data and that these data run only partial years, the figure trendline excludes their data.
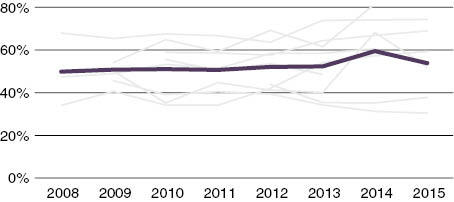
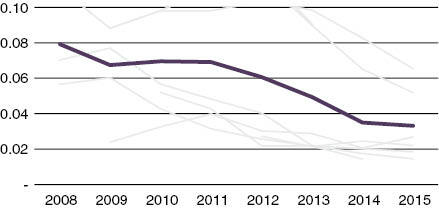
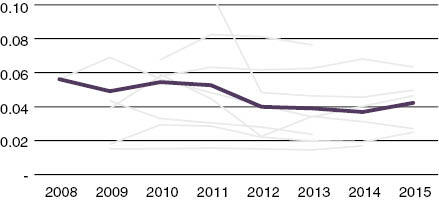
Finally, there is the summative measure of yield (Figures 7 and 8). Yield is the number of sample pieces required to secure a single completed interview (completes/total sample). Yields on landlines have been decreasing significantly through the study timeline, from a high of about 0.08 (14 sample records to attain a single interview) in 2008 to 0.03 in 2015 (46 sample records, a relative increase in sample needed of 329 percent). However, yields on cell phone have declined at a more modest pace. In 2008–2011, there was an average yield of 0.05 (17 sample records per interview). Yields then dropped to 0.04 (36 sample records) in the time period spanning 2012–2015, a relative decrease in yield of 47 percent). There is no clear explanation for the pattern of response here, the potential for there to be two levels of response for cell phones, and the general flat distribution within each time period. Taken as a whole, yields have undoubtedly declined in cell phones, though there is some small ray of hope in that yields have been somewhat flat since 2012.
Overall trends paint a fairly significantly different picture for landlines and cells. It is fairly well understood and clear that the landline frame is living on borrowed time in terms of coverage, as the number of households with landlines is now in less than 50 percent with no evidence that the saturation will not continue to decline over time. Indeed, projecting the quite linear trend in Blumberg and Lukeâ’s data (2015) suggests that landline ownership would be under 10 percent in about 10 years. The data reported here suggest that the impact of the loss of coverage is an increase in nonworking numbers. Simply put, as households have eschewed their landlines, the number of nonworking numbers in valid 1+ telephone banks is growing.
The data however show that there is more to the story with regard to landlines. Yield has been cut in half in 8 years, the result of not just declines in working rates, but increases in refusals, modestly, and increases in screening, more substantially, as evidenced by the growth of the no answer/answering machine rate. A breakdown of these two types of dispositions (not shown) reveals that both are decreasing at about the same rate. As it is likely that most no answers are “hidden” nonworking numbers (see Smith 2009), part of the increase in the no answer rate suggests an event stronger impact of nonworking numbers. Nevertheless, answering machine dispositions have nearly doubled on landlines from 2009 to 2015 (21 percent to 39 percent). Clearly, either those households remaining with landlines were more likely owners of answering machines than those who have dropped landlines, or they have become more likely to screen calls from unknown numbers, or both.
With regard to cell phones, thankfully for the future of telephonic research, the news is much better, though there is some reason for concern. Notable is the fact that cell phone yields have dropped relatively modestly, and much less than for landlines. That said, the devil is in the details. Nonworking rates have fallen, likely because the number of available exchanges has grown little in the past 8 years while the number of numbers going to working phones has increased in line with increased cell phone penetration, according to industry experts.
At the same time, however, the no answer/answering machine rate has increased significantly. Unlike for landlines, it is less plausible to think that no answer dispositions are evidence of an increased nonworking rate as such an assertion runs counter to the overall nonworking rate. No, it is in the authors’ experience that no answer dispositions are commonly hidden voice mail dispositions on cell phones, as many cell phones will not transfer to voice mail until after the fourth ring (and even fifth) and many call centers do not wait that long before abandoning a call attempt. In other words, it seems clear that the American public, while not necessarily refusing to participate in cell phone surveys more than in the past decade (as evidenced by the slightly declining refusal rate on cell phones), is increasingly avoiding calls from unknown telephone numbers by just letting them go to voice mail.
The Million Dollar Question then with regard to cell phones is whether the increase in the no answer/answering machine rate will continue to increase over time, for it is the principal, indeed, the only clear source for lower response rates on cell phones. It is notable that for about half the firms, this rate has been flat for a number of years, while for others it has continued to rise. Given this variation across firms, it is difficult to predict the future of cell phone research on this issue. If the firms that have seen increased no answer/answering machine rates fall in line with those who have enjoyed flat rates, then the future of cell phones would look much like it does today. If the converse is true however, cell phones will continue to see lower response rates and decreased productivity.
Overall, however, it is encouraging that nonworking rates on cell phones are declining and refusal rates are remaining steady, if not slightly declining. Only time will tell how long cell phones will continue to remain viable as a mode to sample and recruit survey respondents, but the evidence reported here suggest that is more likely to hold true for the near future than not.
ABC, CBS, Gallup, GfK, ICF, Ipsos Nielsen, NORC, ORC, Pew, RAND, RTI, SRBI, TNS, Westat.
Firms are not all consistent in how they categorize outcome dispositions into response rate calculators, nor are they consistent in how they deal with screening on cell phones. For example, some firms delineate between answering machines in which a household is confirmed vs. those in which it is unclear whether the answering machine is for a household (vs. a business phone), while others clump answering machines into one disposition. As such, the response rates here have been calculated fresh, using the same categorization rules for every firm.