

Introduction
The selection of an appropriate sampling frame is dependent on multiple factors. These include expected coverage of the target population, mode(s) of data collection, anticipated response rates, and impact on data collection costs. The two sampling frames that are typically considered for telephone studies are dual-frame random digit dialing (RDD) and address-based sampling (ABS). When the constraints of a study require that data be collected solely by telephone and a multimode approach is not feasible, both of these frames have advantages and challenges. These are augmented for studies with geographic targeting and oversampling of subpopulations.
There have been examples in the literature that show that ABS designs have better coverage and a more efficient frame compared to an RDD design (Burks and Link 2012; Johnson and Williams 2010; Link et al. 2006, 2008; Losch et al. 2011). Many studies, upon switching sampling strategies, have also switched modes. What seems to be lacking from the literature is an examination of the impact of moving from an RDD to an ABS design for studies that cannot or do not change modes.
The Aligning Forces for Quality: Assessment of Consumer Engagement (AF4Q) transitioned from a dual-frame RDD to an ABS design. It was constrained to a telephone-only data collection protocol due to the complexity of the survey. The AF4Q presents an opportunity to compare key sampling and data collection metrics between the designs to assess the advantages and limitations of each approach. The AF4Q is a survey of chronically ill consumers of healthcare residing in participating, geographically-defined markets. RTI International conducted the sampling, data collection, and weighting for the second round of the AF4Q. The AF4Q 2.1 included 16 markets and was based on an RDD design, and the AF4Q 2.2, conducted a year later, included three markets and was based on an ABS design.
This paper compares the use of RDD and ABS within a telephone data collection context. We introduce each design, explain the decision to move from an RDD to an ABS design for the AF4Q 2.2, and note key comparisons between the two designs.
Sample Designs
RDD Design
The AF4Q 2.1 was based on an RDD design. Sampled phone numbers were contacted via CATI to complete the screening interview, and if found eligible, the full interview. Respondents found eligible for the full interview were offered a $20 incentive for their participation. Approximately 18,000 completed screeners and 5,000 completed interviews were obtained across the 16 AF4Q markets and the national comparison sample (Figure 1).

The dual-frame RDD design included sample from both landline and cell phone frames. The cell phone frame was developed based on switch center locations. While rate centers have more recently become available and have been shown to be more accurate than switch centers (Marketing Systems Group 2014), they were not available at the time the sample was selected. The switch center locations associated with each market were targeted and included on the sampling frame. Approximately 25 percent of completed screeners and 20 percent of completed interviews were conducted by cell phone.
The AF4Q 2.1 design oversampled minority respondents (defined as Hispanics, non-Hispanic African Americans, and non-Hispanic Asians) within the landline frame. Oversampling was achieved by stratifying the frame based on the mapped location of phone numbers to geographic areas (census block groups for listed numbers and counties for unlisted numbers) and using surname samples. Because of the geographic uncertainties associated with cell phone numbers, minority oversampling within the cell phone frame was not feasible.
Transition to ABS
While the RDD design achieved the goals of the study, several challenges were encountered. Inaccuracies in locations associated with telephone numbers led to concerns related to geographic coverage. This also contributed to concerns with meeting the necessary minority targets and statistical inefficiencies due to significant undersampling of the cell phone population. Finally, because of lower geographic eligibility rates in the cell phone frame, substantial data collection costs were incurred. An ABS design was implemented in the AF4Q 2.2 to alleviate these challenges.
ABS Design
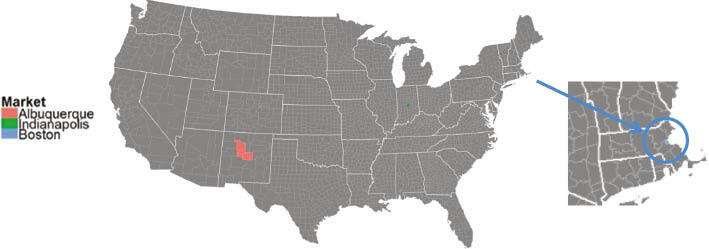
The AF4Q 2.2 was conducted in three markets (Figure 2) and was based on an ABS sampling frame. ABS frames are based on commercially-available versions of the United States Postal Service Computerized Delivery Sequence (USPS CDS) file. The CDS file is made available to the public through licensing agreements with qualified private companies. The USPS also makes available the No-Stat file, which contains over 8 million primarily rural mailing addresses that supplement the CDS file (Shook-Sa et al. 2013). The union of the CDS and No-Stat files account for all postal delivery points serviced by the USPS, giving ABS frames near-complete coverage of the household population (Iannacchione 2011).
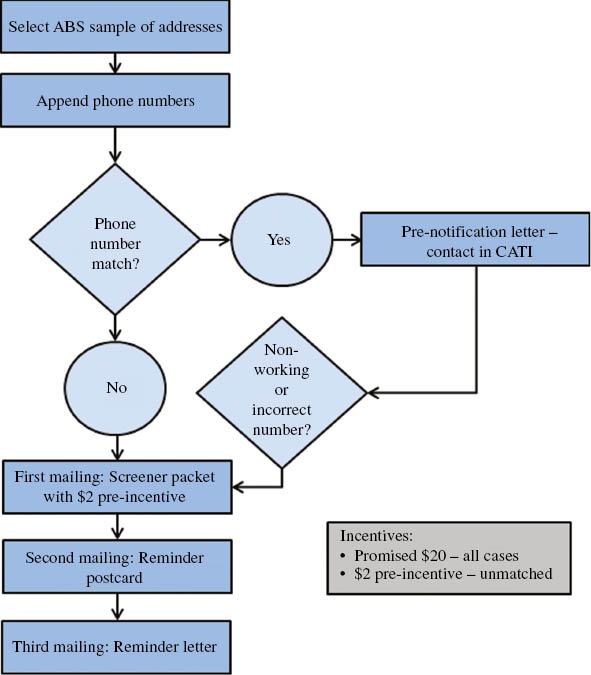
ABS frame elements are mailing addresses, some of which can be linked to phone numbers. The availability of mailing addresses for each frame element allows for more effective stratification and oversampling of minorities because frame elements can be targeted at small levels of geography. For the AF4Q 2.2, oversampling of minorities was achieved by grouping census block groups into six strata based on the proportion of minorities, which were again defined as Hispanics, non-Hispanic African Americans, and non-Hispanic Asians. Sample was allocated across the strata to achieve minority targets while controlling the anticipated design effects. The availability of mailing addresses for each frame element also allows advance letters to be mailed to all sample cases rather than just a subset of cases. However, with an ABS design, persons in households without linked phone numbers (approximately 55 percent of the AF4Q sample) must provide their phone numbers or call in to complete the screening interview. The data collection process for the AF4Q 2.2 is displayed in Figure 3. During the AF4Q 2.2 data collection, about 3,000 screeners and 1,000 interviews were completed, with about 30 percent of completes coming from cases for which a phone number could not be appended to the frame.

Comparison of Designs
Following data collection, comparisons were made between the dual-frame RDD (AF4Q 2.1) sample and the ABS (AF4Q 2.2) sample. These comparisons include frame coverage, data collection costs, sampling efficiency, and response rates. The primary limitation of these comparisons is that the AF4Q 2.1 and 2.2 samples were conducted in different geographic areas, and data collection occurred during different time frames.
Frame Coverage
The cell phone portion of the RDD frame suffered from significant undercoverage of the target population due to inaccuracies in identifying relatively small geographic areas through switch centers. However, even if the sample design were transitioned to rate centers, sizeable undercoverage of the cell phone only population would remain. As previously discussed, the ABS frame eliminates inaccuracies due to geographic targeting and provides near-complete coverage of the household population.
Data Collection Costs
For both the RDD and ABS designs, we calculated the cost per completed interview. These costs included direct labor charges as well as other direct costs such as the costs of mailings and incentives. ABS completed interviews were approximately 20 percent cheaper than RDD completes, even taking into account costs of additional mailings and pre-incentives that were not incurred with the RDD design.
Sampling Efficiencies
We compared the sampling efficiency between the RDD and ABS samples by evaluating the variability in analysis weights, measured with design effects due to unequal weighting (DEFFw). Differing market characteristics led to a need to enhance comparability between the designs. We conducted a simulation study in which the ABS design was simulated for the 10 AF4Q 2.1 markets that incorporated minority oversampling and were originally conducted via RDD. This simulation allocated the ABS sample within the 10 RDD markets, holding constant the number of interviews and number of minority interviews. Sample yield rates were assumed to be similar to those observed in the AF4Q 2.2 ABS markets. Inflation in design effects due to unequal weighting from design to final analysis weights observed in the AF4Q 2.2 markets was applied.
Effective sample sizes were calculated for both the original (RDD) and simulated (ABS) designs equal to the ratio of the total number of respondents to the DEFFw. Results are shown in Table 1. For all markets except two (Memphis and Cleveland), the ABS-simulated effective sample sizes were higher than the RDD-observed effective sample sizes. This simulation study provided evidence that the ABS design was more statistically efficient than the RDD design.
Response Rates
Table 2 contains the ranked weighted AAPOR4 response rates in the AF4Q 2.1 (RDD) and AF4Q 2.2 (ABS) markets. While the response rates in all markets were relatively low, the response rates in the RDD markets were higher than the response rates in the ABS markets with the exception of the national comparison sample. However, response rates are not necessarily indicative of which design produced higher quality estimates (Groves 2006; Lee et al. 2009).
Discussion
For telephone-only data collection designs, dual-frame RDD and ABS are two viable frame options for telephone sampling. RDD offers a consistent mode of recruitment and contact for all sampled cases. It does not allow advance letters to be mailed to all cases because mailing addresses can only be appended to a subset of telephone numbers. Inaccuracies in geographically linking cell phone numbers to subnational geographic areas makes RDD challenging for subnational studies and for studies that aim to oversample based on geographically-clustered characteristics of the target population such as race/ethnicity. These inaccuracies result in undercoverage, sampling inefficiencies, and increased data collection costs.
ABS offers a high-coverage frame for subnational studies. The ABS frame allows for more efficient and accurate targeting of subnational populations and oversampling of geographically-clustered characteristics. From a data collection standpoint, ABS allows for advance letters to be mailed to all sampled cases. ABS poses challenges for telephone designs since inconsistent modes of study recruitment are required. Different recruitment methods can lead to differential nonresponse and the potential for nonresponse bias.
In this comparative analysis, we found that both designs were able to achieve the goals of the AF4Q study. However, key differences were found in terms of frame coverage, data collection costs, sampling efficiency, and response rates. The ABS design offered higher frame coverage, lower costs, and improved sampling efficiency over the RDD design. The only metric evaluated in which the RDD design performed better than the ABS design was in response rates, which do not necessarily correlate with bias in key estimates such as health outcomes.
Until better methods are established for linking cell phone numbers to subnational areas, we recommend that subnational telephone studies and telephone studies incorporating oversampling of geographically-correlated characteristics consider ABS as a viable frame option. ABS will be an even better option if and when techniques are developed to accurately link cell phone numbers to mailing addresses.
Acknowledgements
The Aligning Forces for Quality (AF4Q) initiative is sponsored by the Robert Wood Johnson Foundation. The Center for Healthcare and Policy Research at Pennsylvania State University serves as the AF4Q evaluation team. The authors would like to acknowledge the contributions of Dennis Scanlon and David Johnson at Pennsylvania State University. Thanks also to RTI International staff members G. Lance Couzens for developing the graphics in this paper and to Brian Head and Barbara Bibb for their valuable contributions to the AF4Q project.