Loading [Contrib]/a11y/accessibility-menu.js
Skip to main content
Survey Practice
  • Menu
  • Articles
    • Articles
    • Editor Notes
    • In-Brief Notes
    • Interview the Expert
    • Recent Books, Papers, and Presentations
    • All
  • For Authors
  • Editorial Board
  • About
  • Issues
  • Blog
  • Subscribe
  • search

RSS Feed

Enter the URL below into your favorite RSS reader.

http://localhost:25512/feed
Articles
Vol. 9, Issue 1, 2016January 31, 2016 EDT

Effect of a post-paid incentive on response rates to a web-based survey

Julie A Brown, Carl A. Serrato, Mildred Hugh, Michael H. Kanter, Karen L. Spritzer, Ron D. Hays,
survey costcahpsincentives
https://doi.org/10.29115/SP-2016-0001
Survey Practice
Brown, Julie A, Carl A. Serrato, Mildred Hugh, Michael H. Kanter, Karen L. Spritzer, and Ron D. Hays. 2016. “Effect of a Post-Paid Incentive on Response Rates to a Web-Based Survey.” Survey Practice 9 (1). https:/​/​doi.org/​10.29115/​SP-2016-0001.
Save article as...▾
Download all (1)
  • Figure 1   Study flow diagram.
    Download

Sorry, something went wrong. Please try again.

If this problem reoccurs, please contact Scholastica Support

Error message:

undefined

View more stats

Abstract

We randomized half of the sample from two southern California medical centers to a post-paid incentive (n = 1,795) and half to no incentive (n = 1,797) for completing a web-based survey about their experiences with health care.  Respondents in the incentive group were given the choice between a $5 cash or Target® e-certificate. The characteristics of respondents in the incentive and control groups was similar on age, education, length of membership in the plan, number of emails sent and visits to the primary care doctor in the 12 months prior to sampling, and their global rating of the doctor; the incentive group had more Asians (8% vs. 5%, χ2 (1 df) = 7.92, p = 0.005) and fewer Blacks/African Americans (2% vs. 4%, χ2 (1 df) = 11.0, p =0.001) than the no incentive group.  Those randomized to the incentive were significantly more likely to respond to the survey than those in the control group (57% vs. 50%, t (df = 3590) = 4.06, p <0.0001).  Item non response rates were similar for those in the incentive and the control groups. Those randomized to the incentive condition who completed the survey were more likely to prefer a cash incentive over the e-certificate (69% of the incentives delivered to web respondents were in the form of cash).   The unit cost per incentive was $8.32 for cash and $7.49 for the e-certificate. The results of this experiment indicate that a post-paid incentive can significantly increase the response rate to a web-based survey. 

Introduction

Previous research suggests that self-administered, mailed surveys using pre-paid incentives yield higher response rates than surveys without an incentive (Berry and Kanouse 1987; Church 1993; Dillman 2000). However, the effect of pre-paid incentives on response rates for web-surveys is unclear. In fact, some studies have found no effect on response rates (Downes-Le Guin et al. 2002; Heerwegh et al. 2005; Kypros and Gallagher 2003) while others have reported lower response rates associated with incentives (Cook, Heath, and Thompson 2000). In this study, we explore the effect of a post-paid incentive on response rates to a web-based survey and elicit relative preferences for a $5 cash or e-certificate incentive.

Methods

Sample

The sample was adult patients from two southern California medical centers selected because a substantial number of patients (about 30 percent) within each were registered users of Kaiser Permanente’s My Health Manager. My Health Manager is a sophisticated patient portal that supports secure communication with physicians and other providers (including pharmacy staff), appointment setting, access to a personal medical records, test results, and pharmacy information, provision of health care reminders, and tools for requesting prescription refills. Patients had to have had either visited or emailed 1 of 30 primary care providers in the study within the prior 12 months (McInnes et al. 2012).

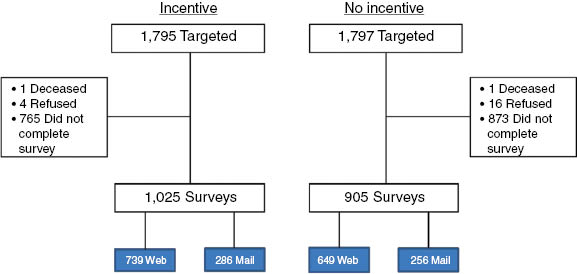
We used a split-ballot approach and randomized half of the sample from each medical center to a post-paid incentive (experimental group) and half to no incentive (control group): approximately 1,800 patients (900 per medical center) were assigned to each mode (see Figure 1).

Figure 1   Study flow diagram.

Patients were invited to complete a patient experience survey via an email sent to the email address they had registered on the Kaiser Permanente system. The email appeared to come from kp.org but was generated and sent by RAND’s data collection system. The email contained a link to the survey URL and the individual’s survey code, required to access the survey. The only difference in the invitation text between the experimental and control groups was the addition of one sentence in the experimental group invitation, offering a $5 incentive (those who responded to the web-based survey were given the choice between a $5 cash or Target e-certificate) for completion of the survey. A patient received a maximum of three emailed invitations: initial invitation, a reminder sent to non-responders, and a second reminder sent to nonresponders. The first reminder was sent twelve days after the initial invitation, and the second reminder was sent 30 days after the initial invitation. Fifty-seven days after the initial email invitation, nonresponders were sent a paper version of the survey via first-class mail.

Analysis Plan

We compare the characteristics of respondents and response rates for the experimental and control groups. We also compare the number of days between the request to complete the survey and the date it was received and item non-response rates. In addition, we examine whether item responses differ by group. We also document preferences for the cash vs. the e-certificate incentive in respondents to the web-based survey. Those in the incentive group who completed the mail version of the survey were sent $5 cash. Finally, we estimate the costs per completed survey including the dollar value of the incentive and labor associated with incentive preparation and delivery. For the cash incentive, the unit cost includes cost of incentive, labor for assembly of incentive mailings, first-class postage and envelope for delivery. For the e-certificate incentive unit, cost includes cost of incentive and labor associated with e-mailing of incentive.

Results

The characteristics of respondents in the incentive and control groups was similar (Table 1) including age, education, length of membership in Kaiser Permanente, number of emails sent to the primary care provider in the 12 months prior to sampling, and the overall 010 rating of the primary care provider. However, the incentive group had more Asians [8 percent vs. 5 percent, χ2 (1 df)=7.92, p=0.005] and fewer Blacks/African Americans [2 percent vs. 4 percent, χ2 (1 df)=11.00, p=0.001] than the control group.

Table 1.Characteristics of study participants byrandomized group.
Characteristic Incentive Control Test statistic p-Value
Mean length of plan membership (in months) 63 61 t(1,927)=-0.70 p=0.4867
# of emails to primary care provider (PCP) last 12 months 4.4 4.3 t(1,799)=-0.24 p=0.8077
Ever use email or Web 98% 98% χ2(1)=0.28 p=0.6416
# Visits to PCP last 12 months: χ2(6)=17.97 p=0.0063
 None <1% <1%
 1 time 23% 17%
 2 32% 33%
 3 20% 25%
 4 12% 14%
 5 to 9 12% 10%
 10 or more times <1% 1%
Mean rating of PCP (0–10) 8.8 8.8 t(1,880)=0.16 p=0.8767
Overall rating of health=excellent 16% 14% χ2(1)=1.49 p=0.2465
Gender:
 Male
 Female

41%
59%

44%
56%
χ2(1)=2.20 p=0.3023
Age:
 18–24
 25–34
 35–44
 45–54
 55–64
 65+

2%
6%
10%
19%
28%
36%

1%
4%
9%
17%
30%
39%
χ2(5)=7.08 p=0.2146
Education:
 8th grade or less
 Some high school
 diploma/GED
 some college/2 year degree
 4 year degree
 more than 4 year degree

<1%
1%
10%
37%
22%
30%

<1%
1%
11%
36%
21%
30%
χ2(5)=2.55 p=0.7688
Race and ethnicity: χ2(1)=0.02

 Hispanic 8% 8% χ2(1)=0.57 p=0.9312
 Am Indian/Alaska native 1% 1% χ2(1)=7.92 p=0.5216
 Asian 8% 5% χ2(1)=11.04 p=0.0050
 Black or Afr American 2% 4% χ2(1)=0.29 p=0.0010
 Nat Hawaiian/Pac Island <1% <1% χ2(1)=0.44 p=0.7413
 White 90% 91% p=0.5212
Had elp to complete Survey=YES 3% 2% χ2(1)=3.65 p=0.0641

As shown in Table 2, those randomized to the incentive were significantly more likely to respond to the survey than those in the control group. The delay between a request for survey completion and the receipt of a completed survey was similar for the two groups (5.76 days and 5.83 days for the incentive and control groups, respectively). Rates of completion of the survey were similar but higher for the incentive group ([9 percent incentive vs. 97 percent control, χ2(1)=5.99, p=0.0144]. In addition, responses to survey items were similar for those in the two groups (Table 3).

Table 2.Response rates.
Incentive Control All
Overall response rate 57% 50% 54%
Mode of completion
 Web 72% 72% 72%
 Mail 28% 28% 28%

Overall response rate differed significantly between incentive and control groups [t (3,590 df)=4.06, p<0.0001]. Mode of completion did not differ significantly (Fisher’s exact test, two-tailed, p=0.8,790).

Table 3.Participant response to survey items.
Incentive Control Test statistics p-Value
Use email or website to make appointment (=yes) 44% 49% χ2(1)=2.60 p=0.1148
Emailed medical question (=yes) 65% 64% χ2(1)=0.35 p=0.5637
Received emailed reminders for tests or treatment (=yes) 41% 42% χ2(1)=0.19 p=0.6724
Primary care provider (PCP) used computer/handheld device during visits (=yes) 95% 95% χ2(1)=0.22 p=0.6719
Ways PCP used computer/handheld device
– For tests results/info (=yes)
– To show info (=yes)
– To order prescriptions (=yes)
99%
60%
87%
99%
58%
87%
χ2(1)=0.04
χ2(1)=0.41
χ2(1)=0.00
p=1.0000
p=0.5292
p=1.0000
PCP use of computer/handheld device helpful (=yes, definitely) 75%  77% χ2(1)=2.61 p=0.4372
Looked for lab or test results on website (=yes) 98% 98% χ2(1)=2.61 p=0.8585
Looked for list of prescription medicines on website (=yes) 78% 75% χ2(1)=2.61 p=0.5043

Table 4 shows that respondents randomized to the incentive condition were significantly more likely to prefer a cash incentive over the e-certificate; 69 percent of the incentives delivered to web respondents were in the form of cash. The unit cost per incentive was $8.32 for cash and $7.49 for the e-certificate.

Table 4.Web respondent preferences for type of incentive.
Type of incentive Respondents # (%)
$5 cash 414 (56%)
$5 e-certificate 186 (25%)
Refused incentive 117 (16%)
No data 22 (3%)
Total 739 (100%)

The difference between the proportion preferring $5 cash vs. $5 e-certificate was statistically significant (z=9.31, p<0.0001).

Discussion

The results of this experiment indicate that a post-paid incentive can significantly increase response rate to a web-based survey. The improvement in response rate was significant in both of the medical centers in our study (results not shown but available upon request). Our experiment controlled for many of the factors that are associated with higher response rates in web surveys (Cook, Heath, and Thompson 2000): number of invitations to complete the survey, mode of delivery of invitations, and use of personalization. By providing similar treatment to our incentive and control groups in the number, mode of delivery, and level of personalization in survey contacts, we were able to identify differences in response due to the use of the incentive.

The time to complete a survey and the responses to survey items did not differ between the incentive and the no incentive groups. So the 7 percentage point difference in response rate did not alter conclusions that would have been drawn about these items in this sample. Further research is needed to see if and when the higher response rates associated with incentives for web surveys have an impact on survey responses.

This study also shows that a cash incentive is more desirable than an e-certificate to survey respondents, consistent with a web survey that used pre-paid incentives (Birnholz et al. 2004). The preference for cash makes sense because of the greater flexibility in purchasing what the respondent desires compared to a specific e-certificate. The unit cost of cash was 83 cents greater than the e-certificate, however.

Acknowledgements

This paper was presented at the 2014 Society for Computers in Psychology Meeting, Long Beach, CA. The work was supported by a cooperative agreement from the Agency for Healthcare Research and Quality (U18 HS016980).

References

Berry, S.H., and D.E. Kanouse. 1987. “Physician Response to a Mailed Survey: An Experiment in Timing of Payment.” Public Opinion Quarterly 51 (1): 102–14. http:/​/​poq.oxfordjournals.org/​content/​51/​1/​102.abstract.
Google Scholar
Birnholz, J.P., D.B. Horn, T.A. Finholt, and S.J. Bae. 2004. “The Effects of Cash, Electronic, and Paper Gift Certificates as Respondent Incentives for a Web-Based Survey of Technologically Sophisticated Respondents.” Social Science Computer Review 22 (3): 355–62. http:/​/​ssc.sagepub.com/​content/​22/​3/​355.abstract.
Google Scholar
Church, A.H. 1993. “Estimating the Effect of Incentives on Mail Survey Response Rates: A Meta-Analysis.” Public Opinion Quarterly 57 (1): 62–79. http:/​/​www.jstor.org/​stable/​2749438.
Google Scholar
Cook, C., F. Heath, and R.L. Thompson. 2000. “A Meta-Analysis of Response Rates in Web- or Internet-Based Surveys.” Educational and Psychological Measurement 60 (6): 821–36. http:/​/​epm.sagepub.com/​content/​60/​6/​821.abstract.
Google Scholar
Dillman, D.A. 2000. Mail and Internet Surveys: Tailored Design Method. New York: John Wiley & Sons.
Google Scholar
Downes-Le Guin, T., P. Janowitz, R. Stone, and S. Khorram. 2002. “Use of Pre-Incentives in an Internet Survey.” Journal of Online Research. http:/​/​www.websm.org/​uploadi/​editor/​use_of_pre-incentives_in_an_internet_survey.pdf.
Google Scholar
Heerwegh, Dirk, Tim Vanhove, Koen Matthijs, and Geert Loosveldt. 2005. “The Effect of Personalization on Response Rates and Data Quality in Web Surveys.” International Journal of Social Research Methodology 8 (2): 85–99.
Google Scholar
Kypros, K., and S.J. Gallagher. 2003. “Incentives to Increase Participation in an Internet Survey of Alcohol Use: A Controlled Experiment.” Alcohol & Alcoholism 38 (5): 437–41. http:/​/​alcalc.oxfordjournals.org/​content/​38/​5/​437.
Google Scholar
McInnes, D.K., J.A. Brown, R.D. Hays, P. Gallagher, J.D. Ralston, M. Hugh, M. Kanter, et al. 2012. “Development and Assessment of CAHPS Questions to Assess the Impact of Health Information Technology on Patient Experiences with Care.” Medical Care 50 (Suppl): 11–19. http:/​/​www.ncbi.nlm.nih.gov/​pmc/​articles/​PMC3525454/​.
Google Scholar

This website uses cookies

We use cookies to enhance your experience and support COUNTER Metrics for transparent reporting of readership statistics. Cookie data is not sold to third parties or used for marketing purposes.

Powered by Scholastica, the modern academic journal management system