Introduction
Having a representative sample is important for virtually any quantitative study. Often, the response rate is a key indicator used to determine if it is plausible that the sample might have a bias (Groves 2006), causing researchers to seek methods for improving response rates to ensure better representation. Financial incentives have often been used to increase response rates and have been regarded as a successful approach in field-based studies where cash can be offered in-person (Dillman, Smyth, and Christian 2009; Singer and Ye 2013). Increased use of Internet-based surveys has made it burdensome to deliver up front incentives, however. Therefore, an important question is whether an incentive provided upon completion increases response rates for electronic surveys. In addition, a better understanding is needed regarding whether these economic incentives alter sample characteristics by changing who might response to the incentive, increasing nonresponse bias. This study tests the effectiveness of conditional monetary incentives for web-surveys through an experimental design in which participants are randomly assigned to an incentive or incentiveless group.
Groves and colleagues’ (2000) leverage-saliency theory of survey participation provides the theoretical framework for the present study. This framework posits that survey participation depends in part on the survey request’s emphasis on particular elements of the survey (salience) and leverage; the promised incentives are hypothesized to work because they add a salient element (payment) to with increasingly positive leverage as compensation increases (Singer and Ye 2013). Regardless of quantity offered, the leverage attributed to the survey incentive depends on the individual – not everyone will react the same way (Groves, Singer, and Corning 2000). Therefore, it is also important to also consider the possibility that survey demographics and responses may be biased due to some individuals being more motivated by financial incentives than others.
Monetary incentives typically fall into three categories: (1) prepaid incentives are given respondents before they have completed the survey, (2) conditional incentives are given to respondents after they have completed the survey, and (3) lotteries are used for their low cost because only a few respondents are rewarded for their efforts. The literature has explored the effectiveness of each of these incentives, though research on incentives in web surveys is still uncommon. The prepaid cash incentive is widely regarded as the best method of improving survey response for mail and in-person surveys (Birnholtz et al. 2004; Church 1993; Dillman, Smyth, and Christian 2009; Kypri and Gallagher 2003) but is frequently infeasible for online surveys (Hoonakker and Carayon 2009; Porter and Whitcomb 2003). Conditional incentives, in which the respondent is guaranteed a reward after completion an online survey, are less researched and they have yielded mixed results, ranging from null effects to clear improvements (Birnholtz et al. 2004; Göritz 2004, 2006; Patrick et al. 2013).
Implicit in the pursuit of high response rates is the assumption that higher response rates corresponds to a better sample, but even surveys with high response rates can suffer from bias. When incentives are used to motivate response, it is hoped that they improve response for every member of the population but different groups may interpret the weight of incentives differently (Groves, Singer, and Corning 2000). In mail surveys, it has been found that a variety of incentives produce differences in demographic characteristics (Ryu, Couper, and Marans 2005; Teisl, Roe, and Vayda 2006). Few studies have examined the effect of incentives on nonresponse bias in online surveys, none of which have explored the effect of conditional incentives. Two studies have found that lottery incentives attract female respondents to web surveys disproportionately (Heerwegh 2006; Laguilles, Williams, and Saunders 2011). A similar result was found for prepaid incentives and online surveys, with a group receiving a two-dollar prepaid incentive being less reflective of administrative records than the control group, with the control group matching official records for gender, but the incentivized group being overly female (Parsons and Manierre 2013). Some research also suggests that the gender gap is more pronounced with smaller dollar figures but still exists with higher values nonetheless (Boulianne 2013).
Overall, evidence is inconsistent regarding how effective conditional incentives are for online surveys. Whether this potential improvement in survey response actually makes the sample more representative is also in question. The present study examines these lingering questions using an experimental design with official data to analyze for nonresponse bias. The following hypotheses are posed based on the literature and leverage-salience theory: (a) offering these incentives will result in a better response rate, and increasing the size of the incentive promised will further improve the response rate for the web survey; (b) a better response rate will result in different demographic characteristics, which may be more or less accurate in representing the population; and (c) incentive groups will have significantly different responses to substantive items on the survey.
Methods
An experimental design is used to test the effectiveness of conditional incentives. For the sample, 1,000 full-time, undergraduates were randomly selected at a large, American Midwest university. The selection process was performed with coordination from the university’s research office under the approval of the institutional review board. These students were randomly assigned to one of three groups and were invited to participate in a survey on “college behaviors.” The email invitation contained a unique link to the survey with no additional login credentials required, which made access simple and convenient. The unique link stopped working after survey completion, preventing duplicate responses from the same link. The students were promised confidentiality, and their names were removed from all datasets.
Those assigned to the control group (n=600) were sent an invitation without any discussion of incentives. Students assigned to the first experimental group (n=250) or the second (n=150) were given the same invitation, but with a promise of a two-dollar or five-dollar (respectively) credit being applied to their student ID card. To maximize the utility of the incentive, they were told that they would be able to select the type of credit: for use at the bookstore (which has a large selection of merchandise) or for use at dining services (including various options across the campus). All students equally benefited from such a credit, as all students are required to have student ID cards. The invitation emails were sent on the Monday of the third week of classes in the fall 2012 semester. Reminder emails were sent on the fourth, ninth, and seventeenth days to potential participants who had not yet responded or unsubscribed (only 3.9 percent of students opted-out).
In addition to simply comparing the response rates based on the incentives offered, official individual-level data were provided by the university for use in determining whether any response biases are present among the groups. The official data include: gender, race (non-Hispanic white or other), age, nationality (American or international), state residency (in-state tuition rate or not), campus residency (lives on-campus or not), class status in years completed (0 = freshmen, 1 = sophomore, etc.), and GPA. The substantive questions on the survey can also provide some insight into differences that might occur across incentive groups. The variables used from the survey include measures of personal characteristics, substance use, victimization, and offending. The true population proportions for these indicators are unknown, but bias can be identified by comparing the three study groups against one another. Comparisons between groups are performed using chi-square tests or t-test as appropriate for the level of measure.[1]
Results
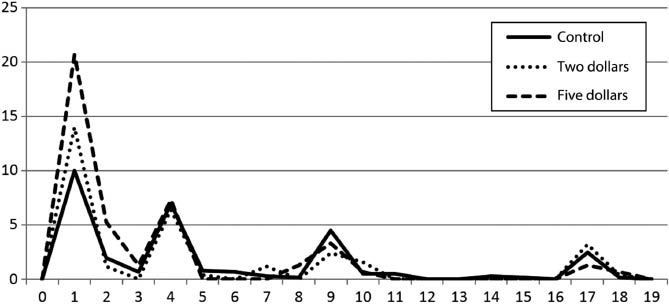
During the three weeks in which the survey was available, 322 students (32.2 percent) responded, including 182 (30.4 percent) in the control group, 77 (30.8 percent) in the two-dollar group, and 63 (42.0 percent) in the five-dollar group. Students in the five-dollar group were significantly more likely to respond than those in either the control or two-dollar groups (p=0.021). The graph in Figure 1 illustrates that the incentive group only has a higher response rate during the first week, suggesting that the incentive has a stronger effect on early respondents.

The differences between the population parameters (official data) and the sample estimate are displayed in Table 1. The control group has significant deviations from administrative records in the form of higher observed GPAs, a larger proportion of females, and a larger proportion of students living on-campus. The two-dollar group similarly had a larger proportion of females than the original sampling frame. Conversely, the five-dollar group was virtually identical to the sampling frame. Overall, none of the groups were radically different from the population, though the five-dollar group was closest to the original sampling frame.
The self-reported question responses are displayed in Table 2. Although the percentages do vary from group to group, there were no significant differences for any of these measures with the sole exception of academic cheating on exams. Caution should be used in interpreting the significance here, as these analyses included 22 chi-square tests and the significance level (p<0.10) indicates only a one-in-ten chance of incorrectly rejecting the null hypothesis. Given 22 tests and a 10 percent error rate, it is likely – even expected – that something would be significant by chance alone. Thus, there is more evidence suggesting similarities than dissimilarities.
Worth considering is that a lack of significance in a relationship does not necessarily indicate that there is no relationship. Significance tests single relationships, while ignoring trends across multiple tests. In other words, although the groups are not significantly different, they could be consistently different. To examine this possibility, deviations as a measure of each group’s difference from the others were examined. When the deviations for each variable are averaged, the two-dollar group has an average deviation from the control group of –0.27. The five-dollar group has an average deviation from the control group of 0.32 and from the two-dollar group of 0.59. The average deviation is therefore less than one percentage point for each comparison. Thus, rather than any bias trend, substantive differences between groups appear to be more akin to random noise that averages nearly zero when taken as a whole, so incentive groups do not have significantly or substantively different responses to items on the survey.
Discussion
In line with leverage-salience theory, this experimental design supports the assertion that offering a conditional reward as payment for completing a survey does have an impact on response rates. This is evidenced by the increase in response rates from 30 percent in the control group to 42 percent in the five-dollar group. However, the lack of significant improvement from the two-dollar group implies that the impact is tied to the amount of the reward. These findings lend support to leverage-salience theory’s assertion that this type of incentive functions as a payment rather than a trigger for reciprocity, as reciprocity would have resulted in both incentives increasing response rates.
Research has demonstrated that conditional incentives increase response rates in some situations (Dillman, Smyth, and Christian 2009; Singer and Ye 2013), but the empirical support for that effect is mixed for online surveys (e.g., Birnholtz et al. 2004; Singer and Ye 2013). It is possible that the reason this study contradicts prior null findings is because the reward was provided electronically and respondents had an option for their compensation type, increasing the leverage of what is often a static and delayed reward.
It also appears that the higher response rate of the five-dollar group coincided with improved representativeness compared to both the control group and small incentive group. This improvement likely indicates that the incentive has higher leverage among college students who are normally unlikely to respond, such as off-campus students and men. This is a key finding given that some prior studies of college students have found that increasing the response rate through prepaid and lottery incentives may further bias responses in web surveys towards certain groups (Boulianne 2013; Heerwegh 2006; Laguilles, Williams, and Saunders 2011; Parsons and Manierre 2013). Contrary to prior studies, these data suggest that a five-dollar conditional incentive may increase representativeness while also improving response.
Similar to response rates being used as a proxy for representativeness, accurate demographics are assumed to correspond to more representative measurement of dependent and independent variables. When examining substantive survey items, the vast majority of measures indicated no significant differences based on the incentive offered and the response rate achieved, suggesting that neither has a significant impact on substantive conclusions.
Although offering several advances, the present study has a few limitations. First, the novel reward distribution system used here to provide electronic deposits to ID cards may affect generalizability, as cash or other types and sizes of rewards might yield different effects. Second, this study focused exclusively on college students, and the effectiveness of incentives may vary based on the target audience. Finally, it is possible that the groups in this study are too small to detect statistically significant deviations from administrative records in some cases. Most of the deviations were substantively small; however, it is unlikely that the core conclusions would be changed by a larger sample.
In addition to replicating this study, future research should expand on these findings. It remains unclear whether the use of conditional rewards for web surveys is more or less effective than the use of raffle designs or a prepaid cash incentive. It would also be beneficial to examine the effect of allowing respondents to choose their reward, as they were in this study, as this may increase the appeal of the incentive. This choice element may help to explain this study’s somewhat surprising findings, which contradict much of the literature on promised incentives and mail surveys.
Until future research can clarify these and other unanswered questions, it remains unclear whether there are sufficient gains from using conditional incentives. In summary, this study suggests that a sufficiently large promised incentive may help to improve web survey response among college students while also improving the representativeness of that data. However, it remains unclear whether there are sufficient substantive gains to justify this investment. On one hand, the increased response rate and representativeness suggests that there is a benefit for the increased cost. On the other hand, the minimal differences on substantive items implies that conclusions are not necessarily impacted. Overall, this research suggests that incentives are effective, but also that failing to use incentives may not necessarily result in “bad data” that are substantively less valuable. Therefore, it is advised that web survey researchers base their decision on whether to use a conditional incentive on whether demographically accurate data or additional power is required, rather than the prospect of enhanced data on substantive issues.
Acknowledgement
The data used in this research were collected using funding made available by Western Michigan University through the Arts and Sciences Teaching and Research Award. The authors wish to thank Western Michigan University and its College of Arts and Sciences for their generous support.
Marginal significance (p<0.10) is reported in the analyses given the moderate sample sizes of the groups. As will be demonstrated in the results to come, this is done not to overreport significant differences. Rather, given that very few tests show significance falling in this gray area, this is done to provide even further evidence that differences are negligible.