


Confidence in US Federal Statistical Agencies
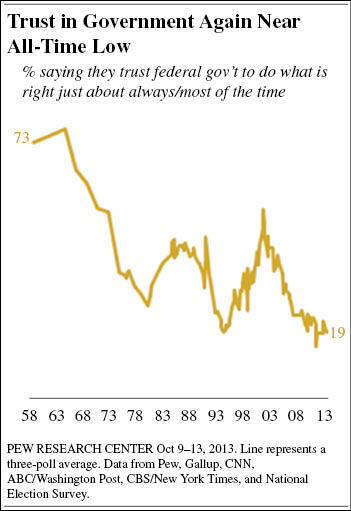
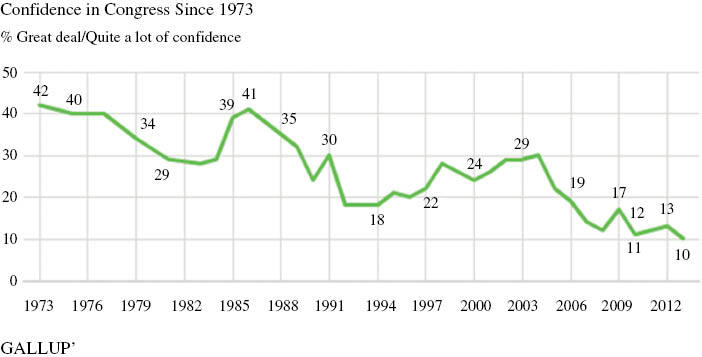
In the United States, trust in the government and confidence in Congress have reached an all-time low. According to research done by Gallup (2013) and Pew (2013), trust and confidence in the government and Congress have decreased (see Figures 1 and 2) over the past 5 to 6 decades. Figure 1 presents a graph representing public trust in government collected between 1958 and 2013 by a number of survey organizations Pew Research Center (2013a), and Figure 2 presents public confidence in Congress between 1973 and 2012 (Gallup 2013).
Research conducted by Harris-Kojetin and Tucker (1999) found that cooperation rates on a government survey were higher when the public held more positive opinions of the government and government leaders. Given the current state of public opinion about the federal government, leaders of federal statistical agencies (FSAs) were interested in knowing whether lack of trust and confidence in the government and its leaders would influence other, non-elected, parts of the government, specifically the statistical agencies. Researching and understanding this information is crucial and pertinent to statistical agencies as well as other data collection organizations because they rely on the participation of the public, and maintaining a trustworthy image is critical to their ability to carry out their mandates (Fellegi 1995).
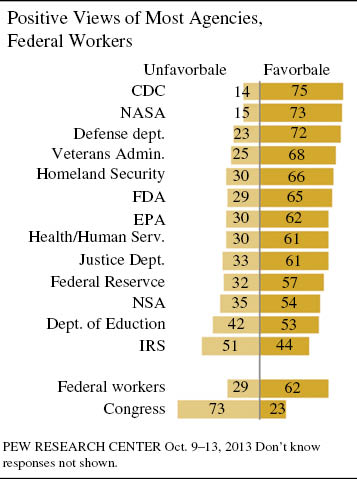
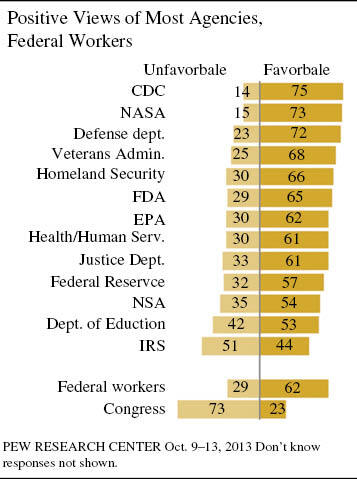
Figure 3 shows a more encouraging picture. At the same time that the last data point was collected for Figure 1, the Pew Research Center asked the public about views on different government agencies (Pew Research Center 2013b). All agencies included in the survey, as well as government workers in general, received a higher favorability rating than Congress.
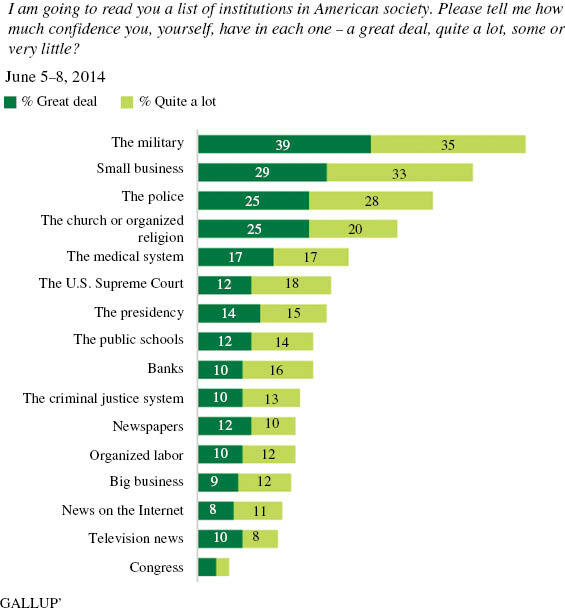
The Gallup Organization often studies the public’s confidence in different established institutions. Figure 4 shows the results of a series of confidence-in-institutions questions that were asked in 2014, ranging from a high level of confidence in the military to a historic low level of confidence in Congress.
The Census Bureau partnered with other FSAs to understand where confidence in the federal statistical system would fall compared with other institutions studied by Gallup. The new data collection procedure placed FSAs in a subset of this series and gathered data over time. The researchers examined how confidence in FSAs is related to confidence in other institutions as well as whether confidence levels changed during the course of our 19-month data collection.
Methods
The Census Bureau partnered with the National Agricultural Statistics Service, the National Center of Health Statistics, the Economic Research Service, Statistics of Income Division (IRS), and the Statistical and Science Policy Office, Office of Management and Budget to design, pretest and implement the Federal Statistical System Public Opinion Survey (Childs et al. 2012). The data presented are not intended to be representative, but rather point towards useful directions for future research and tactical decision-making.
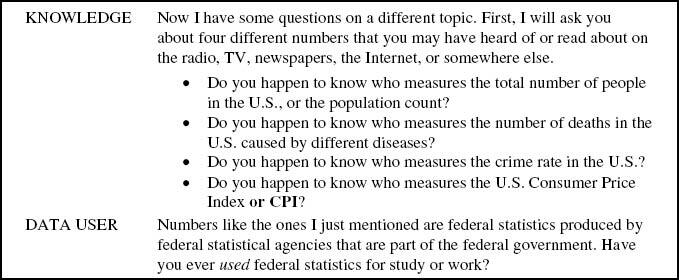
From February 2012 until September 2013, we added 25 questions to a sample of cases in an ongoing survey, the Gallup Daily Tracking Survey. This survey is a daily survey asking US adults about various political, economic, and well-being topics. Approximately 19 of the 25 questions were core questions that did not vary and focused on awareness of and attitudes towards federal statistics and statistical agencies (see Figure 5). In addition to these questions, we included a subset of Gallup’s confidence-in-institutions measure, adding FSAs and universities as institutions (see Figure 6).

Nightly, Gallup interviewers conduct computer-assisted telephone interviews with randomly sampled respondents, aged 18 and older, including cellphone users and Spanish-speaking respondents from all 50 US states and the District of Columbia. The survey includes many standard demographics including race, income, education, employment status, and occupation. Gallup relies on dual-frame sampling (which includes random-digit-dial-list-assisted landline interviewing and wireless phone sampling), and a random selection method for choosing the respondent within landline households. Gallup stratifies the phone samples to ensure that the unweighted samples are proportionate by geographic region. Gallup weights the data daily to compensate for disproportionalities in selection probabilities and nonresponse as well as to match targets from the Census Bureau by age, sex, region, gender, education, ethnicity, and race, as well as population density of the respondent’s reported geographic area. The American Association for Public Opinion Research’s (2011) III response rate has averaged 7 percent for the track on which the census questions are presented.[1]
Although the Gallup Daily Tracking Survey is portrayed as being nationally representative, it does not meet Census Bureau quality standards for dissemination and is not intended for use as precise national estimates or distribution as a Census Bureau data product. The Census Bureau and other sponsoring agencies used the results from this survey to monitor awareness and attitudes, as an indicator of the impact of potential negative events, and as an indicator of potential changes in communication campaigns.
To compare the strength of the relationships, we used the gamma correlation statistic, produced by comparing each of the confidence in institution measures to one another. The gamma statistic can take on a value of –1 to 1, with values closer to either –1 or 1 indicate a strong association between the two variables, while variables that have responses that are independent of each are closer to zero.
Results
First, the researchers examined the rank order of the institutions as measured in our collection. Next, we looked at relationships between confidence in FSAs and confidence in other institutions that have similarities to FSAs. Newspapers and universities are also sources of information. The military and Congress are other parts of the federal government.
As Figure 7 shows, the traditionally polled institutions – Military, Newspapers, and Congress – are in the same rank order that Gallup reports. Reported confidence in FSAs is at approximately the same level as confidence in Newspapers. FSAs rank higher than Congress, but much lower in absolute level of confidence than the military and universities.

Next, we examined the strength of the relationships between confidence in FSAs and (1) confidence in other government bodies (Congress, the military) and (2) other knowledge sources (newspapers, universities). As shown in Table 1, overall, the strongest relationships were between respondents’ level of confidence in FSAs and their level of confidence in Congress (0.5272), as well as the relationship between respondent’s level of confidence in FSAs and universities (0.5152).
For respondents who reported ever using federal data, the relationships between confidence in FSAs and in newspapers (0.4649) and between confidence in FSAs and in universities (0.5074) are stronger than the relationship between confidence in FSAs and in Congress (0.3821). The same is not true for non-data users (newspapers=0.4870; universities=0.5092; and Congress=0.6066). This indicates that data users are differentiating between FSAs and Congress more than non-data users. Similarly, there is a weaker correlation between confidence in FSAs and in the military for data users (0.1714) than for non-data users (0.2392).
Researchers were also interested in how knowledge about the statistical system impacts relative confidence in these institutions. Similar to the findings with data users, Table 2 indicates that as knowledge about federal statistics increases, discrimination among government entities increases. That is, as the level of knowledge increases, correlations between confidence in FSAs and the military and FSAs and Congress decrease. This is appropriate since these different segments of the government have vastly different missions. As the level of knowledge increases, relationships between knowledge sources increase. That is, as the level of knowledge increases, correlations between confidence in FSAs and newspapers and FSAs and universities increase. Again, this shows that respondents are making appropriate associations between newspapers, universities and the FSAs as sources of knowledge.
For FSAs, this effect is encouraging – that use of federal data and knowledge about the federal statistical system is related to increasingly correlated views between FSAs and other sources of information (newspapers and universities). Likewise, use of federal data and knowledge about the federal statistical system is related to decreasingly correlated views between FSAs and other governmental departments, including one that is traditionally highly esteemed (military) and one that is traditionally judged poorly (Congress).
Discussion
Though the rank level of confidence in FSAs was disappointing, we were encouraged to see that there are some key factors – use of statistics and knowledge about our statistical system – that mediate the relationship between confidence in the statistical system and confidence in Congress.
At a time when confidence in Congress is particularly low, there are a few actions that could help the reputation of the federal statistical system (and perhaps other data collectors), based on these findings. Public relations campaigns that focus on increasing the level of the population’s general knowledge about statistics and the statistical system and related programs that promote the use of statistics in schools could help people differentiate between sectors of the government, thus increasing confidence in the federal statistical system.
This falls in line with research by Harris-Kojetin and Tucker (1999) showing that response rates to government surveys are related to views towards the government. For data collectors and statistical organizations outside of the government, it is interesting to note that confidence in universities was rated higher than confidence in FSAs, newspapers, and Congress. Given the current low confidence in the government, and the suggestion that the government is over-surveying the public (Presser and McCulloch 2011), future research should re-examine the relative response rate to government-sponsored vs. university-sponsored surveys in this light (see Heberlein and Baumgartner 1978 for an early examination of the survey-sponsor effect; Mercer et al. 2015 show a lack of survey-sponsor effects in a recent meta-analysis).
Disclaimer
This paper is released to inform interested parties of research and to encourage discussion of work in progress. Any views expressed on statistical, methodological, technical, or operational issues are those of the author and not necessarily those of the Census Bureau. The researchers would like to acknowledge and thank Theresa DeMaio, Casey Eggleston and Gerson Morales for providing helpful comments on earlier drafts of this work.
This response rate is slightly lower than the response rate for this track typically, but is close to what was expected. The weighted sample size for this report is 68,325.