
Introduction
Opinion studies are widely used tools to measure the perception of school students on diverse aspects. The aim of this work is to find a solution to the questions concerning the implementation of a Web survey on a student population utilizing probabilistic sampling and illustrating the methodology on study carried out in 2013 on future interests of high school students in four provinces of Spain.
The first published papers on Web surveys appeared in 1996 (Couper and Miller 2008). The Web methodology keeps in mind the fact that the cost is probably the single most important factor driving the search for new sampling methods (Brick 2011). One of the inconveniences of using the Internet to carry out surveys is the difficulty of achieving a probabilistic sampling design that allows for estimates of the sampling error. Internet panel surveys consist of inviting the individuals of a population to be part of a sampling frame. When a questionnaire is done, a sample of individuals is selected from the panel with a probabilistic design, so the selection probability of the individuals of the sampling frame (panel) is known, but the selection probability from the general population of interest is unknown. Yeager et al. (2011) compare the accuracy of Internet surveys conducted with probability and non-probability Internet samples, and they concluded that probability samples yielded quite accurate results. Researchers interested in making accurate measurements can continue to rely on probability sampling with confidence.
An example of online surveys using a student population can be found in Couper, Traugott, and Lamias (2001), in which a sample of 1,602 students were sent an e-mail inviting them to answer a survey via the Internet. Sills and Song (2002) show the results of a Web questionnaire of international students from Arizona State University; the study consists of 929 completed questionnaires.
Approaching the Problem
Our objective is to estimate the opinion of school students, collected through a personal Web survey. The problem is thus equivalent to an online social study with the habitual stages: objectives, population, sampling frame, questionnaire, online implementation of the questionnaire, pilot test, sampling design, fieldwork, code of the database, database filtration, elevation factors, statistical treatment of the database and the presentation of results.
The population is made up of the total, or a subset, of the students of all the schools in the geographical target area of the experiment. The schools suitable for the application of the methodology proposed in this article need, as a minimum, a “multimedia” classroom with a group of computers with connection to the Internet. Nowadays, the existence of these classrooms is habitual and practically all Spain’s schools have one.
The sampling frame is the list of all the schools in the geographical target area of the social study. This sampling frame is perfect because the student population must be in a school, and no student can be in more than one school.
To extrapolate the results from the sample to the population, a probabilistic sampling design is needed, an aspect that is solved in the next section.
Sample Design
The main reason that justify considering stratification as the initial design is because it seems logical that the opinion of the students should vary according to their geographical location or where they study or because of other variables. An indispensable condition in the choice of the stratification variables is that the school population can be stratified as the student population is stratified in such a way that each school of the sampling frame is in one stratum and no school is in more than one stratum. If we suppose that the sample of students in each stratum is taken using a simple random sampling without replacement (SI) in order to estimate a proportion with proportional affixation, the sample size is calculated with the stratified sampling formulas (Särndal, Swensson, and Wretman 1992).
We consider sub-stratification variables to be those that determine categories in which it is considered appropriate that the student sample is also representative. To achieve this representativeness, the theoretical student sample size is distributed by proportional quotas throughout the population size of students in the categories of these variables. These student quotas are denominated sub-stratification quotas. An indispensable condition to consider a group of variables as sub-stratification variables is that the school classroom population can be classified within the categories determined by the crossing of all these variables.
Once the student sample size has been calculated, a first school is taken with SI, in each stratum. In the first sampling school of each stratum, all the classrooms are taken in order to achieve the student sub-stratification quotas. The classrooms are considered to be student clusters. Next, we take a second school with SI in each stratum; in these schools, it is only necessary to interview the classrooms that allow the sub-stratification quotas not covered by the classrooms of the first school of the sample to be reached. The process of taking schools in each stratum and classrooms in each school is continued sequentially until all the sub-stratification quotas are overcome.
This sampling design determines a selection probability for each individual equal to the probability of the school where the student studies being selected.
Online Social Study “Survey on the Future Perspectives of Students Studying in High School in the District of the University of Valladolid”
To illustrate the application of the proposed methodology, the online survey, carried out in 2013 and coordinated by the authors of this article, is described with the object of knowing the future formation desires and labor insertion of the student population studying in high school in some school of the provinces of Palencia, Soria, Segovia and Valladolid (Spain) where the University of Valladolid (UVa) has educational centers (UVa district).
Population
The target population is 11,276 students that study in day high schools in the UVa district.
Sampling Frame
The sampling frame is 102 education centers.
The variables of each education center in the sampling frame are:
- Province
- Geographical location: province capital, municipalities close to the capital (less than 15 kms from the capital), and rest of the municipalities.
- Student number by course (1° and 2°).
- High school type (sciences or arts)
- Ownership of the center (public or private)
Questionnaire and its Online Implementation
The questionnaire is structured into three blocks. The first block analyzes, with 15 questions, the student’s personal, family, social and academic profile. The second block, with 12 questions, analyzes the future perspectives in the student’s formation. The last block looks at information that can classify the student within a stratum and check that the theoretical sample quotas are reached.
Of the diverse alternatives that exist to implement the online survey, we opted for Google Docs for several reasons: the confidentiality of the data, easy access and handling, and it is a free Web-based application. The students access the survey through a hyperlink. To be able to respond to the survey, the student is identified with the user name and password assigned for the day the survey is carried out. Once the student has completed the survey, he/she sends it and the data are automatically recorded in a worksheet.
Sampling Design
The stratification variables are province and geographical location of the center. Table 1 contains the student sample size, calculated with a fixed estimate error of 5 percent and a confidence of 95 percent.
Next, the sub-stratification quotas are obtained according to ownership of the center, course and high school type in each province and geographical location. Table 2 contains the sub-stratification student quotas of one of the four provinces.
To take the schools sample, the first step is to classify the sampling frame of the education centers in the strata determined by the variables of province, geographical location and ownership. The sequential process of taking centers in each stratum with SI, until the sub-stratification quotas are covered, determines the sampling sizes contained in Table 3.
Fieldwork
A survey day is assigned to each one of the 24 centers of the sample. An order is established in each center in the sampling classrooms and, sequentially, the classroom goes to the “multimedia” room of the center. All the students of one classroom answer the survey simultaneously and send it under the supervision and help of the coordinator or center director present in the “multimedia” room. The approximate time of the survey for each classroom is less than 20 minutes. The simplicity of the procedure and the excellent disposition of the staff of the centers allowed the survey to be done for all the high school classrooms of the center in one day, thus providing an increase in the student sample size and a decrease of the sampling error. This way of working transfers the consideration from classroom clusters to center clusters.
The complete fieldwork was carried out in approximately one month.
Sample and Sampling Error
Table 4 shows the definitive student sample size. It is greater than the sample size theoretically necessary in all the categories of the stratification variables. The same thing happens in the categories of the sub-stratification variables.
Table 5 shows the error to estimate a proportion, obtained with the final sample of students, with a fixed confidence of 95 percent and considering the biggest possible variability (p=q=0.5).
Statistical Treatment of the Database
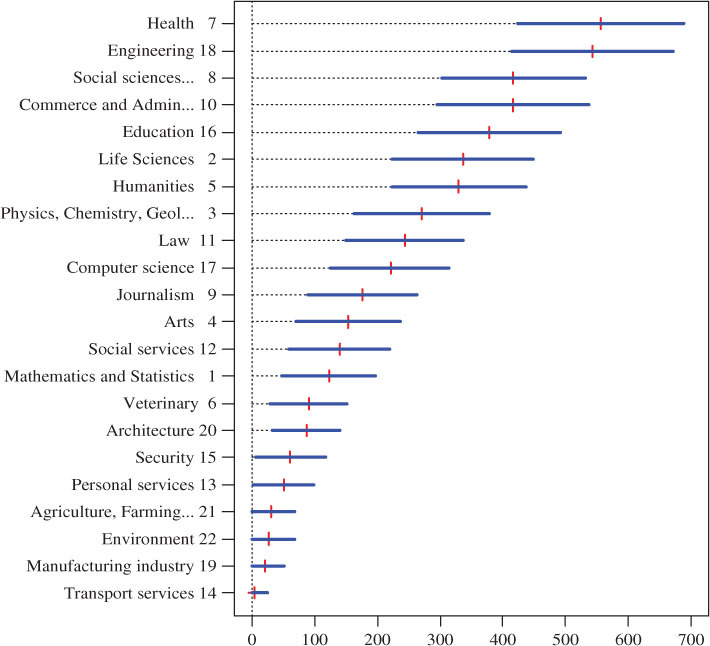
Once the database has been filtered, the statistical treatment is carried out. For example, in Figure 1, the estimation, with a confidence interval of 95 percent, of the number of students of the 2nd year of high school who want to study in each of the different sectors of university degrees can be seen:
Conclusions
The present investigation suggests a probabilistic sampling design to carry out online surveys in education centers. The design is based on applying stratified sampling, sampling for quotas and cluster sampling. The application of the proposed theory to a real social study shows the following advantages:
The practical implementation methodology has a low economic cost, since the fieldwork can be carried out with a very small number of pollsters, without losing control of the sampling error.
Using the survey online allows the database to be accessed immediately and to be able to begin the filtration of the database simultaneously to the fieldwork.
The lack of answers is practically null, since the interviewees answer the survey themselves and the presence of the interviewer facilitates and motivates the answer.
Although the methodology of this article has been proposed for schools, it is also applicable in university centers where, in general, there are multimedia rooms with computers with Internet connection, and the students are also in classrooms. The possibility of applying the methodology to other centers, as for example libraries, formation academies, military centers, etc., is conditioned to the centers having multimedia rooms and being able to consider some similar clusters of individuals to those of classrooms in schools.
Acknowledgements
To the students Ana Belén de Lucas, Irene de la Rosa and Nuria Torres, to the General Education Management of the Regional Government of Castilla y León, and to the teachers, students and directors of the selected centers.