
Introduction
Address-based sampling (ABS) is commonly used either as an alternative to or in conjunction with traditional field enumeration (FE) methods for in-person surveys (Iannacchione 2011). FE frames are constructed by canvassing selected areas and enumerating potential housing units (HUs). ABS frames are derived from the U.S. Postal Service’s (USPS) computerized delivery sequence (CDS) file, which is made available to select vendors through nonexclusive licensing agreements with USPS. ABS frames based on the CDS file provide both time and cost savings over traditional FE, because ABS frames do not require field staff to visit area segments in advance of sample selection.
Despite the time and cost savings of ABS designs, concerns remain about the household coverage of ABS frames for in-person surveys, particularly in rural areas (Dohrmann, Han, and Mohadjer 2007; Iannacchione et al. 2007; O’Muircheartaigh, English, and Eckman 2007). One approach to ameliorate low rural ABS coverage is to develop a hybrid sampling frame, where areas that are expected to have adequate ABS coverage are allocated to the ABS portion of the frame, and areas with poor ABS coverage are allocated to FE (Lepkowski et al. 2010; Iannacchione et al. 2012).
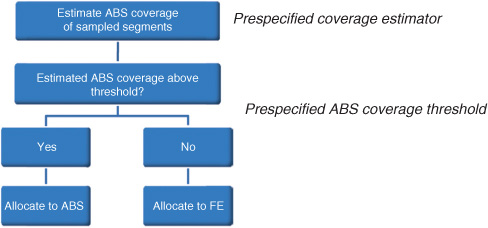
Figure 1 depicts the implementation of a hybrid frame design. First, a sample of area segments is selected. Area segments are geographic areas that are typically formed based on Census geography (e.g., census block groups or collections of census blocks). When ABS is used as the primary frame source, segments can be larger than with traditional FE designs, because ABS does not require enumeration of HUs. With a hybrid frame approach, larger segments can be used, and those that are allocated to FE would be subdivided into smaller geographic areas where FE is feasible.

The ABS coverage in each selected segment is estimated using a prespecified coverage estimation method. Various techniques exist for predicting ABS coverage. Montaquila et al (2011) propose utilizing a multiple regression model to predict areas where ABS coverage is expected to be sufficient. Iannacchione et al. (2012) evaluate a coverage model that estimates coverage by taking the ratio of ABS addresses in the segment to the estimated number of dwelling units.
A prespecified ABS coverage threshold is also established. Segments that exceed the ABS coverage threshold are allocated to the ABS portion of the frame, while segments where ABS coverage is not expected to achieve the threshold are allocated to FE.[1] The selection of an ABS coverage threshold is typically study-specific and depends on such factors as whether or not additional frame supplementation will occur in ABS segments (see Kalton et al. 2014 and McMichael et al. 2008) and the budget of the study. The prespecified ABS coverage threshold is a minimum bound for allocating segments to ABS and is not an estimate of the expected coverage of the ABS portion of the frame.
Hybrid frame designs provide the cost savings of ABS where possible but retain FE where necessary to maintain adequate household coverage. In general, the more segments that are allocated to the ABS portion of the frame, the higher the cost savings. The highest cost savings are realized for lower ABS coverage thresholds, where more segments meet the prespecified ABS coverage threshold criteria and are allocated to ABS. However, there is a trade-off between cost and coverage, because unless frame supplementation procedures are utilized in ABS segments the expected coverage of the frame decreases as the ABS coverage threshold decreases.
The more complete the ABS frame, the more segments that are allocated to ABS and the greater the cost savings. Until recently, ABS frames for in-person surveys were limited to locatable addresses from the CDS file.[2] Starting in 2009, the USPS made available the No-Stat file, a supplemental file that contains approximately seven million locatable residential addresses. The following four types of locatable addresses are included on the No-Stat file:[3]
- New Growth:[4] addresses of residences under construction that are not yet receiving mail
- Rural Throwback: addresses for HUs on rural postal routes whose residents specify that their mail be delivered to a P.O. Box rather than to their residence
- Internal Drop: locatable addresses with unit designators for a small proportion of the drop point addresses contained on the CDS file
- Rural Vacant: addresses on rural postal routes that have been classified as vacant for 90 days or longer
There is very little overlap between the CDS and No-Stat files, so the two files can be combined into a single, No-Stat supplemented ABS frame.[5] Shook-Sa et al. (2013) found that approximately 21 percent of No-Stat locatable addresses are associated with occupied HUs (i.e., households). While this is much lower than the occupancy rate for HUs associated with CDS addresses (90 percent), the No-Stat file contains the addresses for approximately 1.3 million households that are excluded from the CDS file. It provides an estimated 1.2 percent increase in coverage for households nationally and an estimated 3.8 percent increase in rural areas.
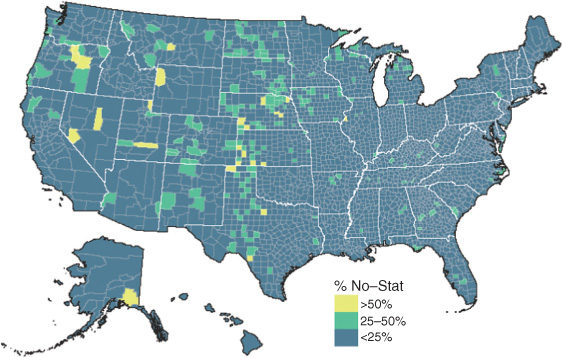
While the national coverage gains provided by the No-Stat file are modest, localized coverage gains could lead to significant improvements in the efficiency of hybrid frame designs. The map in Figure 2 displays the percentage of locatable addresses on the combined CDS/No-Stat file that come from the No-Stat file, at the county level. Because No-Stat addresses are clustered in primarily rural areas, the No-Stat file has the potential to move area segments that would otherwise rely on FE to the ABS portion of a hybrid frame. If this occurs in enough segments, the No-Stat file could provide sizeable cost savings in a hybrid design. This paper measures the national and state-level efficiencies that are gained by including the No-Stat file in a hybrid frame design.
Methods
To evaluate the level of efficiencies resulting from the inclusion of the No-Stat file in a hybrid frame design, we compared two potential sampling frames: the CDS-only frame (the traditional ABS frame) and the combined CDS/No-Stat frame. We constructed a national list of 215,547 area segments, formed from census block groups or collapsed census block groups.[6] We obtained the March 2013 CDS and No-Stat files that had been geocoded into census block groups and could therefore be linked to the area segments.[7] Within each area segment s, we calculated the number of locatable CDS addresses (Ls,CDS) and the number of locatable addresses on the combined CDS/No-Stat frame (Ls,CDS+).[8]
When allocating segments to ABS and FE, we are primarily concerned with the level of household coverage within sampled area segments. However, not every address on the CDS file corresponds with a household (e.g,. the CDS contains addresses for vacant or demolished HUs). For this reason, we form our coverage model based on HU coverage and use this as a proxy for household coverage. We estimated the ABS coverage in each area segment for each frame (CDS-only and CDS/No-Stat) using the prespecified model defined below:
Cs,f=Ls,fHUs
Where Cs,f is the expected ABS coverage of segment s based on sampling frame f, Ls,f is the number of locatable addresses on sampling frame f in segment s (as defined above), and HUs is the estimated number of HUs in segment s (from the 2010 Census).
While the estimated ABS coverage for a given area segment and sampling frame is fixed, the allocation of that segment to ABS versus FE is dependent on the coverage threshold for a given study. As discussed previously, the choice of the ABS coverage threshold is often study specific. For this reason, we compared the allocation of segments to ABS and FE under a hybrid sampling design for various potential coverage thresholds. We assumed a national probability proportional to size (PPS) design where the size measure was the adult population from the 2010 Census. PPS sampling allows the probability of selecting each area segment to be proportional to its size measure. This ensures that persons have similar probabilities of selection, regardless of the size of the segments in which they reside.
We made national and state-level estimates for the differences in allocations between the two sampling frames by examining the expected distribution of segments across ABS and FE under this design.[9] The difference between the CDS-only and the CDS/No-Stat percentage of segments allocated to FE provides an estimate of the efficiencies gained by including the No-Stat file on the ABS frame. For a given ABS coverage threshold t, the percentage of segments moved from FE to the ABS portion of the hybrid frame by the No-Stat file (PNSt) is equal to the percentage of segments allocated to FE for the CDS-only frame (PCDSt) minus the percentage of segments allocated to FE for the combined CDS/No-Stat frame (PCDS+t). That is,
PNSt=PCDSt−PCDS+t
We estimate PNSt at the national and state levels for various potential ABS coverage thresholds that could be used in a hybrid frame design.
Results
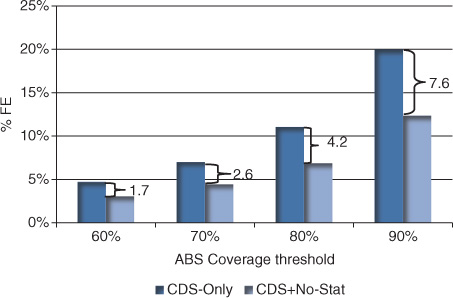
Figure 3 compares the percentage of segments allocated to FE for the CDS-only frame (PCDSt) to the CDS/No-Stat frame (PCDS+t) for four different potential ABS coverage thresholds t at the national level. The differences between the bars represent the total percentage of segments that the No-Stat file would move from FE to ABS (PNSt) for each potential ABS threshold. For all potential ABS coverage thresholds evaluated, the No-Stat file provided efficiency gains by boosting the expected coverage of segments enough that a sizeable number of segments moved from FE to ABS. Efficiency gains were larger for the higher coverage thresholds. For example, if a 90 percent coverage threshold were used to allocate segments between ABS and FE in the hybrid frame design, an additional 7.6 percent of segments could rely on ABS rather than FE when the No-Stat file is included, compared to a 1.7 percent gain if a 60 percent coverage threshold were used in this allocation.

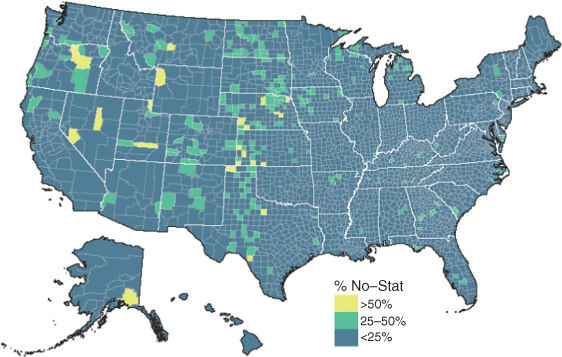
Because No-Stat addresses are geographically clustered and would not be expected to achieve uniform coverage gains across the country, we also compared the efficiency gains resulting from No-Stat inclusion at the state level. The map in Figure 4 shows the total percentage of segments that would rely on ABS rather than FE due to the inclusion of the No-Stat file if a 90 percent coverage threshold (PNS90) were used to allocate segments between ABS and FE. There are large differences across the states in efficiency gains resulting from inclusion of the No-Stat file, ranging from substantial to negligible. The largest efficiency gains are in Iowa, where the No-Stat file moved 20.1 percent of all segments from FE to ABS. This is compared to the smallest efficiency gains in Washington, DC, where only 0.7 percent of total segments move from FE to ABS. In general, the largest efficiency gains occur in the Southern and Midwestern states, while smaller gains are realized in more urban states (e.g., California and New Jersey).
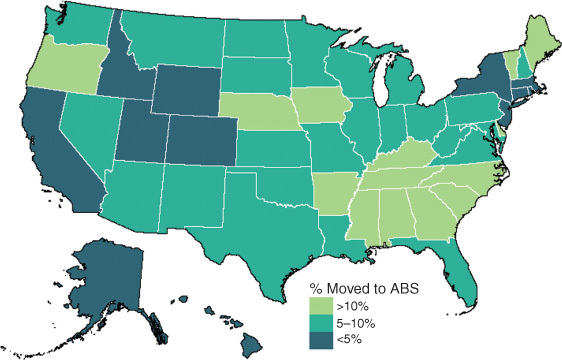
Table 1 provides state-level estimates of the total percentage of segments moved to ABS by the No-Stat file, (PNSt), for four potential ABS coverage thresholds: 60, 70, 80, and 90 percent. While states with the largest No-Stat gains for a particular coverage threshold tend to see substantial gains for all four potential thresholds, the state distributions do vary across the four thresholds. For example, North Dakota has the largest gains from the No-Stat file if a 60 percent coverage threshold (PNS60=10.8 percent) is implemented but ranks twenty-fifth for No-Stat gains if a 90 percent coverage threshold (PNS90=8.3 percent) is used in the allocation of segments. These differences are driven by the distribution of expected ABS coverage from the CDS file alone relative to the distribution of No-Stat addresses across the segments.
Discussion
For the specified ABS coverage estimation model, the No-Stat file improves the efficiency of hybrid frames for in-person surveys by moving segments that would otherwise rely on FE to the ABS portion of the frame. Under this model, efficiency gains are greater for higher coverage thresholds and vary widely across states. These results are consistent with an evaluation by Iannacchione et al. (2012), who found that the No-Stat file would result in between 2 and 10 percent of segments moving from FE to ABS with the inclusion of the No-Stat file at the national level, depending on the ABS coverage threshold specified.
The actual efficiencies gained from including the No-Stat file in a hybrid design are dependent on the coverage prediction model, ABS coverage threshold, and sample design for a given study so care should be taken when applying these results to alternative designs. In addition, these results are based on the allocation of segments to FE and ABS under the specified coverage prediction model at the sample design stage, and the accuracy of the assignments has not been validated in the field. This coverage model assumes that CDS and No-Stat addresses correspond with HUs in a one-to-one manner. In a small field study, Dekker et al. (2014) found a sizable proportion of No-Stat addresses to be associated with vacant lots. Prior No-Stat findings indicate that approximately 21 percent of No-Stat addresses are associated with occupied households (Shook-Sa et al. 2013), but if a sizeable proportion of the remaining No-Stat addresses do not correspond with vacant HUs, then the specified coverage model could lead to inaccurate coverage estimates for some segments. Therefore, as with any coverage prediction model, following implementation of the hybrid frame allocation, the assignment of segments to FE and ABS should be validated with field data to ensure that the model leads to appropriate segment assignments and to assist in refining the coverage prediction model, as needed.
Despite these limitations, based on these and prior findings, the No-Stat file appears to be a useful source for supplementing the CDS file for in-person ABS designs. It provides modest household coverage gains, particularly in rural areas, and could lead to substantial cost savings in a hybrid frame design.
Acknowledgements
The author would like to acknowledge G. Lance Couzens for developing the maps in this paper as well as Vincent Iannacchione, Rachel Harter, Pat Wiley, and the editors of Survey Practice for their valuable contributions to this research.
Several variations of hybrid sampling frame designs exist. For example, an alternative enumeration method, such as enhanced listing, could be used in segments that do not meet the coverage threshold. With enhanced listing, field personnel update the ABS list prior to sample selection (Harter et al. 2010).
Locatable mailing addresses include street numbers and names along with cities, states, and zip codes. Addresses that are not locatable cannot be linked to physical HUs on the ground and are typically excluded from the sampling frames for in-person surveys (e.g., P. O. Boxes, Rural/Highway Contract Routes, and Simplified Addresses).
No-Stat addresses can be classified into these four categories using the PO Box Throwback Indicator, the Delivery Point Type Code, and the CDS No-Stat New Growth Indicator as outlined in the CDS User Guide (United States Postal Service 2013).
All addresses on the No-Stat file are classified based on their new growth status. For simplification, our classifications put all new growth addresses into a single category and then split out the non-new growth addresses into the three remaining categories.
When combining the CDS and No-Stat files, No-Stat internal drop addresses should be excluded because they are already contained on the CDS file as drop points.
Less than one percent of census block groups had to be collapsed when forming area segments because they did not meet the minimum size criteria of 100 HUs (at least one of which was occupied). HU estimates were derived from the 2010 Census.
The CDS and No-Stat files were obtained from Compact Information Systems.
Locatable addresses from the No-Stat file (excluding internal drops) were merged onto the CDS file. To avoid multiplicities on the combined frame, addresses appearing on both files were removed from the No-Stat file.
Under the specified PPS design, the expected distribution is the weighted distribution of the list of area segments, where the weight is the size measure.