Introduction
Subtle differences in response option order can affect survey data (Krosnick and Alwin 1987; Schuman and Presser 1981; Schwarz et al. 1985, 1991; Tourangeau, Rips, and Rasinski 2000; see Schwarz and Hippler 1991, for a review). Survey respondents expect response options to follow a hierarchical format, such as decreasing in importance (i.e., left and top mean first), and they take longer to respond when the format is inconsistent with this expectation (Tourangeau, Couper, and Conrad 2004). These expectations persist regardless of culture, primary language, and whether people are accustomed to increasing or decreasing scales (Chan 1991; Toepoel et al. 2009). Respondents have consistently demonstrated a bias to items presented first – for example, respondents rate the reputation of their college higher when Strongly Agree is on the left (Friedman, Herksovitz, and Pollack 1994), respondents rate items as “describ[ing] me very well” more often when this option appears first (Chan 1991), and participants look at and select the first few options in a list of response options more often than items at the end of the list (Galesic et al. 2008). Thus, design decisions can have large implications for survey data validity.
The intention to join the military is often measured using a single ordinal item, “What is the likelihood that you will serve in the Military in the next few years?”(e.g., Ford et al. 2013) For the sake of convention and comparability across studies, the response options are typically presented in the following order: Definitely, Probably, Probably Not, and Definitely Not. However, this convention may affect data when the other items in the survey are displayed in the opposite order: Definitely Not, Probably Not, Probably, and Definitely. From a user’s experience perspective, the inconsistent direction of the response options can pose a problem, as people may not recognize that the order has changed, and thus, they may select the incorrect response option. The present study examines this concern by manipulating response option order on the intention to join the military item on a web-based survey.
The intention item was embedded within a survey comprised entirely of items with negative response options listed first. Two versions were fielded: one in which Definitely was presented first and one in which Definitely Not was first. We hypothesized that the “negative first” convention would hold for successive items, and consequently, respondents would select the left-most option more often, and the resulting data would show that intention to join is higher when Definitely is presented first compared to when Definitely Not is presented first.
Method
Participants
Respondents (ages 16 to 24) first completed a self-administered paper survey about media habits and opinions. They were selected using address-based probability sampling, and the entire sample was weighted to be representative of the U.S. population in terms of gender, race/ethnicity, Census division, and education. Respondents refusing more than 75 percent of the survey items were excluded, and removal of these cases occurred before weights were computed.
All respondents who reported using social media were then invited to participate in a follow-up web-based survey, in which the experiment was embedded. There were 1686 young adults (Mage=20.27, SE=0.03) who participated. The sample was mostly white (63 percent) and evenly split across gender (57 percent female).
Procedure
Among items about lifestyle habits and preferences, all participants were asked: In the next few years, how likely is it that you will be serving in the Military? Respondents were randomly assigned to one of two experimental conditions: one in which Definitely was presented as the first response option and one in which Definitely Not was presented first. In order to ensure an adequate sample for the primary study, 70 percent received the control condition, and 30 percent received the experimental condition; thus, there were more participants in the control condition, in which Definitely appeared first (see Table 1 for participant demographics). The power to detect a small effect under a 0.05 alpha level was 0.96, which exceeds the generally accepted cutoff representing sufficient power, 0.80.
All analyses were conducted using Stata version 12.1 (StataCorp, 2011), and we accounted for the stratified survey design using the svy prefix. We compared the means and distributions of responses (including refusals) by conducting a series of between-group comparisons.
Results
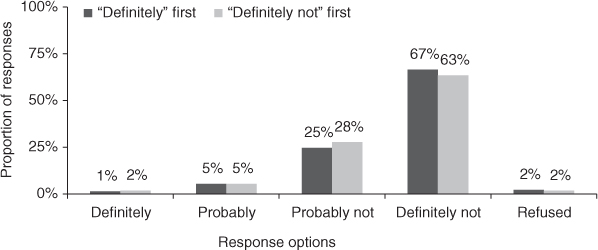
We conducted an ordinary least squares (OLS) logistic regression and a two-way chi-square of experimental condition and propensity response. As can be clearly seen in Figure 1, regression results indicated that average propensity did not differ as a function of response option order. That is, intention to join the military was the same regardless of whether Definitely (M=1.40, SE=0.02) or Definitely Not (M=1.45, SE=0.03) was presented as the first response option, B=–0.04, t=1.07, p=0.28. Response order did not affect the distribution of responses or nonresponses, Ïx2 (4)=2.80, p=0.73, and most respondents selected Definitely Not, followed by Probably Not, regardless of where they appeared in the response option order.

Conclusions
In this research note, we demonstrate that contrary to previous findings on the effect of response scale characteristics on survey data, response option order did not alter a single-item ordinal measure of intention to join the military. This finding has implications for surveys that use the same question but that may have different response scales. Our findings demonstrate no effects in this case – the order of response option presentation did not affect respondents’ selection for this item.
There are several limitations to our study. First, we did not have the opposite order experiment – one in which all the other items on the survey were positive first. It is not clear if swapping the presentation order of all the other items would yield a similar effect. Second, intentions to join the military may be less susceptible to response order effects than other psychological constructs. More malleable concepts, such as attitudes toward products and services, may be more susceptible to order effects. Third, we did not manipulate the axes (i.e., vertical vs. horizontal), and it is not clear if the “top means first” expectation would have been revealed with such a manipulation.
Future research should examine other constructs and whether the response order effect is insignificant with fixed constructs. Research may also examine the effect of other factors, such as the visual design of the response scale (Christian and Dillman 2004; Toepoel, Das, and Soest 2006), and the mode of data collection (Ye, Fulton, and Tourangeau 2011) on intentions to join the military and other constructs. Such factors may or may not influence fixed constructs.
Nevertheless, our study demonstrates that changing the order of response options for one item on a survey such that the order is inconsistent with the rest of the survey does not affect data quality. Despite the limited data we have provided here, our study is a small step in the direction of identifying visual modifications that may or may not affect survey data quality.
Author Note
This report is released to inform interested parties of research and to encourage discussion.
Any views expressed on methodological issues are those of the authors and not necessarily those of Fors Marsh Group. This research was based on data from the U.S. Department of Defense. The views, opinions, and findings contained in this paper are solely those of the authors and should not be construed as an official Department of Defense position, policy, or decision, unless so designated by other documentation.