In the mid-1970s, telephone surveys suffered from an inherent lack of efficiency. As a direct result, survey costs were considerable both in terms of labor and of time. The efficiency problem was not satisfactorily resolved until the advent of the single-stage list-assisted approach in the 1990s. This approach has been “industry-standard” since, thanks to its lack of clustering, increased efficiency, and ease and timeliness of application (Kulp 1994; Lepkowski et al. 1988).
Now, we see history repeating itself with cell phones. They are significantly more expensive and inefficient to dial compared to landlines. Absent listed databases for cell phones, one cannot “scrub” zero banks out of the sampling frame to increase efficiency via the list-assisted method. Other methods to improve efficiency, such as the Mitofsy-Waksberg technique (Waksberg 1978) fail because there is little predilection for certain working banks of 100-series or 1,000-series telephone numbers more than other banks.
In 2012, sampling companies began to offer “recent activity flags” for cellular samples, that is, an append denoting for each sample record whether it is actively working.[1] The promise of this new sample append is apparent: If it is accurate, it offers the potential of dramatically reducing nonworking numbers in a sample, thereby increasing efficiency and lowering cost, without a meaningful loss of coverage.
In this paper, we assess the efficacy and validity of activity flags in “scrubbing” out inactive numbers. First, we examine the degree to which excluded cell phone numbers based on activity flags correctly sequesters nonworking numbers without incorrectly excluding valid households. Second, we assess the potential bias stemming from the exclusion of eligible households from the overall sample of cell phone numbers dialed. Finally, we gauge the relative savings in cost as a result of excluding sample based on activity flags.
We test two different offerings of recent activity flags, one from Targus and another from Marketing Systems Group’s proprietary Cell-WINS service. The recent activity flags offered by both Targus and Cell-WINS denote sample as active, inactive, or unknown.
Data and Methods
To explore the questions of efficacy and coverage of recent activity flags, both Targus and Cell-WINS flags were appended to one wave of the SSRS EXCEL omnibus survey. EXCEL has been running consecutively for 26 years as a national, weekly, and (since 2009) overlapping dual-frame bilingual telephone survey. Each weekly wave consists of 1,000 interviews, of which 400 are completed with respondents on their cell phones, and a minimum of 35 interviews are completed in Spanish. Data for this research were drawn from all cell phone samples used for the April 24, 2013 wave, for a total of 23,750 cell phone sample records. The response rate (AAPOR RR3) for the cell phone frame was 9.8 percent.
By design, omnibus surveys are short-field studies and attain low response rates. To address this concern, the sample from this wave of EXCEL was “rolled-over” to the next two subsequent waves of the omnibus, allowing up to 18 call attempts on all active sample, with refusal conversions made to all initial refusals and callback scheduling for up to 3 weeks. The conversion attempts were made at least 1 week after the initial refusal (see Triplett 2001). In addition to the 444 interviews made in the first wave of the sample, an additional 350 were conducted in the second and third waves. Overall response rate for this composite three wave study was 17.1 percent.
Additionally, the CATI system was set in the second wave to ring at least eight times before disconnecting, in order to ensure that we were able to trigger every voice mail system, thereby minimizing the number of “no answer” dispositions attained in the sample. This is critical in order to attain an accurate measure of the percent of valid households one might be discarding when choosing to “scrub” inactive sample. After one wave, 7,861 records had attained an unknown household disposition (33.5 percent). This was reduced through three waves of calls to 3,879 cases, 16.3 percent of sample.
Still, one must make an estimate of the percent of the unknown households that are in fact households, in order to generate a final overall estimate of households. This estimate is commonly known as e, and is calculated proportionally in AAPOR response rates. However, in order to attain a more accurate measure of e, researchers have developed alternative calculations using paradata and different analytical approaches (Smith 2009). In addition to the common AAPOR/CASRO method of calculating e, we provide estimates of e utilizing survival analysis (Brick, Montaquilla, and Scheuren 2002) as well as a conditional probability approach similar to that utilized in Kennedy et al. (2008).
We assess bias by first reporting on bivariate comparisons of activity flag codes to the full range of demographic and sample-level variables provided in the EXCEL omnibus (see Appendix). Because interviews in sample flagged as inactive will prove to be hard to come by, a single wave of the omnibus was insufficient to attain a reasonable sample size in these groups. From prior testing, we had available the activity flags for Cell-WINS in a total of eleven omnibus waves, and six waves for Targus. This provided 128 interviews in sample we deemed eligible for exclusion in Cell-WINS, and 68 interviews in Targus, out of 3,645 interviews overall.
Importantly, assessing potential bias must be explored in three stages. First, we explore differences between included and excluded sample. Second, we compare nonexcluded data to the full sample, that is, data without any of the excluded sample. Finally, we assess the impact in a typical survey such as the EXCEL omnibus, where 40 percent of interviews are attained via cell phones and the rest with landlines. Of course, at each stage, the bias will be significantly reduced given that the excluded sample becomes a smaller and smaller percent of total sample.
Our final analysis, on cost, is straightforward. Specifically, we compute the sum of labor hours used to work the sample by active, inactive, and unknown status. Total call time in seconds is provided by the CATI software and serves as an excellent and precise measure of costs. However, the measure is incomplete since it only begins timing when a call picks up. To compensate, we added time for each call to ring before getting picked up by a potential respondent or terminated after a number of rings by the interviewer. No answers and answering machines were given 20 seconds to accommodate the necessary rings; other dispositions all received 10 seconds assuming calls that were answered more quickly. With this time added to the time recorded in the CATI system, the total hours of all call attempts matched the total hours recorded by telephone interviewing supervisory staff and the interviewers themselves. We conduct this analysis for the first wave of the high-effort omnibus as well as for the entire three-wave effort, to test whether there are noticeably different savings based on survey effort.
Results
Estimate of Excluded Cell Phone Households
Table 1 provides the distribution of the two samples by activity flag. Overall, there is a major difference in the generalized flags. Less than 1-percent of the numbers in Cell-WINS are of unknown status compared to one quarter of sample flagged by Targus. As a result, Cell-WINS has a larger percent of active (63 percent vs. 55 percent) and inactive (37 percent vs. 20 percent) sample compared to Targus. Given the dearth of unknown records in the Cell-WINS sample, the analyses here collapse sample records with an unknown activity status into the inactive sample flag.
Table 1 also provides the final dispositions attained in the study across the two providers and types of activity flags. Targus inactive sample is strikingly different than inactive sample for Cell-WINS. Most interesting is that 43 percent of inactive Targus sample are confirmed valid cell phone households. Notably, it is the Targus unknown sample that best serves to exclude nonworking numbers without also excluding a large percent of eligible households. Specifically, 11 percent of Targus unknown sample was found to be valid cell phone households. This compares to 7 percent of inactive Cell-WINS sample that are eligible households. Overall, Targus unknown sample comprises of 25 percent of total sample compared to 37 percent of total sample that is Cell-WINS inactive.
Using just the final dispositions, we find that only 5.4 percent of all cell phone households were flagged through Cell-WINS as inactive, and only 5.9 percent were flagged through Targus as unknown (see Table 1). Seventeen percent of sample that attained an unknown household disposition fell into the Targus unknown flag; the same was true for 25 percent of Cell-WINS inactive sample. In terms of the efficacy attained in excluding sample, it is of note that while 83 percent of ineligible records resided in the inactive Cell-WINS sample, only 54 percent of ineligibles are in the unknown Targus sample.
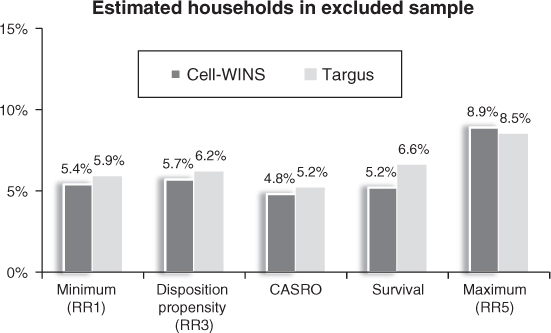
Figure 1 illustrates the results of our comparison of different e calculations, in order to assess the percent of excluded sample that reach valid households. The lower bound RR1 estimate assumes that none of the unknown-if-eligible sample is eligible, and simply calculates the percent of confirmed households that reside in each excluded sample, which for Targus unknown sample and Cell-WINS inactive sample (see Figure 1) is 5.9 and 5.4 percent respectively, referring to the percent of final dispositions that were eligible and in the excluded samples. The upper bound estimate (RR5) assumes that all unknown-if-eligible sample is considered eligible. Thus, the upper bound is 8.7 percent for the Targus flags and 11.8 percent for Cell-WINS sample.

The CASRO proportional allocation (RR3) method finds an e of 0.87 for Cell-WINS active sample and 0.08 percent for inactive sample. For Targus, e is 0.72 for active/inactive sample and 0.12 for unknown sample. Overall, the CASRO method finds that 5.2 percent of eligible households are in Targus unknown sample, and 4.8 percent of households in the Cell-WINS inactive sample.
The survival method found significantly higher estimates of e compared to the CASRO method, specifically, 0.97 for active sample and 0.22 for inactive sample for Cell-WINS, and 0.74 and 0.38 for Targus sample. Yet importantly, the stark difference between the e for each sample is the driving force in the overall household estimate, since the greater this difference the greater the number of households are estimated into active rather than inactive sample. Overall, the net result of survival analysis finds an estimate of 6.6 percent of all households residing in Targus unknown, vs. 5.2 percent residing in Cell-WINS inactive sample.
Finally we utilized a conditional probability method that explored the evolution of sample that was ever dispositioned as either an answering machine (that the interviewer determined was not clearly residential), no answer, or busy, and investigated the degree to which such sample has the propensity to later result in an eligible household or an ineligible number. This procedure arrives at a total estimate of 5.7 percent of eligible cell phone owning households that reside in Cell-WINS inactive sample. The same process was repeated with Targus inactive sample, with similar results: a final estimate of 6.2 percent of all eligible households among those originally flagged as unknown.
The Question of Bias
Overall, then, with about 6 percent of households residing in the proposed excluded samples, are these households meaningfully different than those included? Table 2 provides the condensed results of this extensive analysis. Differences were tested across 15 different variables. The left column provides the unweighted estimates attained by dialing the full cell phone sample. The subsequent columns provide difference scores. For example, in the Cell-WINS columns, “active – inactive” represents an estimate attained with just active sample minus the estimate attained from inactive sample. Using the northeast region estimate as an example, in Cell-WINS we find a difference of 6.6 percent. As a negative number this indicates that the active sample attained an estimate 6.6 percent lower than the inactive sample. But again, while the active – inactive difference scores reveal the raw difference between these two estimates, the concern is whether the exclusion of inactive sample results in meaningful survey bias. This is measured in the subsequent two columns. “Total cell – active” is the difference score between the full cell phone sample without any exclusions and the active sample. “Total telephone – (LL + active)” shows the difference for the full dual frame sample, unweighted, compared to the dual frame sample without inactive cellular sample.
On average, inactive Cell-WINS sample attains estimates with a real (absolute value) difference between active and inactive/unknown sample of 6.3 percent. Targus attains a slightly lower difference score of 6.0 percent. Many specific variables show substantially larger differences. But these differences are reduced greatly when considering the full cellular sample and active Cell-WINS or active/inactive Targus sample. Overall, there is only a 0.2 percent difference on all 15 variables for the Cell-WINS flagging and the average overall bias for utilizing active/inactive Targus sample versus all cell samples is only 0.3 percent. In short, since so few eligible households reside in the excluded samples, relatively meaningful differences in the active – inactive and active/inactive – unknown difference scores translate into very little difference overall.
When we consider cellular sample in the context of a dual frame survey (in our analysis, where cell phones comprise only 40 percent of the total sample), the overall average bias introduced by the exclusion of sample is only 0.1 percent for Cell-WINS and 0.2 percent for Targus. Even income, which is on average an 11 percent difference among the samples, only produces under a 0.1 percent skew on income in a typical dual-frame study.
Cost Analysis
A final analysis assesses the relative cost savings in dialing only active Cell-WINS or active/inactive Targus sample. Table 3 provides the results of cross tabulations on cost, by furnishing the difference to the overall rate for each specific sample type as well as the difference of excluded sample to included sample. Overall, as anticipated, the Targus unknown sample and the Cell-WINS inactive sample attains quite low productivity rates. These samples require at least 5 hours of interviewer labor to attain a single telephone interview.
The most meaningful metric of importance is the difference between dialing the full sample and dialing only Targus active/inactive or Cell-WINS active sample. Based on a single wave of omnibus, completes per hour improved 11 percent for Targus and 21 percent for Cell-WINS. Using the high-effort three-wave methodology, rate improved for Targus by 8 percent and the improvement was 13 percent for Cell-WINS.
Conclusions
As the list-assisted landline approach to increasing efficiency came into practice, the principal concern of survey researchers was whether such methods significantly reduced the coverage of telephone households. In 1995, Brick et al. found the coverage gap to be 3.7 percent, a figure the survey industry was accepted as being too low to raise significant concern over survey bias. This number has clearly risen over the years, though by how much is up for debate. Because of voice over IP and other factors, more recent published estimates have approached as much as 20 percent (Fahimi, Kulp, and Brick 2009), though others (Boyle et al. 2009) find that about only 5 percent of eligible landline households reside in zero banks. It is important to note that Boyle et al. found that while some differences between zero bank households and listed bank households are significant, for example a 17 percent gap in the percent of households with children, a 35 percent gap in home ownership, and other significant differences by income, age, and employment status, the total amount of bias, that is the comparison of listed bank households to all households, is relatively small, again because only 5 percent of households in their data are found to reside in zero banks. Thus, for example, the 17 percent gap in the presence of children translates into only a 1 percent difference of listed households to all households. A separate analysis exploring the same issues of bias in excluding zero-banks found comparable results (Dutwin et al. 2009).
The results in this paper are entirely consistent, in other words, with estimates of survey error introduced in the near universal use of list-assisted sample methods of telephone research in the past 20 years. Like the estimates noted above, we find that excluding Targus unknown sample or Cell-WINS inactive sample reduces the coverage of all cell phone households by 5 to 6 percent. Second, we find that on many measures the differences between excluded and included households is insignificant, but with some notable exceptions, such as with income, home ownership and metropolitan status. And again similar to analyses of zero bank households, we find that the real error introduced by the exclusion of unknown or inactive sample is on average less than a half of one percent and is even less when considered as part of a dual-frame design that includes landline interviews. Finally, we find that by excluding Targus unknown sample or Cell-WINS inactive sample improves productivity significantly. Given these findings, we find that excluding inactive/unknown Cell-WINS sample or unknown Targus sample is an appropriate sampling technique for increasing the productivity of cell phone samples without substantial reduction in coverage or an increase in potential bias.
“Actively working” is defined as a telephone number reaching a person who uses the telephone for personal calls.