Introduction
Wireless-only households are common and growing. This already critical issue has captured the attention of public opinion associations who have weighed in with guidance (American Association for Public Opinion Research 2010). As more researchers aim to contact respondents via wireless telephones, this issue will become even more critical.
Despite post-stratification adjustments for wireless omissions, bias remains, especially among young adults (Call et al. 2011). In recognition of this, nationwide surveys such as the National Immunization Survey (NIS) and the Behavioral Risk Factor Surveillance System (BRFSS) have begun to include dual sampling frames of landline and wireless communication (Centers for Disease Control and Prevention 2012; Pierannunzi et al. 2012).
With the advent of telephone number portability, individuals may change geographic location while retaining an area code and exchange associated with an old geography (Link, Town, and Mokdad 2007). For example, young adults may move to attend college out-of-state, retaining their old telephone number. If they reside in a wireless-only household, this creates an “unreachable” segment of the population for geographically-based random digit dialing (GBRDD); they are unreachable in the sense that no surveyor conducting a small area survey would attempt a New York City, Atlanta, or Birmingham area code and exchange in hopes of reaching a respondent in their target market of Mississippi.
Even clever alternative sample designs would not address the small geography problem (Link and Lai 2011). For example, in the most recent estimate based on the National Health Interview Survey (NHIS), almost half (42.3 percent) of adults aged 18 and over lived in wireless-only households in Mississippi, while 58.6 percent of children under age 18 lived in wireless-only households in Mississippi (Blumberg et al. 2012).
Cell phones are especially common among younger adults. Students frequently bring their cell phone (and associated telephone number) with them to school and are increasingly foregoing landlines for a wireless-only. From a researcher’s perspective, this presents a problem when attempting to conduct random digit dialing (RDD) telephone surveys for small geographic areas such as cities and counties. We measure the extent of cell-only population growth among a targeted population to determine the nonreachability of this population.
Oktibbeha County, home to Mississippi State University (MSU), is like most college-centered towns/communities – an extreme case of in-migration. This in-migration, especially by young adults who exclusively use wireless telephones, creates a lapse in the estimated reachable population for these areas. In fall 2012, total enrollment at the main campus (Starkville) was 19,810 (Office of Institutional Research 2013), comprising almost half the total community’s population of 47,741. The proportion is much greater within the 18–24 years of age category.
Data
The data that we used were provided by the MSU registar’s office . It consisted of currently enrolled (fall 2012 semester) MSU students. The (deidentified by way of incomplete inforamtion) variables were:
- Incomplete cell telephone number (area code and exchange)
- Incomplete local residential telephone* (area code and exchange)
- Incomplete local residential mailing address (city, county, state)
- Incomplete permanent home mailing address (city, county, state)
- Student’s year of birth
- Student’s gender.
*Note: These were the categories that were filled in by students. Thus, the residential telephone could be either a landline or cell phone, local or not.
In 2012, the estimated population of Oktibbeha County (including the MSU campus and the City of Starkville) was 47,741, and 11,860 were estimated to be between 18 and 24 years of age. Total enrollment at MSU of 18–24 year olds was 14,570. Of those, 8,778 were estimated to live in Oktibbeha County, based on their local address. Of these students living in Oktibbeha County, only 1,388, or 15.81 percent had a phone number with a local area code and exchange.
Methods
In order to determine if an MSU student actually lived in Oktibbeha County (and thus might be reachable by a geographically-based landline), we included only those who claimed a local residency in a town within this county via their local address. We then eliminated all students who did not have a 662 area code. Within the 662 area code, we removed all who did not also have one of the telephone exchanges listed for Oktibbeha County. This population was labeled as potentially ‘reachable’ and everyone else was coded as ‘unreachable’ from an Oktibbeha County landline. From this we compared the total 18–24-year-old population for Oktibbeha County to 18–24-year-old MSU students living in Oktibbeha County with a reachable local telephone number.
Findings
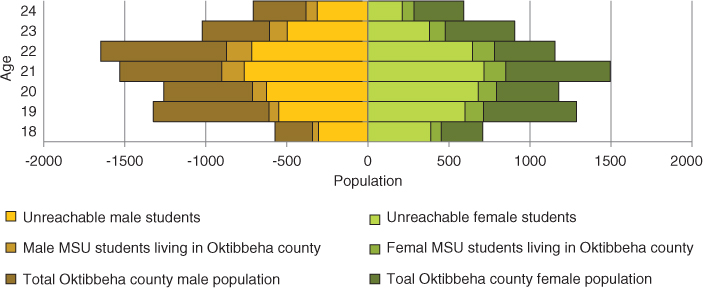
MSU students who live in Oktibbeha County/City of Starkville comprise 74 percent of the total Oktibbeha County 18–24-year-old population (Figure 1). Of 18–24-year-old MSU students living in Oktibbeha/Starkville, taken from the ‘home addresses provided by the student, only 15.8 percent are reachable via a telephone number listed for this county. The percentage of nonlocal telephone numbers is highest among the youngest students (likely recent movers), and the percentage declines as the students get older while remaining local. For example 89.4 percent of male MSU students age 18 do not have a local telephone number. However, by age 24, this percentage has dropped slightly to 81.9 percent, which is still a substantial ratio. When we blend MSU students with nonstudents in the county, 53.0 percent of males, age 18 do not have a local telephone number.

We have converted the data to a population pyramid. Each of the bands measures a one-year age category and gender is represented with males to the left and females to the right of the center line. Each bar consists of three layers. The base bar (the entire longest bar extending through the dark brown/green portions) is total county population for one age and sex category. The next layer bar is the MSU student population overlaid on the total county population. The top (lightest color) bar is the number of MSU students who do not have a local telephone number. We do not have data on wireless-only individuals or families in the non-MSU population, but we estimate this is more than a third (perhaps higher) based on statewide numbers.
Thus, half of Oktibbeha residents in the 18–24 age range are unreachable via a local landline. When the focus is narrowed to just university-enrolled students in the county, the unreachable percentages rises to the 75 percent to 90 percent range (Table 1).
Limitations
There are several study limitations that are noteworthy. We have measured individuals, as opposed to households, as people tend to be the unit of analysis in most surveys. Most importantly, the university does not have a definitive variable that measures whether a student lives in Starkville, on the MSU campus proper (e.g., dorms or fraternal housing) or in Oktibbeha County. Thus, we must infer from the student-provided local telephone number and mailing address. The existence of a satellite campus in Meridian confounds the issue of residency. Although a student is enrolled at MSU, he or she may be attending classes at a satellite campus and living in that community. These numbers can also be confounded by additional students who are in a cooperative education or who are in a study abroad program. Small numbers of students might report that they are not local simply to get around departmental policies (e.g., those that restrict residential students from taking distance courses). Finally, the university does not require students to regularly update their local contact information on file with the university; rather, they are given the option to update each semester when they register for classes. Thus, many students might have out-of-date contact information.
Conclusions
The 18–24-year-old demographic is a vital population subgroup for many research studies. We have quantified, in the limited case of a single college-dominated town, that half of city/county residents age 18–24 did not have telephone numbers that were geography-based land-lines. Anyone seeking to interview MSU students in a phone survey will find that some 90 percent are unreachable by landline. While it is highly unlikely that a landline RDD methodology would be employed for a single county, which methodology has been used for multiple-county regions to measure local issues or sample a specific population. To our knowledge this is the first time that the “unreachable” population has been measured in any systematic way.