Introduction
Address-based sampling (ABS) has become a promising alternative to random digit dial telephone surveys. ABS uses residential address frames derived from the U.S. Postal Service Computerized Delivery Sequence file. The ABS frames maintained by reputable vendors provide nearly complete coverage of residential addresses in the United States (Iannacchione 2011). Furthermore, the ability to mail to the addresses, to locate the addresses for in-person interviewing, and to append landline telephone numbers to the addresses offers a variety of choices in data collection methods.
Here, we evaluate the quality of demographic information appended to the ABS frame and examine the possibility of using these appended demographics to guide survey design. Such information could be used for stratification at the sample design stage or to adjust for or examine potential nonresponse bias after data collection. It should be noted that the sources and quality of these appended variables vary by vendor. The sample used for this research was provided by Marketing Systems Group. The following variables were considered in this evaluation:
- “Only way to get mail” post office box
- Landline telephone number
- Presence of surname
- Presence of children in the household
- Educational attainment of householder
- Ethnicity of householder
- Gender of householder
- Annual household income
- Home tenure
All of the variables are appended through address matching, so they are address-level (not person-level) characteristics and might not correspond to the current residents of the address.
We evaluate the quality of the appended variables by comparing these data to information reported by survey respondents to the 2011 Field Test of the National Household Education Surveys Program (NHES). The ability to use ABS frame information for stratification is evaluated by examining the effect of oversampling targeted subgroups on nominal and effective yield for the subgroup and on overall effective yield.
Sponsored by the National Center for Education Statistics, NHES is a set of periodic education surveys that cover topics related to the care and education of children and adult education. The surveys included in the NHES: 2011 Field Test targeted two subgroups: school-aged children (kindergarten through 12th grade [K-12]) and children ages 6 years or younger who had not yet started kindergarten. The Field Test contained a nationally representative sample (n=41,260), along with a supplemental sample of addresses that were more likely to contain Spanish speakers (n=18,740). All of the analyses presented here are restricted to the nationally representative sample.
The NHES: 2011 Field Test used two-phase sampling with mail data collection mode in both phases (Montaquila et al. 2013). The first-phase survey (i.e., screener) was to determine whether a sampled address had any eligible children. Items collected in the screener included the age, gender, school enrollment, and grade for each person of age 20 or younger living at the sampled address. Any first-phase responding household with at least one eligible child was sampled for a second-phase or topical survey. Only one child was sampled per household, and the appropriate topical questionnaire was sent to the parents/guardians of the sampled child.
Concordance of Appended Demographic Information with Survey Respondent Information
We first examined presence of children based on the information provided in the NHES screener. Both true and false positive rates were computed. The true positive rate, defined as the percent of screener responding households with children where the appended variable also indicated children, was 41 percent. The false positive rate, defined as the percent of screener responding households without children where the appended variable indicated children, was 31 percent. These rates suggest that presence of children as indicated by the appended variable is highly inaccurate and should be used with caution. One caveat of this analysis is that in NHES, presence of children is defined as having at least one child age 20 or younger who is not yet enrolled in school or who is enrolled in grades K-12, whereas the appended variable indicates addresses thought to have at least one child age 18 or younger regardless of enrollment status.
Four other items collected in the topical questionnaire were included in this analysis. These characteristics include parents’ highest educational attainment (5 levels), Hispanic ethnicity, household income (4 levels), and home tenure. Concordance was measured both including and excluding cases with missing data for the appended variable. When cases missing the appended information are included, the denominator consists of all topical respondents and the concordance rate is referred to as “true concordance rate” below. This rate measures the proportion of cases for which the appended value matched the respondent report. For the second rate, the denominator includes only the topical respondents with non-missing appended demographic information; even if this rate is high, the appended item could have very limited utility if its missing rate is high.
Table 1 gives the results. When cases with missing data for the appended variable are excluded, Hispanic ethnicity matches about 92 percent of the time; however, the true concordance rate is only 64 percent. Among cases with non-missing appended data, home tenure matches about 87 percent of the time, but the true concordance rate is 75 percent. Household income and educational attainment have lower concordance rates.
Efficiency of Using Appended Demographic Variables for Stratification
Six of the appended demographic variables were analyzed to determine their potential use for stratification. These included: whether household annual income is less than $40,000, presence of children in the household, whether parents’ highest educational attainment is less than high school, home tenure, Hispanic ethnicity, and Hispanic surname. For each characteristic, strata were defined using the appended variable (including cases with missing data), and NHES topical respondent data were used to compute misclassification rates. For each variable, we examined several scenarios involving different oversampling rates for the stratum containing the subgroup (based on the appended variable).
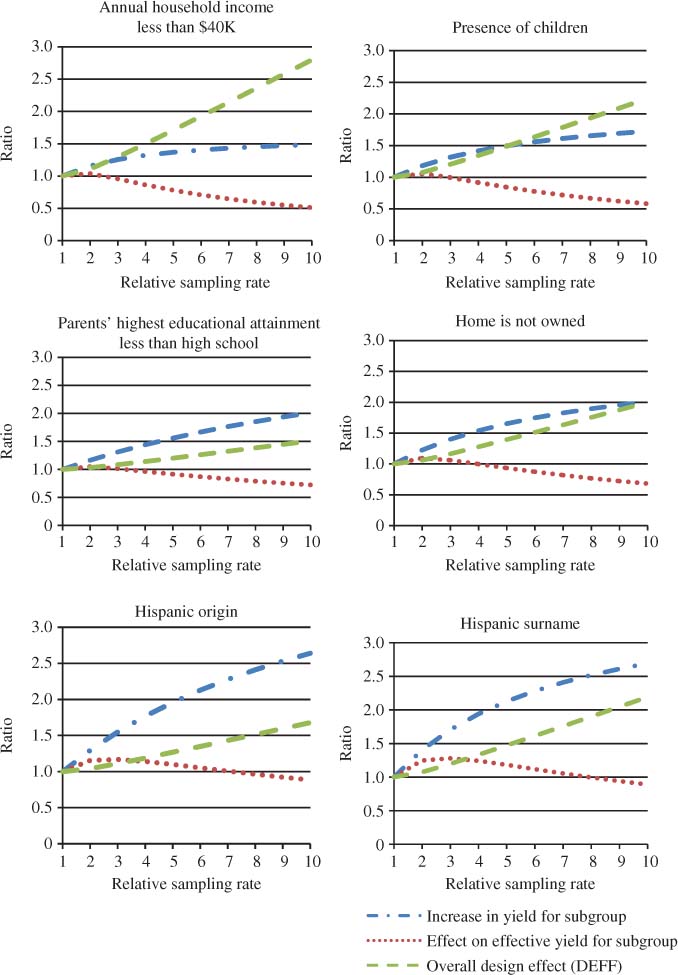
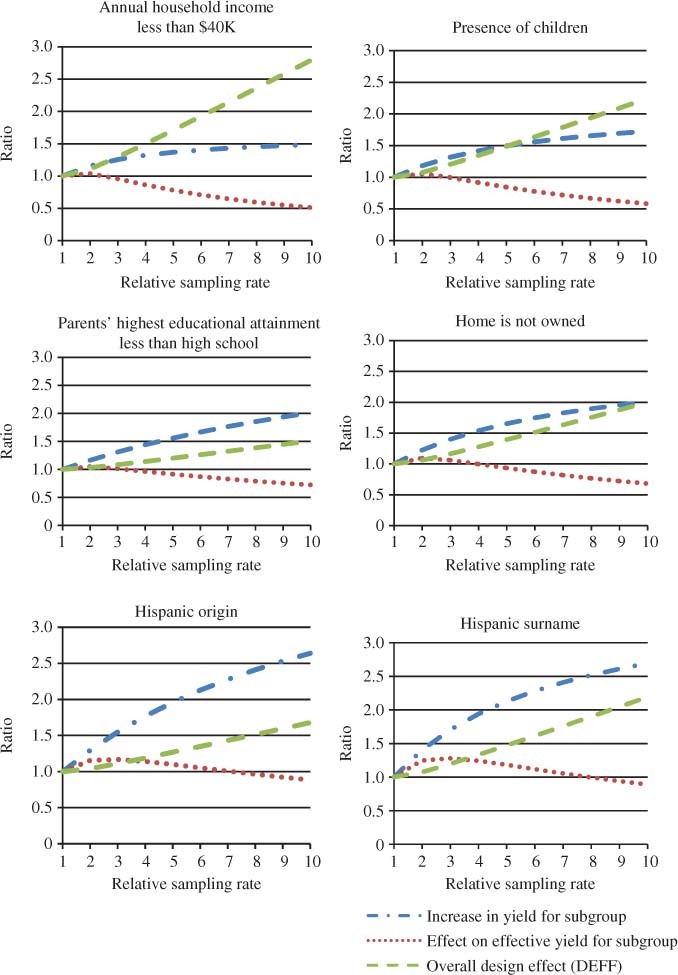
We used three measures to quantify the effects of oversampling: the overall design effect (DEFF) due to differential sampling, the nominal increase in yield for the subgroup, and the effective yield for the subgroup (which accounts for the design effect due to differential sampling as well as misclassification). Figure 1 plots the three measures as the relative sampling rate for the targeted subgroup increases from 1 to 10. (The non-targeted subgroup is sampled at a relative rate of 1 in all scenarios.) For each characteristic, the nominal yield for the subgroups can be increased by heavily oversampling the high-density stratum. However, for household income less than $40,000, we observed poor results for effective yield when sampling at twice the rate or higher for low income households. We saw similar patterns for presence of children, parents’ highest educational attainment, and home tenure. Slightly modest increases in effective yield for higher sampling rates may be possible when stratifying by Hispanic ethnicity or Hispanic surname.
The Hispanic ethnicity variable actually has three values: Hispanic ethnicity, ethnicity other than Hispanic, and missing. As an alternative to the approach described above, the same measures were computed using a three-stratum design; those identified as Hispanics are oversampled most heavily and those with missing ethnicity are sampled at a relative rate between 1 and the rate for Hispanics.
Table 2 shows the results when the relative sampling rate for Hispanics is held at three times the rate for non-Hispanics, the relative sampling rate for non-Hispanics is held at 1, and the relative sampling rate for missing cases is 1.1, 1.3, or 1.5. While further increases in nominal yield could be obtained for Hispanics when the missing data stratum is also oversampled, the overall DEFF is much larger than in the two-stratum design. Therefore, if estimates for Hispanics are of particular interest and overall estimates are not a priority, this stratification scheme may be of use, but otherwise using the two-stratum design may be a better choice.
Discussion
In this study, we examined the quality of the variables appended to the ABS frame and discussed the viability of using such variables to improve sample designs. Our general conclusion is that for the variables we considered, we do not believe the data are of sufficient quality to be used for stratification purposes. We measured concordance between the appended variables and the respondent reports for several key demographic variables. Of the NHES screener responding households with children, the appended variable indicated presence of children for only 41 percent. Among the four variables we evaluated, only home tenure and Hispanic ethnicity had concordance rates that were better than what could be obtained with a flip of a fair coin.
We assessed the potential of using certain appended demographic variables for stratification purposes. We concluded that oversampling target subgroups defined by household income, presence of children, parents’ highest educational attainment, or home tenure (and oversampling in the high-density stratum) does not improve the effective yield of the respective subgroups. Stratifying by Hispanic ethnicity or surname and oversampling in the high-density stratum may result in modest increases in subgroup effective yield at the expense of overall effective yield. Further research is needed to compare this approach to the approach that uses aggregate data (e.g., tract-level percent Hispanic from the American Community Survey) for stratification.
One limitation of this study is that validation information is only available from NHES survey respondents, which limits the set of variables that could be examined. Additionally, the respondent-provided information is treated as the “truth”; any measurement error in these responses is not accounted for in this analysis. Finally, while we expect some variation in the quality of the information provided on ABS frames as a result of differences in the vendors’ sources and approaches, the same issues likely apply to other vendor data. However, as the details of the vendors’ methods and sources are proprietary, we are unable to address this final caveat directly.