


Assessing the “mood of the country” has become a staple in the diet of American public opinion polling (Hugick and DiAngelo 2006; Ladd 1992). Major polling organizations routinely ask questions about whether Americans are “satisfied or dissatisfied with the way things are going in the United States at this time” or whether “things in this country are heading in the right direction or off on the wrong track.” However, as Hugick and DiAngelo (2006) rightly remind us, “Interpreting the results of these direction questions is a challenge for professional pollsters, let alone more casual consumers of national media polls.”
What do changes in these mood indicators actually mean? Do the readings of the “mood” mean the same thing at one time as they do at another? If not, in what sense are they leading or misleading indicators of the “the mood of the country”? These are among the questions we address in this investigation.
Comparability of Question Wording, Order, and Context
Hugick and DiAngelo (2006) analysis addresses two key challenges to interpreting the results of the “mood of the country” indicator: comparability of question wording and comparability of question order. Hugick and DiAngelo (2006) have demonstrated that the variously worded versions of the mood item produce similar results, once the data are adjusted for differences among survey houses in the percentage of volunteered “don’t know” responses. As to question order and context, Hugick and DiAngelo (2006) analysis of six question order experiments with presidential approval and national mood items in Newsweek polls did find some evidence for order effects, particularly in two polls conducted just prior to the 2004 election. But when the data for all six polls were combined, none of the order effects achieved statistical significance. In sum, the jury on order effects is still out.
Temporal Comparability of Meaning
The problems of interpretability posed by differences in the wording and context of “mood” indicators pale by comparison with a more fundamental problem: variability over time in the meaning-and-interpretation of identically worded and sequenced questions. A cardinal assumption researchers make in asking any survey question is that it should mean the same thing to all respondents (Bishop 2005; Brady 1985; Foddy 1993). Fowler (1995, p. 84) has expressed essentially the same psychological stimulus principle in his recommendations for improving the wording of survey questions: “A survey question should be worded so that every respondent is answering the same question.” Furthermore, as Groves (1989, p. 450) has noted, “Although the language of the survey questions can be standardized, there is no guarantee that the meaning assigned to the questions is constant over respondents.” This becomes critical because “A fundamental tenet of scientific measurement is that the measuring device is standardized over different objects being measured” (Groves 1989, 449).
A corollary to the same psychological stimulus principle is that the question should also mean the same thing to respondents at time two that it did at time one: the constant psychological stimulus principle (Bishop 2005). As Nie and his colleagues (1979, p. 11) have captured the issue, “Even if the same question is asked at two different points in time, is it really the same question? The fact that times change may mean that the meaning of the question undergoes change.” And if so, this violates the fundamental invariance of meaning assumption we make in trend analysis.
The objective of our investigation is to demonstrate this problem of comparability in meaning, using the “mood of the country” as a prime example. Consider the vagueness and ambiguity of the standard Gallup question: “In general, are you satisfied or dissatisfied with the way things are going in the United States at this time?” Just on its face, this question almost certainly means different things to different respondents. For some respondents in the present period, it may mean how things are going with regard to the war in Iraq. For many other people, however, it may now mean various domestic issues such as problems in the housing market or high gasoline prices.
Method and Data Sources
We use data from numerous Gallup surveys conducted from February 2001 to December 2005[1] to estimate multivariate models of the direction-of-the-country item, with presidential approval, congressional approval, ratings of the current state of the economy, future economic expectations, and party identification as independent variables. Because the dependent variable is dichotomous, binary logistic regression is used. For each poll, then, we generate a measure of the relative potency of the independent variables as predictors of the “mood of the country.” If our incomparability-of-meaning hypothesis is correct, we should observe considerable variation over time in the relative potency of these predictor variables-even when the overall rating of the “mood of the country” appears to be relatively stable in the aggregate.
Findings
Figure 1 shows the trend in the “mood of the country” item. In 2001, satisfaction ranges from 56 percent to as low as 43 percent just prior to the events of September 11, 2001. Satisfaction then soared as part of a so-called “rally event” reaching 70 percent in December of 2001. After that five-year high point, the mood of satisfaction slowly declined to a low of 36 percent prior to the invasion of Iraq, then took a leap to 60 percent shortly after the war began in the middle of March 2003, closely tracking the increase in the President’s approval. But by early 2004, a majority of Americans reported that they were dissatisfied, and by the end of 2005 only 31–36 percent said they were satisfied, tracking rather closely the President’s dismal approval ratings.

Mood of the Country
The data patterns in Figure 2 give us some further insight into the meaning of the trend in the “mood of the country.” The figure is based on the logistic regression analysis described above, showing changes in the relative potency of the predictor variables, controlling for party identification. The entries forming the trend line are exponentiated logistic regression coefficients, which indicate the predicted change in the odds of being satisfied with “the way things are going in the United States at this time” – given a one unit change in the independent variable. For easier viewing, the figure presents quarterly averages of the exponentiated coefficients.
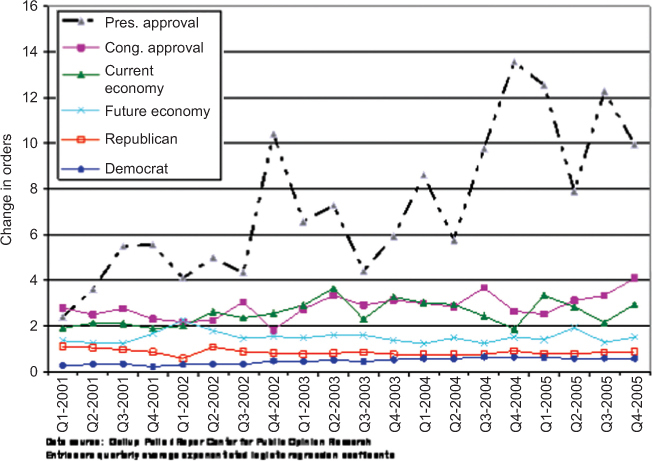
Predictions of Satisfaction Ratings
First, notice that the relative predictive power of presidential approval grows considerably over time. Notice too some of the key points at which presidential approval peaks as a predictor of the national mood in Figure 2: following September 11, 2001; just before the congressional election of 2002; shortly after the beginning of the Iraq war; and shortly before the election of 2004-all times at which the leadership of President Bush was highly salient to the public. And so it seems quite plausible that respondents would use the heightened visibility of Bush’s presidential persona in the mass media to disambiguate and interpret the very general question about “the way things are going.”
The trend data in Figure 2 also indicate that approval of “the way Congress is handling its job” becomes somewhat more important as a predictor of the mood of the nation beginning in 2003, and then reaches a plateau. So too do respondents’ assessments of the current condition of the economy and their expectations about the future of the economy loom larger over time in predicting overall satisfaction. While important, all of the changes in these other predictors are much less significant by comparison with the growing power of presidential approval as a key to understanding the meaning of changes in the national mood.[2]
But perhaps the most revealing pattern appears in Figure 3, which shows the pseudo R-Square for the model over time.[3] The same set of predictors explains more and more of the variance in the “mood of the country” with the passage of time. What starts out at the beginning of the Bush administration as a vague and ambiguous indicator of the “mood of the country” that is weakly or moderately linked to how the President, the Congress, and the economy are doing becomes steadily less fuzzy in the minds of respondents. By 2004–2005 the question’s meaning is much more about how George W. Bush is dealing with “the way things are going in the United States” though also more too about how Congress is handling things, and how things appear to be going in the economy. Changing events had altered its meaning-and-interpretation over time.

Summary and Conclusions
Because its meaning-and-interpretation is continuously shifting over time, comparisons of the “mood of the country” indicator over time become essentially invalid. One is not comparing an apple with an apple. To that extent, this standard question about the “mood of the country” is an ambiguous and potentially misleading indicator of American public opinion.
The notion that an identically worded question undergoes changes in meaning over time may seem foreign to some readers, but imagine we were talking here about the changes in “mood” resulting in part from differences in question wording or in question order and context; in that case, almost no one would disagree that we have a serious artifact problem on our hands. In practice, changes in the meaning of an identically worded and sequenced question are functionally equivalent to changes in wording or context. Temporal incomparability is temporal incomparability.
However, there is an upside to our findings as well, because we now have the beginnings of a new and simple, quantitative metric to systematically monitor how the meaning of the “mood of the country” question changes over time in tandem with real-world events and other indicators of the national mood.
Data Source: Roper Center for Public Opinion Research, University of Connecticut.
We know from other trend analyses (Bishop, Mockabee, and Rademacher 2006) that the events of September 11th and its aftermath, followed by the war in Iraq, were the dominant factors that drove respondents’ interpretations of the Gallup question about how the president was generally handling his job during the same time period.
Pseudo R-square indicates the “…reduction in the model ‘error’ due to the independent variables…” (Pampel 2000, pp. 48, 49). For easier viewing, the figure presents the quarterly averages of the pseudo-R2 values.