
Introduction
Telephone remains a dominant survey mode for surveys of the general public since most households have a telephone; only 4.8% of households nationwide do not have a phone (US Census). Some households have only a landline telephone, some have only a cell phone, some have both a landline and a cell phone, and some have multiple landlines and cell phones. Nationally, about 62% of households have their telephone number listed in a telephone directory (personal communication, Marketing Systems Group). Cell phone only households have increased from about 4% in 2004 to over 14% in 2007 (Blumberg et al. 2009). Given these changes in cell phone only households, should we be concerned about the possibility of coverage error in random digit dialing (RDD) samples?
There are multiple sampling frames that are available for drawing samples of the general public. (1) The random digit dial (RDD) sample frame provides the most complete coverage of landline telephones, since it includes all possible telephone numbers for all telephone exchanges within a geographic area. To improve efficiency at the expense of reduced coverage, list-assisted RDD is restricted to telephone banks with listed numbers. (2) A telephone directory sample frame of listed households includes names and addresses in addition to telephone numbers but excludes unlisted numbers. (3) A separate sampling frame of cell-phone numbers is available as well. The majority of cell phone numbers are excluded from the RDD sample frame, but because cell phone numbers are portable, some small proportion is included in the RDD frame as well.
Problem Statement
The issue for those conducting telephone surveys is how to draw a sample of telephone numbers that is representative of the population of a region. Until the advent of cell phones, the RDD sampling frame has been the preferred choice because of its high level of coverage, since mostly non-telephone households are excluded. The question for survey researchers is whether we can continue using the RDD sampling frame, without considering the cell phone only sampling frame, or whether we are biasing our results by not including cell phone only households (Link et al. 2007). Others have discussed their experiences with cell phone samples (Lutz et al. 2008), and indicated that it’s possible to include cell phone only samples in household surveys.
Methodology
To assess the extent of bias in sample frames we compared the results of a computer assisted telephone interview (CATI) survey of three different types of telephone numbers: (1) RDD cell phone only individuals; (2) RDD landline households that are directory listed; and (3) RDD landline households that are unlisted. The survey was conducted over five months in the fall of 2008, and consisted of a total of over 400 completed interviews per month. Interviews averaged 12 to 15 minutes in length. The survey questionnaire consisted of a core set of demographic questions, with a monthly supplement of additional questions, which changed monthly.
A dual frame sample for the survey was purchased from Marketing Systems Group (MSG). The dual frame included a RDD sample of landline telephone numbers from telephone exchanges in Washington State, as well as a separate RDD cell phone only sample of cell phone exchanges. In addition, the RDD sample was screened by MSG to identify listed telephone numbers, thereby further subdividing the RDD sample into listed and unlisted numbers. Table 1 below displays the final sample disposition for the three groups, and the total telephone numbers used for each of the three groups.
Results
Statistical comparisons of 16 demographic variables by sample resulted in 12 statistically significant differences. Table 2 displays the statistically significant differences. No statistically significant differences were found for either respondent education or income. Significant differences were also found for four of five attitudinal questions.
Demographic Characteristics of the Three Samples (click here)
Cell phone respondents are twice as likely to be under 30 as listed landline respondents, and almost four times as likely to be under 30 as unlisted landline respondents (Figure 1). Unlisted landline respondents are almost five times as likely to be 60 or older than cell phone respondents.

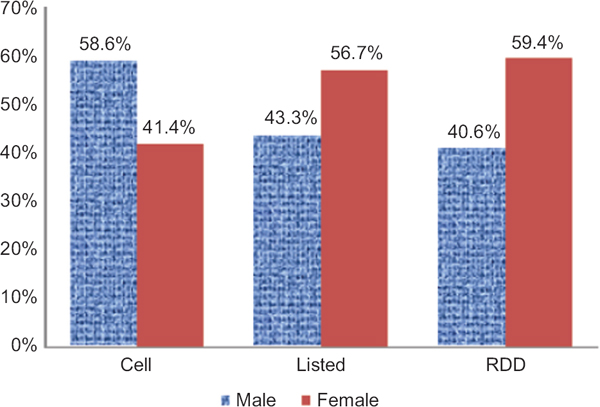
Figure 2 shows that males are more predominant among the cell phone respondents than among the unlisted landline or listed landline respondents. The cell phone sample picks up the younger males that are often missed in landline telephone samples.

Discussion and Conclusions
The results indicate that including cell phone only households in telephone studies can lead to substantial improvements in coverage based on demographic characteristics. Cell phone only respondents tend to be younger, single, and male, and tend to rent rather than own their home, and have either less or more education than respondents from listed and unlisted landline households. Cell phone only respondents are also more likely to have more than one cell phone, and to have full time employment. A significant difference was also observed for political party affiliation. We found significant differences in the characteristics of directory listed versus unlisted households as well. Listed households are the least likely to have a computer in the home, have fewer male respondents, have the highest proportion of retired and elderly respondents, and the highest proportion of white and married respondents.
The findings of this study indicate that survey researchers can no longer ignore cell phone only households.
- Such households now represent over 15% of the population.
- 33% of cell phone respondents have no landline telephone and thus would not have been included in a typical RDD landline sample of the public.
- Cell phone only households are quite different demographically from other households.
- Cell phone only households have different opinions than others on such issues as where tax dollars should be spent, and the outlook for their economic well-being.
Our findings are consistent with AAPOR’s recommendations that “RDD telephone surveys targeting subgroups in the U.S. with substantial percentages of adults who live in cell phone only households (e.g., 18 to 29 year olds; renters; and those below the poverty threshold) should sample cell phone numbers . . .” (AAPOR Cell Phone Task Force 2008).
Note
An earlier version of this paper was presented at 64th Annual Conference, American Association for Public Opinion Research, May 14-17, 2009, Hollywood, Florida.