

In the recent past the Netherlands has stood out as a country with rather low response rates; not a good starting position in a period when response rates are going down (De Heer 1999; De Leeuw, E. and W. de Heer 2002). This paper seeks to examine a number of assumptions on non-response in the Netherlands. Is the situation really so bad compared to other countries, and are response rates really going down? The answer to these questions will turn out to be negative. This leads to other questions: how were higher response rates achieved in the past few years? Can this level be maintained? And finally: do higher response rates result in a final sample that better represents the target population?
Figure 1 shows that the Netherlands (NL) is doing fairly well in the European Social Survey. Response rates are not as high as in the Scandinavian countries (NO, SE, FI) or Poland, but are higher than in Switzerland (CH), France (FR) and Germany (DE). Low response rates in the Netherlands need not be a fact of life.
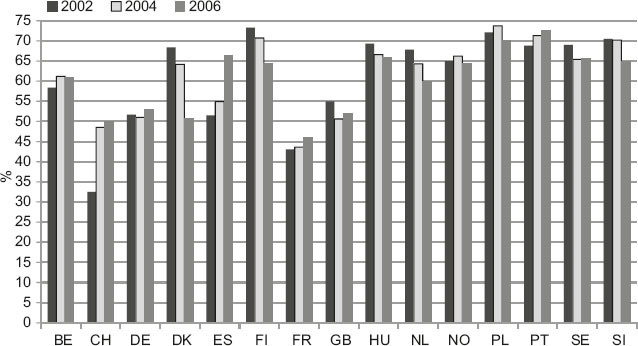
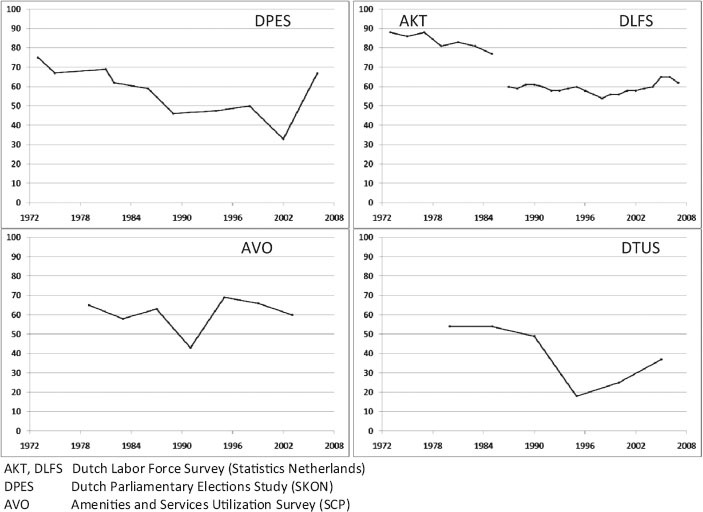
Figure 2 shows that response rates in a series of major Dutch face-to-face surveys were much higher in the past than they are today, but also that response rates have been going up again in recent years. This raises three questions. Why were response rates so high in the past? Why did they go up again? And can they be maintained at their present level?
The first question is why response rates were so high in the past. This could be due to the fact that people were less used to – and more interested in – surveys than nowadays, or that they were more ‘open’ to authority (these are mostly government surveys) or were more accustomed to people knocking on their door with all kinds of requests. It could also be that the procedures for calculating response rates were far less standardized than today. In many of the surveys no call records were kept; substitution must have taken place to some extent; and the distinction between ineligibility and noncontact may not always have been clear (or at least less clear than it is today). So in fact response rates may not have been as high as they appear.
Even if high response rates in the past may have been doctored a little, it is clear they went down initially. This was most likely due to lack of field efforts, a failure to adapt to the increasing difficulty of obtaining response. The increase in later years was due to a combination of extended field efforts (more contact attempts at different times of the day and on different days of the week and in some cases (AVO) extensive refusal conversion attempts and successes), better training and closer monitoring of interviewers, and the use of small incentives and informative advance letters and brochures. Compared to the past, obtaining fairly high response rates today takes a lot of work, a lot of time and a lot of money. If these investments are not made, response rates will be low. If they are made, Dutch results look quite good, including when compared with other European countries.
Despite these good results, it may still be difficult to maintain the present response rates. Extended field efforts may have held off the decrease in response rates, but they may not be able to counteract the continuing downward trend. Indeed, there is evidence that response rates are slowly declining again despite the efforts. The negative consequences of this can be deduced from studying the positive effect of the previous increase in response rates in the AVO (Stoop 2004) and DTUS (Van Ingen, Stoop, and Breedveld 2009), two long and time-consuming SCP surveys. These effects were studied partly out of methodological interest, and partly because these studies are designed to measure changes over time and the ‘time’ effect had to be distinguished from the ‘method’ effect.
In the AVO survey, as in many other studies, people living in urban areas, persons who pursue activities outside the home and persons who are part of smaller households are more difficult to catch at home. Increasing the number of calls, especially in the evening, resulted in higher contact rates and a better representation of those who are hard to reach. This is likely to reduce nonresponse bias, as the hard to reach participate more in cultural activities, for instance, even when corrected for background variables. In this survey, a large proportion of the respondents initially refused and had to be converted. Among these initially reluctant respondents were relatively few men and few singles. Rather than concluding that men and singles immediately cooperated, it turned out that they were less willing to participate at the first request and were also less susceptible to refusal conversion attempts by the interviewer. The same is true for people with a higher education level. After correcting for socio-demographic factors, there were very few differences between cooperative and initially reluctant respondents.
The final nonrespondents who cooperated in an 80% response follow-up survey of refusers more often partook in popular culture (movies, pop concerts, clubbing), played fewer sports, less often had a PC – but when they did have one they used it more for games and chatting on the Internet – and less often had a religious affiliation. Although the differences were not large and were limited to a small number of variables, they were not similar to the initially reluctant respondents in the main survey. In this study refusal conversion mainly brought in additional respondents who were very similar to those who were overrepresented anyway, and who were not similar to the final refusals.
In the DTUS, increasing the contact rate resulted in a larger share of respondents with paid jobs and a higher education level, whereas the proportion of elderly respondents decreased considerably. This makes sense as the former spend less time at home and the latter more. However, the employed, younger people and the better educated were overrepresented from the beginning (and the elderly underrepresented). The hard-to-reach respondents spent more time on commuting, which is likely due to their more often being employed. As compared to the refusers (or at least the 31% of the refusers who completed a short doorstep questionnaire), the respondents more often read newspapers, watched television and were interested in politics, played sports more frequently, traveled more during the week and were engaged in volunteer work more often. Contrary to expectations, there is no evidence, either in terms of actual (demands of work, traveling, household chores, etc.) and perceived time pressure, that busy people cooperate less. This confirms earlier findings that busyness is not a cause of nonparticipation in time use surveys, and that time use on voluntary work may be overestimated (Abraham, Maitland, and Bianchi 2006; Stoop 2005).
The results of the two studies are both reassuring and disconcerting. Reassuring because response rates can be enhanced substantially. We do not have information on the exact costs of improved sample and fieldwork designs and the higher response rates, partly because so many things change when a survey is conducted every 4 or 5 years that straightforward price comparisons are difficult. Also reassuring is that, after correcting for background variables, the effect of the increased response rates on survey estimates is limited. This means that time series are not damaged by method effects. The limited effect is also disconcerting, however. Firstly, because substantial funds have been spent on survey improvement whereas there is little evidence that these efforts manage to bring in respondents who would not have cooperated otherwise. The additional respondents belong to socio-demographic groups that would have been well-represented with smaller efforts. And secondly, they are disconcerting because the results from the AVO follow-up study and the DTUS basic questions suggest that the respondents who were hard to contact or initially reluctant differ to a certain extent from the final non-respondents on substantive survey outcomes, again after correcting for background variables. Enhancing response rates may thus not minimize bias.
The present results suggest that, rather than spending funds on increased fieldwork efforts to indiscriminately haul in additional respondents, it might be better to focus field efforts on target respondents who are unlikely to participate. Ideally this strategy would be adapted throughout the fieldwork process (Groves and Heeringa 2006). In addition auxiliary information should be collected on respondents and non-respondents from rich sample frames, interviewer observations, call records and reasons for refusal. In addition, high response basic question approaches or follow-up surveys of refusals could show us what we are missing or what is being distorted. High response rates are a means toward data quality. Low non-response bias is an indicator of data quality.
Note: This article is based on:
Stoop, I. 2008. Niet thuis voor de enquêteur. Facta nr. 16(3): 12–17.
Stoop, I., J. Verhagen and E. van Ingen. 2007. Increased fieldwork efforts, enhanced response rates, inefficient samples. In: (M. Trotman, et al., eds.) The challenges of a changing world. Proceedings of the 5th International Conference of the Association for Survey Computing. University of Southampton, September 2007, pp. 167–178.