Loading [Contrib]/a11y/accessibility-menu.js
Skip to main content
Survey Practice
  • Menu
  • Articles
    • Articles
    • Editor Notes
    • In-Brief Notes
    • Interview the Expert
    • Recent Books, Papers, and Presentations
    • All
  • For Authors
  • Editorial Board
  • About
  • Issues
  • Blog
  • Subscribe
  • search

RSS Feed

Enter the URL below into your favorite RSS reader.

http://localhost:28792/feed
Articles
Vol. 2, Issue 2, 2009January 31, 2009 EDT

Does Continuing Data Collection Beyond One Month Improve the Completion and Response Rates in Behavioral Risk Factor Surveillance System Survey?

Mohamed G. Qayad, Lina Balluz, William Garvin,
survey practice
https://doi.org/10.29115/SP-2009-0008
Survey Practice
Qayad, Mohamed G., Lina Balluz, and William Garvin. 2009. “Does Continuing Data Collection Beyond One Month Improve the Completion and Response Rates in Behavioral Risk Factor Surveillance System Survey?” Survey Practice 2 (2). https:/​/​doi.org/​10.29115/​SP-2009-0008.
Save article as...▾
Download all (1)
  • Figure 1  Distribution of BRFSS Sample. Michigan and Louisiana Excluded, 2007.
    Download

Sorry, something went wrong. Please try again.

If this problem reoccurs, please contact Scholastica Support

Error message:

undefined

View more stats

Abstract

Does Continuing Data Collection Beyond One Month Improve the Completion and Response Rates in Behavioral Risk Factor Surveillance System Survey?

The behavioral risk factor surveillance system (BRFSS) is an ongoing state-based random-digit-dialing (RDD) landline telephone survey. The data is used for monitoring national, state and local health objectives, and developing local health programs. States are required to call all monthly sampled telephone numbers within a month from their release to survey implementers. When samples are not completed within that month, states strive to complete them shortly thereafter. Despite this endeavor, BRFSS survey response and completion rates have been declining since 2002 (Centers for Disease Control and Prevention, n.d.). Other telephone surveys observed similar trends in response rates (Battaliglia et al. 2007; Groves et al. 2002). Recently, states expressed interest in exploring the effect of continuing the data collection longer than a month on the percentage of completed interviews and response rates.

Included among the factors contributing to this declining trend in the response rates cited by many studies are high refusal rates, increased telemarketing, use of new technologies, increase in single-person households, difficulty in contacting eligible respondents, decline in civic participation, lack of adequate leisure time, increased concern about privacy and confidentiality, demographic shifts in the U.S. population causing high language barriers, and physical and mental inabilities to complete the survey (Groves, Singer, and Corning 2000; Tourangeau 2004). These factors are often grouped into either refusal to cooperate, non-contacts or inability to participate (Groves and Couper 1998).

In 2007, the percentage of completed interviews of the total sample in the BRFSS survey was approximately 10%. Few states maintained or increased their 2006 completion rates (Centers for Disease Control and Prevention, n.d.). States and survey organizations are searching for ways to improve response rates. The impact of various methods on the response rates were examined (Kropf and Blair 2005). In BRFSS, the average number of calls per completed interview has increased recently in many states, indicating enhanced efforts to contact selected households. This, however, did not improve the completion or response rates (Centers for Disease Control and Prevention, n.d.). Additionally, retraining interviewers, hiring experienced interviewers and increasing hourly wages become routine practices for survey organizations and states as a potential means to improve response rates. Prolonging the length of time allotted for data collection also resulted in an increase in the response rate (Keeter et al. 2000).

In this paper, we examine whether continuing the data collection beyond one month improves the completion and response rates in BRFSS. If significant gains are observed, loosening the current BRFSS guidelines might become necessary.

Methods

We used the 2007 BRFSS data, a cross-sectional survey conducted in 50 states, Washington DC, and U.S. territories in collaboration with the Centers for Disease Control and Prevention (CDC). A representative sample of household landline telephone numbers is selected using a modified RDD method (Centers for Disease Control and Prevention 2006). Within the selected household an adult is selected randomly to be interviewed within 31 days, which is the current practice for data collection. We excluded Michigan and Louisiana from the analysis because of quarterly (3 months) data collection length for Michigan and data collection issues for Louisiana.

For each state, we estimated the percentage of the sample that was called and given a final disposition code (American Association of Public Opinion Research 2008), percentage of completed interviews and response rates in 31 days, 32 days–41 days and >41 days.

The numerator for the percentage of completed interviews was the completed and partially completed interviews (American Association of Public Opinion Research 2008). For the response rate numerator, we used the completed and partially completed interviews, and records indicating termination of interview in which at least 50% of the core questions prior to demographics section were answered. Because some states did not call all telephone numbers in the sample and could not have interview dates, we used a single denominator, as defined by American Association of Public Opinion Research (AAPOR) (American Association of Public Opinion Research 2008), to calculate response rates for 31 days, 41 days, and >41 days. We chose the single denominator because we were interested in the increase in the response rates as a result of the prolongation of the length of the data collection. We used SAS (SAS 9.1 1999) to calculate our estimates.

Results

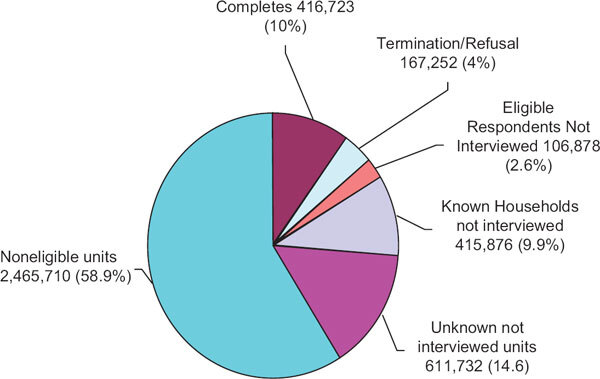
In 2007, excluding Michigan and Louisiana, a total of 4,184,515 telephone numbers were selected from the U.S. landline telephones for the BRFSS survey. We excluded 344 records with missing disposition codes and analyzed 4,184,171. Of these, 416,723 (10%) interviews were completed; 167,252 (4%) terminated or refused; 106,878 (2.6%) were eligible respondents not interviewed; 415,876 (9.9%) were households where the presence of eligible respondents could not be determined; 611,732 (14.6%) were numbers that could not be determined whether they belong to households or not; and 2,465,710 (58.9%) were ineligible numbers (Figure 1).

Figure 1  Distribution of BRFSS Sample. Michigan and Louisiana Excluded, 2007.

Of the total telephone numbers analyzed, 4,173,620 (99.7%) received a final disposition code in 2007. Of these, 3,184,631 (76%) were called and had valid information on the interview date and 988,989 (24%) were not called. Of the numbers called, 2,828,171 (89%) received final disposition code within 31 days, 258,041 (8%) between 32 days to 41 days, and 98,419 (3%) more than 41 days. The percentage of telephone numbers receiving final disposition varied by state (Table 1).

Table 1  Number and Percent of BRFSS sample called and given final disposition by interview duration by State, BRFSS 2007.
ST 0–31 days
32–41 days
42+ days
Total
No. % No. % No. %
AK 8,996 90.8 832 8.4 76 0.8 9,904
AL 29,541 87.3 4,060 12.0 245 0.7 33,846
AR 26,008 99.4 168 0.6 0 0.0 26,176
AZ 47,301 92.0 2,853 5.6 1,236 2.4 51,390
CA 63,963 80.5 8,497 10.7 7,000 8.8 79,460
CO 26,389 59.3 7,309 16.4 10,769 24.2 44,467
CT 86,286 80.0 18,931 17.6 2,603 2.4 107,820
DC 70,543 84.8 11,596 13.9 1,021 1.2 83,160
DE 28,710 100.0 0 0.0 0 0.0 28,710
FL 204,039 93.7 13,712 6.3 0 0.0 217,751
GA 118,779 83.2 19,865 13.9 4,036 2.8 142,680
GU 8,965 99.9 1 0.0 4 0.0 8,970
HI 30,130 98.4 494 1.6 0 0.0 30,624
IA 15,402 91.3 1,375 8.2 91 0.5 16,868
ID 23,277 100.0 0 0.0 0 0.0 23,277
IL 49,253 84.4 2,455 4.2 6,658 11.4 58,366
IN 29,490 97.3 810 2.7 0 0.0 30,300
KS 26,420 98.7 343 1.3 0 0.0 26,763
KY 22,337 69.5 7,049 21.9 2,765 8.6 32,151
MA 225,430 86.8 22,484 8.7 11,826 4.6 259,740
MD 97,270 81.8 18,279 15.4 3,431 2.9 118,980
ME 33,032 97.3 913 2.7 0 0.0 33,945
MN 32,408 86.6 2,762 7.4 2,270 6.1 37,440
MO 17,940 100.0 0 0.0 0 0.0 17,940
MS 49,587 99.2 403 0.8 13 0.0 50,003
MT 52,454 88.4 5,705 9.6 1,210 2.0 59,369
NC 34,841 66.8 8,229 15.8 9,100 17.4 52,170
ND 16,339 100.0 0 0.0 0 0.0 16,339
NE 29,184 100.0 0 0.0 0 0.0 29,184
NH 52,575 87.5 5,885 9.8 1,660 2.8 60,120
NJ 123,394 84.1 18,752 12.8 4,583 3.1 146,729
NM 15,612 73.9 4,874 23.1 639 3.0 21,125
NV 22,059 70.6 2,250 7.2 6,953 22.2 31,262
NY 54,379 98.6 777 1.4 0 0.0 55,156
OH 72,635 77.0 12,437 13.2 9,294 9.8 94,366
OK 22,913 94.4 1,363 5.6 0 0.0 24,276
OR 52,909 96.1 2,126 3.9 45 0.1 55,080
PA 83,785 99.0 871 1.0 0 0.0 84,656
PR 27,630 100.0 0 0.0 0 0.0 27,630
RI 36,237 86.2 5,120 12.2 668 1.6 42,025
SC 34,971 100.0 0 0.0 0 0.0 34,971
SD 23,603 98.1 453 1.9 0 0.0 24,056
TN 26,352 100.0 0 0.0 1 0.0 26,353
TX 211,150 92.1 11,899 5.2 6,181 2.7 229,230
UT 8,966 68.3 2,786 21.2 1,367 10.4 13,119
VA 55,873 82.9 9,459 14.0 2,078 3.1 67,410
VI 13,837 98.0 287 2.0 0 0.0 14,124
VT 24,935 98.4 397 1.6 0 0.0 25,332
WA 276,463 94.0 17,140 5.8 587 0.2 294,190
WI 44,620 95.7 2,006 4.3 8 0.0 46,634
WV 11,919 100.0 0 0.0 1 0.0 11,920
WY 27,040 99.9 34 0.1 0 0.0 27,074
Total 2,828,171 88.8 258,041 8.1 98,419 3.1 3,184,631

Of the 3,184,631 numbers called in 2007, 415,371 (13%) completed the interviews, of which 94.6% were completed within 31 days, 3.7% were completed between 32 days to 41 days and 1.7% completed after 41 days. The percentage of interviews completed in these three time intervals varied between states (Table 2). The median increase in the percentage of completed interviews was 3.4%.

Table 2  The number and percent of completed interviews by interview length for each State, BRFSS, 2007.
State 0–31 days
32–41 days
42+days
Total
No. % No. % No. %
AK 2,382 95.5 103 4.1 8 0.3 2,493
AL 7,052 97.3 186 2.6 12 0.2 7,250
AR 5,733 100 0 0 0 0 5,733
AZ 4,552 96.2 119 2.5 62 1.3 4,733
CA 4,395 77.2 686 12.1 610 10.7 5,691
CO 9,393 80.5 1,306 11.2 967 8.3 11,666
CT 7,129 94.8 359 4.8 35 0.5 7,523
DC 3,757 94.9 177 4.5 23 0.6 3,957
DE 3,991 100 0 0 0 0 3,991
FL 39,037 98.7 510 1.3 0 0 39,547
GA 7,226 93.8 413 5.4 64 0.8 7,703
GU 657 100 0 0 0 0 657
HI 6,566 99.4 37 0.6 0 0 6,603
IA 5,182 95.5 239 4.4 7 0.1 5,428
ID 5,315 100 0 0 0 0 5,315
IL 4,595 87.8 248 4.7 393 7.5 5,236
IN 5,978 99.8 13 0.2 0 0 5,991
KS 8,466 99.7 22 0.3 0 0 8,488
KY 5,576 85.7 780 12 149 2.3 6,505
MA 20,154 93.7 1,053 4.9 300 1.4 21,507
MD 8,397 95.1 343 3.9 89 1 8,829
ME 6,816 99.8 14 0.2 0 0 6,830
MN 3,890 81.5 546 11.4 338 7.1 4,774
MO 5,236 100 0 0 0 0 5,236
MS 7,774 99.5 34 0.4 3 0 7,811
MT 5,764 96.1 204 3.4 27 0.5 5,995
NC 11,446 77.6 2,072 14 1,233 8.4 14,751
ND 4,751 100 0 0 0 0 4,751
NE 10,944 100 0 0 0 0 10,944
NH 5,784 96.6 154 2.6 52 0.9 5,990
NJ 6,868 94.9 308 4.3 60 0.8 7,236
NM 5,776 89.9 588 9.2 60 0.9 6,424
NV 2,973 74.8 440 11.1 563 14.2 3,976
NY 6,518 99.9 7 0.1 0 0 6,525
OH 9,293 82.8 923 8.2 1,013 9 11,229
OK 7,218 98.6 102 1.4 0 0 7,320
OR 4,788 96.7 135 2.7 28 0.6 4,951
PA 13,223 99.9 8 0.1 0 0 13,231
PR 3,934 100 0 0 0 0 3,934
RI 4,334 96.3 141 3.1 24 0.5 4,499
SC 10,395 100 0 0 0 0 10,395
SD 6,811 99.1 60 0.9 0 0 6,871
TN 5,032 100 0 0 0 0 5,032
TX 16,333 94.7 533 3.1 382 2.2 17,248
UT 4,420 88 469 9.3 131 2.6 5,020
VA 5,865 94.6 276 4.4 62 1 6,203
VI 2,537 100 1 0 0 0 2,538
VT 6,934 100 2 0 0 0 6,936
WA 24,631 95.2 1,085 4.2 165 0.6 25,881
WI 6,699 90.7 689 9.3 1 0 7,389
WV 4,444 100 0 0 1 0 4,445
WY 6,160 100 0 0 0 0 6,160
Total 393,124 94.6 15,385 3.7 6,862 1.7 415,371

The CSARO response rates by state and length of data collection are shown in Table 3. The median CASRO response rate in 2007 for the US was 51%. It increased 1.4% after continuing data collection longer than 31 days.

Table 3  CASRO Response rates by length of data collection by State, BRFSS 2007.
State Numerator
Denominator

CASRO Response
Rate
Response
rate
31
days
41
days
42+
days
No. 31
days
41
days
42+
days
gain after
31days
AK 2,438 2,541 2,549 3,895 62.6 65.2 65.4 2.8
AL 7,315 7,501 7,513 14,001 52.2 53.6 53.7 1.5
AR 5,898 5,898 5,898 11,900 49.6 49.6 49.6 0.0
AZ 4,664 4,783 4,845 11,990 38.9 39.9 40.4 1.5
CA 4,610 5,296 5,906 16,670 27.7 31.8 35.4 7.7
CO 9,599 10,905 11,872 19,242 49.9 56.7 61.7 11.8
CT 7,277 7,636 7,671 21,625 33.6 35.3 35.5 1.9
DC 3,895 4,072 4,095 10,574 36.8 38.5 38.7 1.9
DE 4,011 4,011 4,011 9,281 43.2 43.2 43.2 0.0
FL 39,940 40,450 40,450 79,569 50.2 50.8 50.8 0.6
GA 7,487 7,900 7,964 23,434 31.9 33.7 34 2.1
GU 661 661 661 827 79.9 79.9 79.9 0.0
HI 6,711 6,748 6,748 13,536 49.6 49.9 49.9 0.3
IA 5,278 5,517 5,524 8,980 58.8 61.4 61.5 2.7
ID 5,480 5,480 5,480 10,684 51.3 51.3 51.3 0.0
IL 4,706 4,954 5,347 12,935 36.4 38.3 41.3 4.9
IN 6,189 6,202 6,202 13,127 47.1 47.2 47.2 0.1
KS 8,546 8,568 8,568 13,717 62.3 62.5 62.5 0.2
KY 5,614 6,394 6,543 10,878 51.6 58.8 60.2 8.6
MA 20,699 21,752 22,052 63,768 32.5 34.1 34.6 2.1
MD 8,619 8,962 9,051 28,858 29.9 31.1 31.4 1.5
ME 6,979 6,993 6,993 14,623 47.7 47.8 47.8 0.1
MN 3,897 4,443 4,781 7,795 50 57 61.3 11.3
MO 5,434 5,434 5,434 9,127 59.5 59.5 59.5 0.0
MS 7,926 7,960 7,963 15,163 52.3 52.5 52.5 0.2
MT 5,861 6,065 6,092 13,510 43.4 44.9 45.1 1.7
NC 11,710 13,782 15,015 27,026 43.3 51 55.6 12.3
ND 4,886 4,886 4,886 8,582 56.9 56.9 56.9 0.0
NE 11,149 11,149 11,149 17,059 65.4 65.4 65.4 0.0
NH 5,868 6,022 6,074 16,120 36.4 37.4 37.7 1.3
NJ 7,124 7,432 7,492 27,847 25.6 26.7 26.9 1.3
NM 6,014 6,602 6,662 11,758 51.1 56.2 56.7 5.6
NV 2,973 3,413 3,977 7,765 38.3 44 51.2 12.9
NY 6,831 6,838 6,838 17,510 39 39.1 39.1 0.1
OH 9,427 10,350 11,363 27,118 34.8 38.2 41.9 7.1
OK 7,417 7,519 7,519 13,285 55.8 56.6 56.6 0.8
OR 4,789 4,924 4,952 10,642 45 46.3 46.5 1.5
PA 13,643 13,651 13,651 30,602 44.6 44.6 44.6 0.0
PR 3,974 3,974 3,974 5,643 70.4 70.4 70.4 0.0
RI 4,440 4,581 4,605 11,266 39.4 40.7 40.9 1.5
SC 10,636 10,636 10,636 18,097 58.8 58.8 58.8 0.0
SD 6,986 7,046 7,046 11,380 61.4 61.9 61.9 0.5
TN 5,074 5,074 5,074 9,470 53.6 53.6 53.6 0.0
TX 16,875 17,408 17,790 45,655 37 38.1 39 2.0
UT 4,489 4,958 5,089 7,770 57.8 63.8 65.5 7.7
VA 6,023 6,299 6,361 16,535 36.4 38.1 38.5 2.1
VI 2,674 2,675 2,675 5,021 53.3 53.3 53.3 0.0
VT 7,045 7,047 7,047 12,359 57 57 57 0.0
WA 24,637 25,722 25,887 58,765 41.9 43.8 44.1 2.2
WI 6,863 7,552 7,553 12,913 53.1 58.5 58.5 5.4
WV 4,490 4,490 4,491 7,606 59 59 59 0.0
WY 6,285 6,285 6,285 11,740 53.5 53.5 53.5 0.0
Total 402,054 417,439 424,302 909,243 44.2 45.9 46.7 2.5
Median 49.75 50.9 51.25 1.4

Discussion

Continuing the data collection beyond 1 month shows a minimal contribution to the percentage of completed interviews and CASRO response rates, but the contribution is slightly higher on the percentage of the sampled telephone numbers that were given final dispositions than both of the former estimates. The median increase in the percent of completed interviews and the percentage of the sample that was given final disposition codes are 3.4% and 6%, respectively. Similarly, the median increase in the response rate is 1.4%. As the response rate and percent of completed interviews indicate, two essential measures of survey success, these gains could not warrant a change in the current guidelines, which is to complete the samples within a month. Improving the efficiency of the survey operation could result in similar gains within the limits of 1 month duration of data collection. Some states completed their samples within a month, and those adopted 3 months (quarterly) data collection length were not different than those following the current 1 month practice in the percent of completed interviews. Also, states that gave final disposition to their samples within a month include those that used large and small samples in their BRFSS survey, and did not confine themselves to call telephone numbers prescreened as working numbers and are likely households.

Furthermore, changing the current guidelines might compromise standardized practices, a major strength for the BRFSS data collection, which allowed survey analysts to compare parameters across states and territories. It could also bring unnecessary disruptions and confusion in survey operations and efficiency in the course of its implementation and introduce additional variation to estimates.

Although the majority of states continue to collect data after 31 days, the remaining numbers in their samples are completed shortly after 31 days, thus preserving comparability of information by time reasonably across states and counties. Seventy three percent of the sample called after 31 days received final disposition within 10 days from the 31 days. Similarly, 80% of the interviews completed after 31 days were completed within 10 days from the 31 days. Studies that examined the effects of the extended length of data collection on response rates showed varied effects (Groves, Lyberg, et al. 1988) and (Collins et al. 1988), which is consistent closely with our findings across states.

The observed minimal increase in the percent of completed interviews and CASRO response rate from the extended field period might not bias U.S. estimates in diseases, risk factors and disease-risk associations because the majority of completed interviews (95%) were captured within 31 days. Few states could experience biases in state and local estimates because of the wide variations in the proportion of completed interviews captured after 31 days. However, further studies are needed to verify the existence and determine the extent of such bias. Likewise, further studies are needed to examine the differences between the information captured before and after 31 days of data collection.

Our study has limitations. The analysis excluded two states and telephone numbers that were not called. We did not group the states by the organization or agency that collects the data, which could vary in their survey operation strategies. Therefore, generalization of the findings should consider these limitations. In addition, the BRFSS survey uses RDD landlines, and findings might not be applicable to surveys using other modes of data collection.

After 31 days of calling, telephone numbers that were hard to reach are the ones to be called further and are less likely to end up in completed interviews as the results show. Thus, continuing the data collection longer than 31 days is inefficient for landline telephone surveys. BRFSS survey shares similar problems with other landline surveys. Incorporating other modes of data collection, such as cell-phone and mail modes, to RDD landline could bring some solution to the declining response rate problem.

CDC disclaimer: The findings and conclusions in this report are those of the authors and do not necessarily reflect the official position of the Centers for Disease Control and Prevention.

References

American Association of Public Opinion Research. 2008. “Standard Definitions: Final Dispositions of Case Codes and Outcome Rates for Surveys.” http:/​/​www.aapor.org/​uploads/​Standard_Definitions_07_08_Final.pdf.
Battaliglia, J.M., M. Khare, F. Martin, C.M. Mary, B. Paul, and Saralyn. 2007. “Response Rates: How Have They Changed and Where Are They Headed?” In Advances In Telephone Survey Methodology, edited by J.M. Lepkowski, C. Tucker, J.M. Brick, E. de leeuw, L. Japel, P.J. Lavrakas, M.W. Link, and R.L. Sangster. New York: Wiley.
Google Scholar
Centers for Disease Control and Prevention. 2006. “BRFSS Operational and User’s Guide – Version 3.” http:/​/​www.cdc.gov/​brfss.
———. n.d. Behavioral Risk Factor Surveillance System. 2002-2007. Accessed August 2008. http:/​/​www.cdc.gov/​brfss/​technical_infodata/​quality.htm.
Collins, M., W. Sykes, P. Wilson, N. Blackshaw, et al. 1988. “Nonresponse: The UK Experience.” In Telephone Survey Methodology, edited by R.M. Groves, et al., 247–56. New York, NY: John Wiley and Sons.
Google Scholar
Groves, R.M., and M.P. Couper. 1998. Nonresponse in Household Surveys. New York: Wiley.
Google Scholar
Groves, R.M., D.A. Dillman, J.L. Eltinge, and R.J.A. Little, eds. 2002. Survey Nonresponse. New York: Wiley.
Google Scholar
Groves, R.M., L.E. Lyberg, et al. 1988. “An Overview of Non-Response Issues in Telephone Surveys.” In Telephone Survey Methodology, edited by R.M. Groves, et al., 192–211. New York, NY: John Wiley and Sons.
Google Scholar
Groves, R.M., E. Singer, and A. Corning. 2000. “Leverage-Salience Theory of Survey Participations: Descriptions and an Illustration.” Public Opin Q 64:299–308.
Google Scholar
Keeter, S., C. Miller, A. Kohut, R.M. Groves, and S. Presser. 2000. “Consequence of Reducing Non-Response in a National Telephone Survey.” Public Opin Q 64:125–48.
Google Scholar
Kropf, M.E., and J. Blair. 2005. “Eliciting Survey Cooperation: Incentives, Self-Interest, and Norms of Cooperation.” Eval Review 29 (6): 559–75.
Google Scholar
SAS 9.1. 1999. Cary, NC, USA: SAS Institute Inc.
Google Scholar
Tourangeau, R. 2004. “Survey Research and Societal Change.” Annu. Rev. Psychol 55:775–801.
Google Scholar

This website uses cookies

We use cookies to enhance your experience and support COUNTER Metrics for transparent reporting of readership statistics. Cookie data is not sold to third parties or used for marketing purposes.

Powered by Scholastica, the modern academic journal management system