Introduction
Although non-probability samples have been a part of statistical analysis from the beginning, there appear to have been only a handful of meaningful attempts to combine probability and non-probability samples (Yoshimura 2004). There are three likely reasons for the use of data from a non-probability sample when a probability sample is available. First, only the non-probability sample may contain the detailed outcomes of interest. Second, the non-probability sample may be substantially larger than the probability sample, allowing the possibility of substantially improved estimators if the increase in precision is not overwhelmed by bias from the non-probability sample. Finally, analysts will likely continue to use non-probability samples in lieu of probability samples in many settings.
Non-probability samples are likely increasing as Web surveys become increasingly entrenched in market research and other settings. Survey methodologists arguably should propose methods that can improve the quality of analyses obtained from these datasets, at least under clearly specified assumptions. This paper proposes a method to construct “pseudo-weights” for a non-probability sample that uses available data in both a probability and a non-probability sample to estimate probabilities of selection for the non-probability sample, had it actually been sampled via a randomized mechanism.
Methods for combining data from probability and non-probability samples have been proposed in the environmental sampling literature. Overton, Young, and Overton (1993) propose geographically matching “found” streams with probability-sampled streams. Brus and de Gruijter (2003) propose taking the results of a non-probability sample of a geographic region and using kriging to estimate the non-probability sample values at the locations of the probability sample, and to treat the resulting set of observed and predicted non-probability sample values as auxiliary variables in regression estimator for a population mean. In most settings, however, non-probability samples are simply treated as simple random samples from an undefined population, sometimes with severe consequences for the resulting inference. The Crash Injury Research Engineering Network (CIREN) database, constructed from data from patients entering one of eight Level III trauma centers in the US due to injuries from motor vehicle crashes (MVC), is a non-probability sample of crashes often used to analyze risk factors for injuries resulting from MVC (Horton et al. 2000; Siegel et al. 2001; Stein et al. 2006). This is done despite the fact that nearly all subjects have serious injuries, which can lead to substantial underestimation of risk factors or protective effects. In addition, the CIREN sample tends to under represent both more minor injuries and the most severe injuries, since the former tend to go to lower level trauma centers, and the latter directly to the morgue. In contrast, the National Automotive Sampling System’s Crashworthiness Data System (NASS-CDS) is a probability sample representative of all US towaway vehicle crashes (NHTSA 2008). However, NASS-CDS has more limited medical information than CIREN. When sufficient information is available in NASS-CDS to determine the outcome of interest, CIREN and NASS-CDS could be combined to take advantage of the increased sample size from both datasets; otherwise NASS-CDS could serve as a sample of controls to be combined with CIREN cases.
Below we propose a method for developing “pseudo-weights” to create a representative sample from the non-probability sample under model assumptions that can be partially tested. We also provide a brief simulation study motivated by the CIREN/NASS-CDS example to explore the viability of the method.
Method
From repeated applications of Bayes’ Rule, we have (Elliott and Davis 2005):
p(S∗=1|W)=P(W|S∗=1)P(S∗=1)P(W)=P(W|S∗=1)P(S∗=1)P(S=1|W)P(S=1)P(W|S=1)∝P(S=1|W)P(W|S∗=1)P(W|S=1)(1)
where S is an indicator for whether or not an element of the population was included in the probability sample, S* an indicator for whether or not an element of the population was included in the non-probability sample, and W a set of covariates available in both samples. (All components of (1) that do not condition on W can be treated as constants.) Estimates of the probabilities in (1) can be obtained and “pseudo-weights” equal to computed that can then be associated with subjects in the non-probability sample in the same manner as the cases weighted are associated with subjects in the probability sample. In particular, if the method for computing the probability of selection is known as a function of W, then P(S=1|W) can be computed directly; otherwise it will have to be estimated using, e.g., beta regression with a logit link (Ferrari and Cribari-Neto 2004) with the inverse of the probability sample weight as the outcome. Further, if we define Z as an indicator for whether or not the subject belongs to the non-probability sample, we have:
P(Z=1|W)=P(Z=1)P(W|Z=1)P(Z=1)P(W|Z=1)+P(Z=0)P(W|Z=0)⇒P(W|Z=1)P(W|Z=0)=P(Z=1|W)P(Z=0)P(Z=0|W)P(Z=1)∝P(Z=1|W)P(Z=0|W)(2)
Since in large samples,
and we have
P(W|S∗=1)P(W|S=1)(⋅∝P(Z=1|W)P(Z=0|W)(3)
where P(Z=1|W), and thus P(Z=0|W)=1–P(Z=1|W), can be estimated via, e.g., logistic regression. As a final step, we can normalize the non-probability weights so that they sum to the unweighted fraction of non-probability cases in the combined datasets (Korn and Graubard 1999, 278–84): for non-probability sample cases where while for the probability cases, for where is the unweighted on-probability sample size and nS is the unweighted probability sample size. The probability and non-probability cases can then be combined and treated as a probability sample with case weights
Variance estimates used the combined datasets that can be obtained using standard Taylor Series or jackknife approximations that accommodate unequal probability of selection. However, these approaches will underestimate variance since they do not account for sampling variability in the estimation of in the non-probability sample. To fully account for this, a jackknife or other replication method may be implemented in which the pseudo-weights are re-estimated as part of the step of computing the pseudo estimates for a given replication step, similar in fashion to re-computing postratification weights at each step in the jackknife procedure (Valliant 1993).
Simulation Study
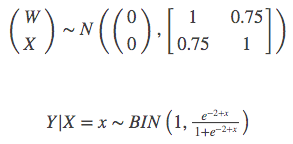
We develop a simulation study that crudely approximates the situation we face in combining CIREN and NASS-CDS. We consider a simulated population under the following model:

Thus W is a covariate associated with the probability of selection, X an exposure of interest correlated with W, and Y a dichotomous outcome of interest where the logit of the probability of Y=1 is –2+x. We simulated a single finite population of 100,000; the logistic regression population intercept was –1.989 and the logistic regression population slope was 1.002.
A probability sample of 50,000 cases was selected using sampling probability given by Another 50,000 cases were selected for possible inclusion in the “non-probability” sample using sampling probability (The probability of selection is available only in the probability sample in the analysis.) The probability of selection of the non-probability sample cases is more strongly associated with W than cases in the probability sampling frame. Thus, in the CIREN/NASS analogy, Y corresponds to an injury outcome and W to a crash severity measure. Only those with positive outcome were included in the non-probability sample, again to match the situation in CIREN/NASS.
We consider three analyses that estimate the relationship between Y and X: A probability sample-only analysis, an analysis that combines the probability sample and the unweighted non-probability sample, and an analysis which combines the probability and the non-probability sample using the pseudo-weights. The probability of selection for the probability sample cases is modeled using a linear term for W. We model the conditional odds of being in the non-probability versus the probability sample using a variety of functions of W and X to illustrate the tradeoff between model misspecification and variability due to model overfitting: in particular, we consider linear and quadratic models in W, with and without a linear term for X.
The results for bias, root mean square error (RMSE), and nominal 95% coverage from 200 simulations are shown in the Table 1. The analysis that combines the probability and the non-probability sample using the pseudo-weights with a linear relationship in W for the logit of the propensity to belong to the CIREN sample has the smallest RMSE and nearly correct coverage for the nominal 95% confidence interval (CI). The analysis that leaves the non-probability cases unweighted overestimates the relationship between X and Y, since a disproportionate fraction of large X values with Y=1 are sampled; also the variance of the estimated relationship is severely underestimated and the resulting CI coverage poor. The probability-sample-only analysis provides a nearly unbiased estimate of the relationship between Y and X, but the reduced sample size increases MSE and somewhat reduces the coverage of the 95% CI. Incorporating the uncertainty in the estimation of the weights using a jackknife estimator corrected the coverage of the combined probability and the non-probability sample using the pseudo-weights.
Misspecification (assume P(Z|W) is quadratic in W) damaged RMSE and coverage substantially. Fortunately it was easy to determine that misspecification was present, as the pseudo-weighted mean of W among the non-probability sample cases in the linear models was much closer to the weighted mean of W among the probability sample cases with injuries than in the quadratic models (see last column of Table 1).
While misspecification P(Z=1|W) is correctable if due to incorrect specification of functional forms or interactions, as is the case in this simulation study, it may not be correctable due to unobserved factors such as measurement error. An example of this might be non-random mode effects that occur when, for example, the probability survey is by phone or in-person, and the non-probability sample is a (self-administered) web survey. Alternative approaches that are more robust to misspecification of P(Z=1|W) PZ are areas for further research.
Summary
The proposed method constructs “pseudo-weights” for a non-probability sample in situations where a probability sample is available that shares in common some covariates that are predictive of the outcome of interest and/or the probability of selection. The simulation study indicates that bias and mean square error of both predictive and associative statistics can be reduced when combining a probability and non-probability sample using the method proposed here. In many settings, estimates of interest may only be obtainable from a non-probability sample; this method can only be used to make such a sample more representative if a probability sample with overlapping covariates is available.