This paper presents a brief synopsis of the historical development of hybrid sampling designs that combine traditional probability based sampling techniques with non-probability based quota designs to create model-aided sampling (MAS) designs. The MAS approach is illustrated for an application to a national business establishment survey called the Occupational Information Network (O*NET) Data Collection Program. Through simulation, we provide evidence that the estimates for this survey were not substantively biased by the MAS approach while data collection costs were substantially reduced.
For reference in this paper, a model-based sample design uses a model to create quotas in various categories thought to be related to the study variables of interest and then uses a non-random sampling mechanism to obtain the requisite number of respondents in each quota cell. Inference is based solely on the model. By contrast, a model-aided sample design [1] starts with a probability based sample of units combined with quotas to ensure minimum and maximum respondent sample sizes. A combination of the probability based design and the model are used for inference.
Development of hybrid probability and non-probability designs
In the 1950s, statisticians argued the merits of pure probability sampling versus model-based sampling. Leading proponents of the model-based sampling approach were Moser and Stuart (1953), and Stephan and McCarthy (1979). Proponents of the traditional probability based sampling (i.e., large sampling theory proposed by Neyman (1934)) methods argued that model-based sampling led to biased results (Kish 1965). Moser (1952) countered that, although model-based sampling may be biased with regard to certain characteristics, it may be quite satisfactory for others. The quality of estimates produced through model-based sampling depends on the model used to derive the sampling quotas. If the model holds, model-based sampling will likely give unbiased estimates of the population quantity, but if it does not, then the estimates will be biased and the extent of the bias will depend on extent to which the model assumptions are violated (Lohr 1999).
In order to bridge the theoretical gap, statisticians began developing hybrid approaches. For example, Sudman (1966) developed “probability sampling with quotas.” This design was empirically compared to traditional probability based sampling by Stephenson (1979) who found that it behaves much like traditional sampling, with no detectable bias for most questionnaire items.
Model-aided designs have also been implemented to ensure a representative sample when response rates are expected to be very low. Sanzo et al. (1993) used a combination of random sampling and model-based sampling to estimate the prevalence of Coxiell burnetii infection within a region in northern Spain. Another example is multiple inverse sampling (MIS) for finite populations proposed by Chang, Liu, and Han (1998). This design partitions the population into two or more subpopulations with known sizes. MIS is effective when one of these subpopulations is rare and it would be undesirable to obtain no or very few responses from the rare subpopulation. Several studies have shown how an unbiased mean and variance can be constructed under MIS and response data used in multiple logistic regression (see Liu and Chang 2000; Salehi et al. 2006; Salehi and Seber 2001). Further extending MIS, Salehi and Seber (2004) developed General Inverse Sampling (GIS). GIS is an adaptive sampling procedure where one divides the population into predefined quota cells. Then a preliminary sample is drawn by the traditional paradigm across all quota cells. Sampling is completed if the initial sample contains a prespecified number of units in each population cell. Otherwise, a sequential sample is drawn until either the prespecified number of units within each population cell is met or the total sample size reaches a predetermined amount.
Applying a model-aided design to the O*NET Data Collection Program
Sponsored by the U.S. Department of Labor and conducted by the National Center for O*NET Development and RTI International, the O*NET Data Collection Program provides a database containing information on a multitude of occupational attributes. The O*NET program uses a survey of workers contacted through a nationally representative business establishment survey that produces estimates for more than 800 occupations in the United States, across three occupational domains—work context, work activities, and knowledge. Hence, the O*NET Data Collection Program is simultaneously conducting over 2,400 surveys each of equal importance.
The initial sampling design for the O*NET data collection program was a traditional two-stage design that selected establishments in the first-stage and workers in one of the targeted occupations in the second stage (Berzofsky et al. 2007). Selected workers were randomized to one of the three occupational domains. Under the traditional paradigm, the number of completed surveys greatly exceeded our minimum sample target goals in occupations, such as Secretaries, that were common across a wide range of industries, but struggled to meet those minimum targets in occupations that were sparse, such as Marine Architects.
Due to the inconsistency in the number of respondents across each sub-population we wanted to develop a design that could control respondent sizes across occupations while still ensuring national inference that was representative of the entire occupation. To achieve this goal we developed MAS which incorporates aspects of a model-based design to ensure representativeness while retaining key aspects of the traditional paradigm.
MAS initially incorporates a sample selection mechanism from a traditional sampling paradigm. However, as data collection progresses, it uses a model to identify population subgroups where data collection should continue or cease with the aim of minimizing nonresponse bias. In this regard, the MAS strategy is not unlike the responsive design strategies described by Groves and Heeringa (2006).
Similar to GIS, MAS uses a random, multistage design to select employees in the occupations of interest, in order to ensure that no selection bias occurs. However, before sample selection, a sampling distribution, in the form of quotas (or cutoff criteria), is defined for each occupation, based on the distribution of the occupation by region, establishment size, and industry groupings for which the occupation is employed. A sample of establishments is drawn at the first stage. Then, occupations are randomly assigned to each establishment. The establishments are contacted and workers selected from the assigned occupations. Data collection follows a strict protocol to identify and contact establishments, as dictated by a traditional sampling paradigm, including multiple contact attempts to minimize nonresponse bias. Unlike the traditional paradigm, however, once enough questionnaires are projected to be completed in a quota cell for an occupation, further sampling contacts in that cell for that occupation cease. However, the selected establishments continue to be contacted for the other associated occupations. Once all quota cells are met, data collection is stopped for the entire occupation. At this point, weighted survey estimates using the probability based weights are poststratified to known population totals are created for inference to the population. Here we hypothesize that estimates for occupations created under MAS will not significantly differ from the estimates created under the current traditional paradigm. In other words, we hypothesize that responses from workers selected during the later portion of data collection do not differ significantly from the responses of workers selected earlier in the data collection period after accounting for the terms in the MAS model.
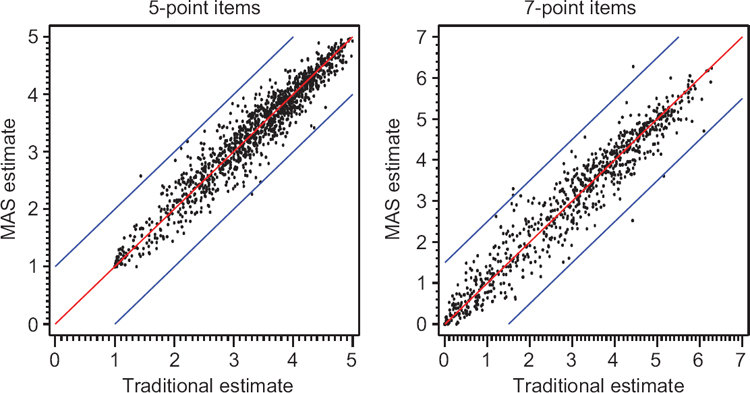
In order to test our hypothesis we simulated MAS across 79 occupations that were completed and had estimates published under the traditional sampling paradigm. MAS estimates were obtained by first determining the smaller sample that would have resulted had MAS been used for these occupations (Berzofsky et al. 2008). Based on O*NET research findings, the population variation of individuals around 5-point item estimates is approximately 0.5 to 1.0 scale points, whereas population variation of individuals around 7-point item estimates is approximately 1.0 to 1.5 scale points which “is typical of that found for well-developed level scales” (Mumford, Peterson, and Childs 1997). Therefore, we deemed the traditional estimates and the MAS estimates substantively similar if the difference in the mean estimate for an occupation and item were within that substantive confidence interval. As illustrated in Figure 1, over 99.5% of the estimates for 5-point and 7-point scale items fell within the substantive confidence interval. In addition to comparing the estimates to a substantive confidence band, we calculated the effect size using the standard deviation calculated under the traditional paradigm and compared the effect size to a standard normal distribution determining the percentage of items falling outside its interquartile range (IQR). We found that over 97% of estimates fell within the IQR for both 5-point and 7-point item estimates. Based on these findings, we concluded that workers selected later in the data collection period did not differ from those selected earlier when we ensured that all quotas were completed for an occupation.

Another beneficial byproduct of MAS is its impact on respondent burden hours. Because MAS allows data collection to be stopped in easy to find occupations once their MAS quotas have been achieved, we no longer have occupations that utilize an excessive amount of burden. In fact, MAS allows burden to be more evenly allocated across all occupations. Berzofsky et al. (2008) found that the respondent burden that would be used under MAS to complete the 79 occupations used in their simulation would decrease by 58.5% compared to what was actually used.
Based on these findings, we concluded that a model-aided sampling design could be used on the O*NET Data Collection Program without introducing bias. However, we caution that other studies need to determine if there is a difference between early and late respondents in terms of the main survey outcomes before implementing a model-aided design.
Model-aided sampling in this context is related to model-assisted sampling (Sarndal, Swensson, and Wretman 1992), but the two are not synonymous. The main difference is that the former uses modeling to guide sample selection but the model is not explicitly employed in the estimation. The latter is less dependent upon the model for sampling but it more dependent upon it for inference via regression estimation.