

The Veterans Health Administration (VHA) All Employee Survey (AES) is a voluntary, confidential annual survey of employee job satisfaction and employee perceptions of workplace climate. Survey researchers (e.g., Rogelberg and Stanton 2007; Stocke 2006) recommend offering several response modes to a survey. This serves to increase participation of different demographic groups and obtain results that adequately represent them all. The practice of offering Web, Interactive Voice Response (IVR) and paper response options has been adopted for the AES, but the majority of respondents across the survey years consistently choose the Web (over 75% since 2004, over 90% since 2008). The AES thus can be seen as predominantly a Web survey. The data obtained in all of the three modes are combined prior to analyzing and reporting the results. The objective of this paper was to examine if respondents selecting each of the modes differed in demographic characteristics, in how many questions they answered, and in the answers they gave.
The AES serves to systematically track employee perceptions of the organization, communicate them clearly between employees and management, and then to hold leaders accountable for articulating action plans and implementing improvements informed by the results of the system assessments (Young 2000). AES results are broadly disseminated within the organization and included in action plans at all of the VHA facilities, at the regional level, and nationally. Performance standards for VHA managers and executives require broadly sharing AES results with their workforce and planning specific improvements based on the survey information. Such an important organizational role of the AES requires that the AES results be representative of the different demographic groups of employees.
Given the increased popularity of Web-based tools and the decreased use of paper surveys within organizations, we also examined how any differences changed over time. The AES dataset has several features generally rare in organizational surveys. These features include data for the same survey that are available for several years (2004, 2006, annually thereafter) and for several modes (paper, IVR, Web-based), for multiple local organizations (hospitals, clinics, offices) all within the same organizational structure (VHA). In addition, the VA is the 2nd largest federal agency in the United States and its workforce is extremely broad and diverse. For example, the VHA AES workforce includes surgeons, policemen, engineers, canteen workers, pharmacists, photographers, clerks, designers and many other occupations, spread over all of the 50 states. AES ratings of the workplace environment thus reflect a rich variety of geographically, demographically and professionally different perspectives. We believe that these features of the AES dataset make for an informative comparison of survey results across administration modes. These results generalize to many contexts where organizational surveys are used.
Method
Data collection
The annual administration of the AES is preceded by an organization-wide marketing where all VHA employees are encouraged to take part in the AES. Through a single, widely distributed instruction document, employees receive detailed information on how to access each of the 3 modes: IVR, paper, and Web-based. Access to the Web-based questionnaire is through a URL maintained by a contractor. IVR access is through a toll free telephone number. Employees selecting the paper mode have to contact a site coordinator at each location to receive the questionnaire and a postage paid envelope to return it. In all cases, employees are given a 7-digit work group code to be entered on the questionnaire and are instructed to also enter an occupation code from a list. They are given assurance that responses would be confidential. The confidentiality of responses is strictly maintained throughout the data collection, analysis, and reporting processes. The AES is open for 3 weeks. After the survey closes, data are processed and reported to the organization within one month.
Data analysis
We calculated response rates using The American Association for Public Opinion Research (2008) RR2 method. Surveys with at least 80% of the non-demographic questions answered were considered ‘complete’, and surveys with at least 50 percent but less than 80% of the non-demographic questions answered were designated as ‘partial’. Only ‘complete’ and ‘partial’ questionnaires appear in the numerator of the response rates. The denominator of the response rates was the total number of VHA employees at the time the survey was offered. We used Cohen’s D (Cohen 1988) to calculate the effect size between Web-based versus IVR and Web-based versus paper modes for the 58 survey questions for all respondents and also for selected demographic subgroups. An effect size greater than or equal to 0.2 was considered to be of practical significance. We used the t-test (p(t)≤0.05) to determine the statistical significance of mean differences between Web-based versus IVR and Web-based versus paper modes for the 58 survey questions for all respondents and for demographic subgroups.
Results
Overall, from 2004 through 2008, the number of completed AES questionnaires increased from 104,155 to 163,831 (Table 1). Response rates based on the number of VHA employees were 51.5%, 69.7%, and 72.4% for 2004, 2006, and 2008, respectively. During this interval, the proportion of respondents selecting IVR or paper modes decreased, and the proportion selecting Web-based surveys increased.
Mode preferences for demographic subgroups
For 2004, 2006, and 2008, males were more likely to select paper and less likely to select Web-based questionnaires than females. In 2004, males were less likely to select the IVR mode than females were, but more likely than females to select this mode in 2006 and 2008.
For all years, the less-than-20 age group selected the IVR mode much more frequently than the other age groups. For all years, selection of paper and IVR over Web-based modes tended to increase with age-group.
For all years, Hispanic respondents were more likely to select the IVR and paper modes and less likely to select the Web-based mode than non-Hispanics. These differences narrowed between 2004 and 2006 and again between 2006 and 2008.
Mode selection for the 6 racial classifications was variable among groups and over years. In general Blacks and American Indians were similar in their mode preference, as were Asians and Whites. Those respondents self-classifying as Multi-racial were much more likely to select IVR over the paper and Web-based modes.
Within years, mode selection was similar among groups based on length of time working at the VA and based on supervisory level.
For all years, there was little variation in mode selection among occupation groups except for wage grade employees (hourly paid occupations that typically do not require extensive professional training, such as housekeepers or canteen workers). Wage grade employees were much more likely to select the IVR and paper modes and less likely to select the Web-based modes than other occupation groups. These differences narrowed between 2004 and 2006 and between 2006 and 2008.
Mode preference and number of demographic and non-demographic responses missing
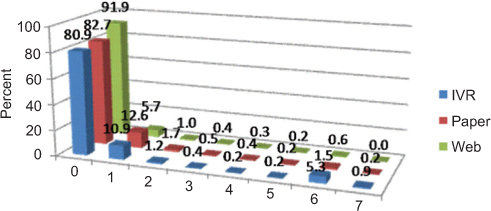
In 2004, respondents selecting each of the 3 modes had similar patterns of the number of missing responses for the 7 demographic questions. In 2006 and 2008, however, respondents selecting the paper mode had a higher proportion of unanswered demographic questions than respondents selecting the IVR and Web-based modes (Figures 1–3).


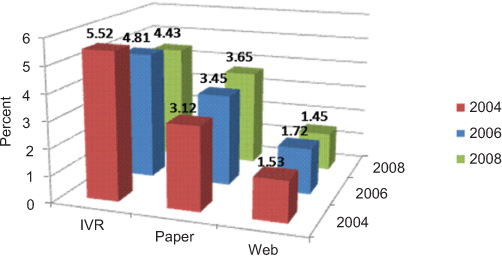
For all years, respondents selecting the IVR mode had a higher proportion of questionnaires with more than 5 non-demographic questions missing out of 58 than respondents selecting Web-based surveys (Figure 4). Respondents selecting the paper mode had intermediate proportions of surveys with more than 5 non-demographic responses missing.

Mode preference and effect size for non-demographic questions across subgroups
For all years, all respondents and 58 question means, there were no questions with effect size (Web-based versus paper modes) ≥0.2. There were 4, 7, and 15 questions with effect size ≥0.2 (Web-based versus IVR modes) in 2004, 2006, and 2008, respectively. Only one question with effect size ≥0.2 (Web-based versus IVR modes) in each of 2006 and 2008 had means that were statistically significantly different.
Statistically significant effect sizes ≥0.2 were more common among the demographic subgroups studied (males, females, <20 year olds, >60 year olds, whites, blacks, <6 month tenure, >20 years tenure, supervisors, and non-supervisors) than in the overall VHA population. Among the demographic subgroups, there were more statistically significant effect sizes ≥0.2 for the Web vs. IVR contrast compared to the Web vs. paper contrast.
Discussion
This paper sought to determine if respondents selecting each of the modes differed in demographic characteristics, in how many questions were answered, and in the answers they gave. We also wanted to know how any differences changed over time.
Over the 6 year period reported here, respondents to the VA’s AES were increasingly likely to select the Web-based mode when given the option of using Web-based, IVR and paper modes. Possible reasons for this trend include increasing familiarity with the Internet and computers among the general population, the relative ease of taking a survey electronically, and efforts by the VA to increase access to computers for employees who do not regularly use them in their jobs. Regardless of the reasons for this trend, if it continues, the VA might be able to consider eliminating the paper and/or IVR modes because the loss of information from the reduced number of completed questionnaires would be small in relation to the costs of offering these modes.
The mode preferences among the subgroups within the major demographic categories were similar for each year with few exceptions. The <20 year old age group was much more likely to select the IVR mode than the other age groups. Wage grade employees were more likely to select the IVR and telephone modes than were the other occupation groups. One possible explanation for these preferences could be that both groups might have more limited access to a computer. The higher preference of multiracial respondents for the IVR compared to other racial groups is difficult to explain, especially since it consistently occurs in all years. If only the Web-based mode were used for AES, it is possible that at least some of the information for the <20 year old, wage grade, and multiracial employees would not have been captured. Of course, it is not possible to determine how many employees choosing the IVR and paper modes would have used the Web-based mode if it were the only one available.
The number of missing demographic questions out of a total of 7 was similar among modes in 2004. In 2006 and again in 2008, the proportion of surveys with 6 or more demographic questions missing increased dramatically for respondents selecting the paper mode. Because demographic questions are placed at the end of the questionnaire, a possible explanation for the increase in demographic questions missing for the paper mode is respondent fatigue. However, the proportion of paper surveys with more than 5 non-demographic questions missing increased only slightly from 2004 to 2008, and this proportion was less than that for the IVR mode. It is unlikely that respondent fatigue would affect only the demographic questions and not the non-demographic questions, and only for the IVR mode. Another possible explanation is that as the number of respondents selecting the paper mode decreases, the employees still using it are somehow less likely to answer demographic questions. These employees become a larger relative proportion of the paper responses and thus so does the number of questionnaires with ≥6 missing demographic questions. Again, if this occurred, a similar effect should be seen among the IVR surveys, but it is not.
Based on effect size, respondents selecting the paper mode were more similar to respondents selecting the Web-based mode than those selecting the IVR mode were to those selecting the Web-based mode. This finding held for the total population and also for most of the demographic subgroups. These results suggest that, regardless of differences in question completion rates, paper surveys did not add much additional information on the surveyed population beyond what was captured by the Web-based surveys. On the other hand, the overall survey means would have been different had the information from the IVR surveys not been included.
Limitations
Although the VA tries to make all 3 modes available equally to all employees, we have no way to assess how much convenience influenced choices of survey mode. Differences among modes with regard to missing responses and question means could be due to something inherent in the mode itself, to the person selecting the mode (all things being equal), or to the relative ease with which each mode can be accessed by particular respondent groups.
Since demographic answers are self-disclosed, it is not possible to independently determine the likely accuracy of the responses.
We are not able to assess if respondents would switch to a different mode or would not participate if a particular mode was not offered as an option.
Conclusions
The AES is very important to the VA’s efforts to improve its efficiency and effectiveness while maintaining customer and employee satisfaction. In order to accommodate employee preferences and thereby maximize response rates, the AES is offered in 3 modes. Although employees are increasingly likely to select the Web-based mode, in 2008 approximately 7.5% of employees were still using the IVR and paper modes. There were few differences in mode preference among demographic groups and subgroups. There were also few statistically significant differences in question response means among these groups when Web-based is compared to paper mode. There were more such differences between Web-based and IVR modes. It is unlikely that elimination of the paper mode would lead to significant changes in the demographics of the respondents or to the answers they provide. An increase in missing demographic questions could be expected. If the IVR mode were to be eliminated, there would be little change in the demographic characteristics of the respondent and the proportion of demographic questions missing, but response means could be expected to be different. If the trend toward Web-based mode continues, any overall changes to demographic patterns, missing rates, or response means due to elimination of the IVR or paper modes can be expected to diminish.